 🔨 Auction
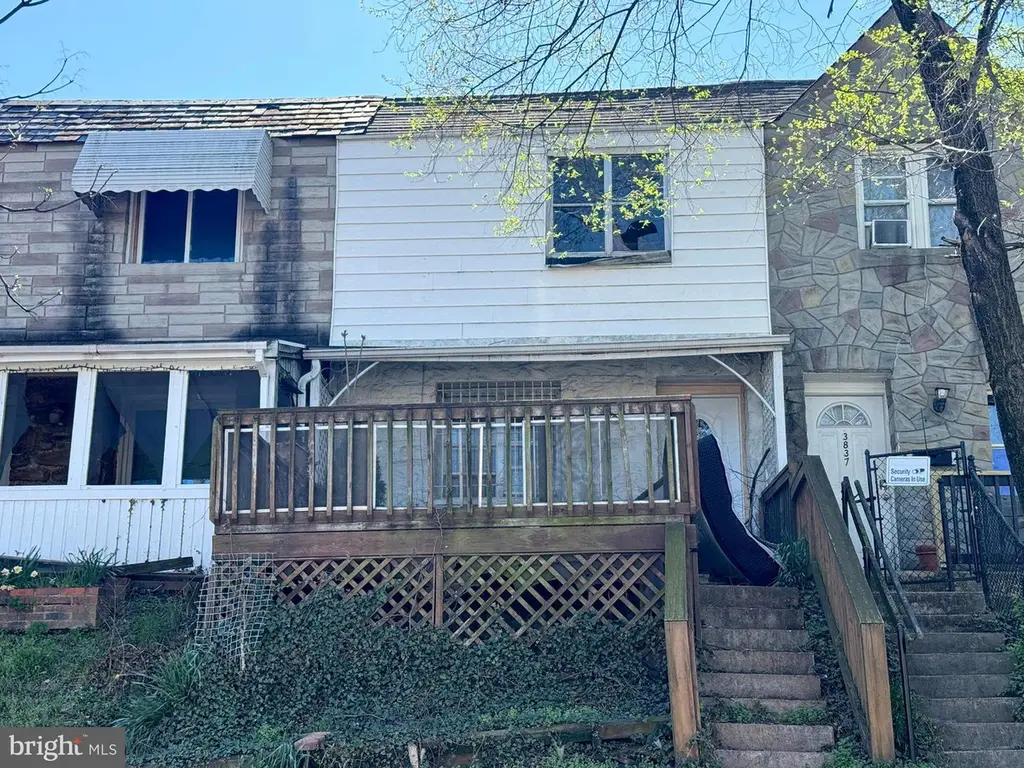
3835 8th St · Baltimore, MD
Flood risk 1/10 · Minimal
- FEMA flood zone
- X (unshaded)
- Chance of flooding over 30 yrs
- 0.0%
- Est. flood insurance / yr
- $473 – $860
Fire risk 1/10 · Minimal
- Est. fire insurance / yr
- $755 – $1,403
Heat risk 8/10 · Major
- Hot days now (above 103°F)
- 7 days/yr
- Hot days in 30 yrs
- 15 days/yr
Wind risk 6/10 · Moderate
- Chance of severe wind over 30 yrs
- 27.0%
Air-quality risk 4/10 · Minor
- Unhealthy air days now
- 5 days/yr
- Unhealthy air days in 30 yrs
- 7 days/yr
Risk factors via First Street. Map © Google.
Why this score? — see what drove the C+ grade
The composite is a weighted blend of 9 inputs, each scored 0–100. Each bar is that input's sub-score; the figure is the points it added to the 100-point composite (weight × sub-score).
- Cash flow +26.8/30.0
- DSCR +9.2/10.0
- ARV discount +7.5/15.0
- 1% rule +7.2/10.0
- Livability +3.8/5.0
- Rent growth +3.5/5.0
- Condition / age +2.5/5.0
- Schools +1.0/10.0
- Appreciation +0.0/10.0
$30,000
🖨 Deal sheet 📄 Offer letter ✓ Due diligence
Listing remarks MLS
ONLINE REAL ESTATE AUCTION!! Bidding Opens - Tuesday, May 5, 2026. Bidding Closes - Thursday, May 7, 2026 at 12:00 PM. List price is opening bid only. Two story townhome in the Brooklyn area of Baltimore City. Brooklyn has been changing rapidly with an increase in development over the last few years. Close to The Baltimore Peninsula and Anne Arundel County, the area is convenient to many employment centers and major highways. The house is ideal for investors who want to renovate and resell or use it as a rental.
Key facts
- Built 1942
- Listed 57 days
Neighborhood map
What this means for you Summary
Snapshot
- This is a 3-bed/1.0-bath townhouse listed at $30k.
Deal economics
- At list price, monthly cash flow is $414 ($5k/yr) — positive.
- The deal already cash-flows at list — no discount required.
- Meets the 1% rule at list price ($2k rent vs $30k).
- Recommended offer: $29k (3.0% below list) — sets the bar for market timing.
- Cap rate 9.6% vs local median 6.0% in Baltimore — top-decile yield for the area; either an underpriced asset or a hidden risk that comps aren't pricing in. Stress-test before assuming the spread holds.
Location & tenants
- Location reads 76/100 on livability (#90 in MD, #3,396 nationally) — a middle-class / working-renter tenant base. Strengths: amenities A+, commute A+, housing A+; Watch: schools D, crime F.
- Baltimore City Public Schools (urban): math 7% / reading 16% proficiency, ranked #24 of 24 in MD (top 100%) — low school quality limits family demand, transient renter base, plan for 1-2y turnover; 79% free/reduced lunch — lower-income household profile, screen leases tightly.
- Market conditions: Rents rising fast (+4.1%/yr); 165 active listings in the ZIP; 30 comparable units currently listed for rent nearby; rentals at typical pace (median 24d on market — plan ~3-4 weeks tenant-placement turnaround); 1,273 units permitted in Baltimore city in 2024 (1,104 in 5+ unit buildings).
- This rent runs 41% of the median local income ($54k/yr) — at the standard rent-burdened threshold; future hikes will face affordability resistance.
Forward outlook
- Local home prices are declining (-3.0%/yr); year-one equity from $1k of loan paydown is wiped out by about $5k of value loss. Plan a longer hold.
- Baltimore County population projected to shrink 4% by 2050 — rents likely to lag national; underwrite the cash flow, not the appreciation.
- At projected returns (-3.0% appreciation + 4.1% rent growth), your $42k cash investment doubles in ~9 years — after that, you're playing with house money.
Negotiation context
- It's been on market 57 days — a 3% lower offer ($29k) is reasonable based on typical stale-listing flexibility.
Risks & watch-outs
- Watch-outs: property tax is 7.5% of price; built in 1942 — expect roof / HVAC / electrical / plumbing capex.
- Climate carrying-cost: major wind risk, 27% chance of damaging wind over 30y; extreme-heat days projected 7→15/yr by 2055 (HVAC capex compounding) — expect insurance premiums to compound above CPI over the hold.
Questions for the listing agent
- It's been on market 57 days. Have you received any prior offers? Is the seller open to a 3% concession, seller financing, or rate buy-down credit?
- Built in 1942 — when were the roof, HVAC, electrical panel, plumbing, and water heater last replaced?
- Property tax is high relative to price — has the assessment been appealed recently, and will the sale trigger a re-assessment?
- Is there a deadline driving the sale (1031 exchange, divorce, estate, relocation)? That informs how much negotiation room exists.
- Schools are D-rated, which usually means shorter tenancies and higher turnover. Who's the typical renter profile here, and what's been the actual vacancy rate?
- Crime grade is F in this area — have there been break-ins, vandalism, or insurance claims at this property in the last 3 years? What carrier currently insures it and at what premium?
- What's the average days-on-market for RENTAL listings here right now (not sales)? A rising rental-DOM trend means longer vacancies and softer asking-rent achievability than the comps imply.
- What's the recent tenant-quality profile in this submarket — average credit score on applications, eviction rate, late-payment / NSF rate, and stable-employment percentage? A property-management company in the area should have these aggregated.
- How much new for-sale + rental construction is in the pipeline within 1–3 miles? Heavy new supply typically softens prices + rents 12–24 months out; constrained supply supports both.
Investment metrics
- 1% rule
- 1.22% ✓
- Cap rate
- 9.59%
- Cash-on-cash
- 11.78%
- DSCR
- 1.52
- GRM
- 6.8
CMA / ARV
- ARV (median comp)
- $150,473
- List price
- $30,000
- Delta
- -80.06%
- Verdict
- UNDERPRICED
- Comps
- 20 within 1.0 mi
Show comp detail 12 sales within ~0.75 mi
| Address | Dist | Beds/Ba | Sqft | Sold | Price | $/sf | Match |
|---|---|---|---|---|---|---|---|
| 3948 Brooklyn Ave | 0.14mi | 3/1.5 | 1,080 (-1%) | 0mo | $90,000 | $83 | 90 |
| 3712 8th St | 0.09mi | 2/1.5 (-1) | 1,088 (0%) | 0mo | $60,000 | $55 | 89 |
| 916 Jack St | 0.14mi | 3/1.5 | 1,116 (+3%) | 1mo | $145,000 | $130 | 86 |
| 4009 8th St | 0.08mi | 2/2.5 (-1) | 1,088 (0%) | 2mo | $223,000 | $205 | 84 |
| 814 Jack St | 0.06mi | 4/2.0 (+1) | 1,116 (+3%) | 1mo | $140,000 | $125 | 83 |
| 4132 Doris Ave | 0.27mi | 3/1.5 | 992 (-9%) | 1mo | $215,000 | $217 | 70 |
| 3507 4th St | 0.48mi | 2/1.0 (-1) | 1,102 (+1%) | 2mo | $50,000 | $45 | 69 |
| 4144 Townsend Ave | 0.32mi | 3/1.5 | 992 (-9%) | 3mo | $90,100 | $91 | 66 |
| 28 Talbott St | 0.67mi | 3/1.0 | 1,120 (+3%) | 2mo | $80,000 | $71 | 62 |
| 3916 2nd St | 0.54mi | 3/2.0 | 1,024 (-6%) | 2mo | $247,000 | $241 | 59 |
| 3541 3rd St | 0.50mi | 2/1.5 (-1) | 1,190 (+9%) | 2mo | $167,500 | $141 | 52 |
| 1614 Popland | 0.73mi | 4/2.0 (+1) | 1,236 (+14%) | 0mo | $220,000 | $178 | 34 |
Match score weights: distance 35% · size 25% · config 20% · recency 20%. Top-matched comps best support the ARV.
Projected returns pro-forma
-3.0% appreciation · 4.08% rent growth · sell at horizon
- IRR
- 2.5%
- Equity multiple
- 1.10×
- Total profit
- $4,016
- Equity at exit
- $22,436
- IRR
- 13.1%
- Equity multiple
- 2.09×
- Total profit
- $46,018
- Equity at exit
- $13,010
Cash invested: $42,133 (down + closing). Projections, not guarantees.
Landlord ↔ Tenant lean methodology
- Overall (CITY)
- 12 Strongly Tenant-Friendly
- State Maryland
- 27 Tenant-Leaning · D+14
- County
- — inherits STATE
- City Baltimore
- 12 Strongly Tenant-Friendly · D+58
ZIP-level market 21225
- Home prices YoY
- -31.9%
- Rents YoY
- 4.1%
- Active inventory
- 165
- Price-to-rent
- 1.4×
Monthly cashflow live
- Estimated rent
- $1,840 high interval (Pro) →
- Mortgage (P&I)
- −$789
- Tax est. 1.5%
- −$188 /mo · $2,257/yr
- Insurance
- −$63
- HOA
- −$0
- Vacancy / Maint / Mgmt
- −$386
- Net cashflow
- $414
Break-even live
UW: 25.0% down · 7.5% · 30yr · 1.5% tax · 5.0% vac · 8.0% maint · 8.0% mgmt
Financing live
Cash to close
- Down payment
- $37,618
- Closing costs
- $4,514
- Reserves months
- —
- Total cash needed
- —
Loan-product check · same deal, 3 products live
Conventional
25% down · 7.5% · 30yr
- Down + closing
- —
- Monthly P&I
- —
- Monthly cashflow
- —
- DSCR
- —
- Eligible?
- —
Personal DTI + credit; lowest rate.
DSCR
20% down · 8.5% · 30yr
- Down + closing
- —
- Monthly P&I
- —
- Monthly cashflow
- —
- DSCR
- —
- Eligible?
- —
No personal income docs; deal must DSCR.
Hard money
10% down · 12.0% · 12mo
- Down + closing
- —
- Monthly P&I
- —
- Monthly cashflow
- —
- DSCR
- —
- Eligible?
- —
Short-term bridge; refi at stabilization.
Rent comps 30 comps
| Address | Beds | Baths | Sqft | Rent | $/sqft | DOM | Units | Dist |
|---|---|---|---|---|---|---|---|---|
| 3840 8th St Brooklyn, MD | 3.0 | 1.5 | 1088 | $1,606 | $1.48 | 4d | 1 | 0.03mi |
| 507 Washburn Ave Brooklyn, MD | 3.0 | 1.5 | 1024 | $2,500 | $2.44 | 20d | 1 | 0.19mi |
| 507 Washburn Ave Brooklyn, MD | 3.0 | 1.5 | 1024 | $2,500 | $2.44 | 4d | 1 | 0.19mi |
| 507 Washburn Ave Brooklyn, MD | 3.0 | 1.5 | 1024 | $2,500 | $2.44 | 24d | 1 | 0.19mi |
| 3826 10th St Unit Entire House Baltimore, MD | 3.0 | 2.0 | 1110 | $2,400 | $2.16 | 24d | 1 | 0.21mi |
| 3828 10th St Brooklyn, MD | 3.0 | 2.0 | 1215 | $2,350 | $1.93 | 43d | 1 | 0.21mi |
| 3816 W Bay Ave Unit 1 Baltimore, MD | 2.0 | 1.0 | 1364 | $1,155 | $0.85 | 3d | 1 | 0.31mi |
| 4201 Audrey Ave Unit 1 Brooklyn, MD | 2.0 | 1.0 | 1400 | $1,350 | $0.96 | 24d | 1 | 0.32mi |
| 4206 Audrey Ave Brooklyn, MD | 3.0 | 3.0 | 1104 | $1,950 | $1.77 | 24d | 1 | 0.33mi |
| 4206 Audrey Ave Brooklyn, MD | 2.0 | 2.0 | 1104 | $1,275 | $1.15 | 43d | 1 | 0.33mi |
| 3528 6th St Brooklyn, MD | 2.0 | 2.5 | 1060 | $1,500 | $1.42 | 17d | 1 | 0.33mi |
| 1049 E Patapsco Ave Unit a Baltimore, MD | 2.0 | 1.0 | 748 | $1,257 | $1.68 | 43d | 1 | 0.36mi |
| 3569 4th St Brooklyn, MD | 2.0 | 1.5 | 1256 | $1,200 | $0.96 | 17d | 1 | 0.38mi |
| 4400 4th St Unit BASEMENT Baltimore, MD | 2.0 | 1.0 | 925 | $1,350 | $1.46 | 43d | 1 | 0.48mi |
| 3513 Horton Ave Brooklyn, MD | 3.0 | 1.0 | 1020 | $1,600 | $1.57 | 17d | 1 | 0.48mi |
| 1305 E Patapsco Ave Brooklyn, MD | 3.0 | 1.5 | 930 | $1,650 | $1.77 | 4d | 1 | 0.48mi |
| 4207 3rd St Unit 3 Brooklyn, MD | 2.0 | 1.0 | 850 | $1,595 | $1.88 | 5d | 1 | 0.50mi |
| 1353 Cambria St Brooklyn, MD | 3.0 | 2.0 | 986 | $1,600 | $1.62 | 17d | 1 | 0.53mi |
| 5215 Wasena Ave Brooklyn, MD | 3.0 | 1.0 | 1030 | $1,650 | $1.60 | 43d | 1 | 0.62mi |
| 1517 Sycamore St Curtis Bay, MD | 3.0 | 1.5 | 1210 | $1,999 | $1.65 | 24d | 1 | 0.64mi |
| 4216 Prudence St Curtis Bay, MD | 4.0 | 3.0 | 1116 | $2,100 | $1.88 | 43d | 1 | 0.65mi |
| 5227 Patrick Henry Dr Brooklyn, MD | 2.0 | 1.0 | 736 | $1,326 | $1.80 | 21d | 1 | 0.70mi |
| 49 Talbott St Brooklyn, MD | 2.0 | 1.0 | 1300 | $1,300 | $1.00 | 24d | 1 | 0.70mi |
| 1 Ballman Ct Unit 2 Baltimore, MD | 2.0 | 1.0 | 700 | $1,250 | $1.79 | 43d | 1 | 0.72mi |
| 1411 Filbert St Unit 2 Baltimore, MD | 2.0 | 1.0 | 1428 | $1,300 | $0.91 | 43d | 1 | 0.77mi |
| 217 W Edgevale Rd Brooklyn, MD | 3.0 | 1.5 | 992 | $1,800 | $1.81 | 24d | 1 | 0.87mi |
| 303 Arden Rd W Brooklyn, MD | 3.0 | 2.0 | 1388 | $2,500 | $1.80 | 17d | 1 | 0.92mi |
| 511 Seagull Ave Brooklyn, MD | 2.0 | 1.0 | 756 | $1,550 | $2.05 | 24d | 1 | 1.37mi |
| 130 Reedbird Ave Brooklyn, MD | 2.0 | 1.0 | 1152 | $1,700 | $1.48 | 24d | 1 | 1.38mi |
| 90 Hammonds Ln Brooklyn Park, MD | 1.0–2.0 | 1.0–2.0 | 757 | $1,964 | $2.59 | 1d | 4 | 1.43mi |
Listing history 5 events
-
2026-06-03statusdays on market $30,000 Pending 57 DOM
-
2026-06-02days on market $30,000 Active 56 DOM
-
2026-06-01days on market $30,000 Active 55 DOM
-
2026-05-31days on market $30,000 Active 54 DOM
-
2026-04-07$30,000 Active 518-char remark
Show marketing remark (518 chars)
ONLINE REAL ESTATE AUCTION!! Bidding Opens - Tuesday, May 5, 2026. Bidding Closes - Thursday, May 7, 2026 at 12:00 PM. List price is opening bid only. Two story townhome in the Brooklyn area of Baltimore City. Brooklyn has been changing rapidly with an increase in development over the last few years. Close to The Baltimore Peninsula and Anne Arundel County, the area is convenient to many employment centers and major highways. The house is ideal for investors who want to renovate and resell or use it as a rental.
ⓘ Source: listings_history table (triggers on properties + properties_extension) + one-shot
backfill from property_details.listing_events for pre-trigger history.
Climate risk First Street
- Flood 1/10 Low FEMA zone X (unshaded) · 0% chance over 30 yrs
- Wildfire 1/10 Low
- Heat 8/10 Severe 7 d/yr ≥103°F today · 15 d/yr by 30 yrs out
- Wind 6/10 Major 27% chance of damaging wind over 30 yrs
- Air quality 4/10 Moderate 5 unhealthy d/yr today · 7 by 30 yrs out
Nearby sold comps map
Loading sold comps map…
Walkable amenities ~0.75 mi
Loading nearby amenities…
Taxation est. · year 1
- Rental income
- $22,080
- − Mortgage interest
- −$8,429
- − Property taxes
- −$2,257
- − Insurance
- −$752
- − Repairs & maintenance
- −$1,766
- − Management
- −$1,766
- − Depreciation
- −$4,377
- Taxable income
- $2,732
- Est. tax owed @ 24.0%
- −$656
- After-tax cash flow
- $4,309/yr
For passive investors: Depreciation is non-cash, so a rental often shows a tax loss while cash-flowing — sheltering income. Rental losses are passive: they offset passive income freely, and up to $25,000/yr can offset ordinary (W-2) income if you actively participate and your MAGI is under $100k (phasing out to $0 by $150k); unused losses carry forward. On sale, claimed depreciation is recaptured at up to 25%, and gains may owe capital-gains tax (a 1031 exchange can defer both). Figures are a year-1 estimate at your 24.0% rate — not tax advice; consult a CPA.
Schools (NCES district)
- District
- Baltimore City Public Schools
- NCES district ID
- 2400090
- Math proficiency
- 7% ▼ -9.00%
- Reading proficiency
- 16% ▼ -5.00%
- Median HH income
- $42,108
- Composite
- 10.08/100
- National rank
- #9805
- State rank
- #24 of 24 in MD
Livability — Baltimore
- Score
- 76/100
- State rank
- #90
- US rank
- #3396
Category grades
Schools grade is shown separately in the Schools card above.
Census & demographics
- Census place
- Baltimore, MD
- County
- Anne Arundel County · 535,653 people
- City population
- 588,727
- Metro
- Baltimore-Columbia-Towson, MD
- Population (ZIP)
- 34,062
- Household income
- $54,020
- Rent vs Own
- Severe rent burden
- 1440.0
Population outlook (Baltimore County) Hauer SSP2
- Today (2025)
- 624,249 people
- By 2030
- 621,541 · -0.4%
- By 2040
- 609,756 · -2.3%
- By 2050
- 597,249 · -4.3%
- By 2075
- 552,236 · -11.5%
- By 2100
- 513,934 · -17.7%
Race, ethnicity, and origin ACS 2023
- Neighborhood character
- Diverse neighborhood (Simpson 0.68)
- Race & ethnicity
- Black 42% White 32% Hispanic / Latino 20% Two or more races 8% Native American 3% Asian 2%
- Hispanic origin (detail)
- Mexican 5% Puerto Rican 1%
- Common ancestry
- Romanian 2% Lithuanian 1% Iranian 1%
- Foreign-born
- 12% · Canada, China
- Languages at home
- 81% English-only · Spanish 16% Other Indo-European 1% French/Haitian/Cajun 1%
Political lean MEDSL · Baltimore
- 2024 margin
- Solid D (+73.0) · D 85.2% · R 12.2% · Other 2.6%
- 2008→2024 swing
- -2.5pp toward R · 2008: 75.5pp · 2024: 73.0pp
- All cycles
- 2024: D+73.0 2020: D+76.6 2016: D+74.6 2012: D+76.4 2008: D+75.5
Not yet ingested
- Civics
- —
Market trends
- HPI YoY
- ▼ -119.44%
- Current HPI
- 254.5089
- Rent YoY
- ▲ 4.08%
- Metro
- Baltimore-Columbia-Towson, MD
- State GDP YoY
- ▲ 2.97%
- F500 in state
- 12
Industry mix (Fortune 500 HQ in MD)
| Industry | F500 HQs | Revenue |
|---|---|---|
| Aerospace / Defense | 1 | $71B |
|
||
| Utilities | 1 | $25B |
|
||
| Hotels | 1 | $24B |
|
||
| Consumer Goods | 1 | $7B |
|
||
| Real Estate | 1 | $6B |
|
||
| Chemicals | 1 | $2B |
|
||
Price history
1 event — show timeline
- 2026-04-07 Listed $30,000 BRIGHT MLS
Property tax history
+1.9%/yrLatest (2025): $2,476 · +81.2% YoY. Source: county tax records.
Cash-flow waterfall
monthlySold comps — $/sqft
last 12 mo · ≤1 miLoading sold comps…