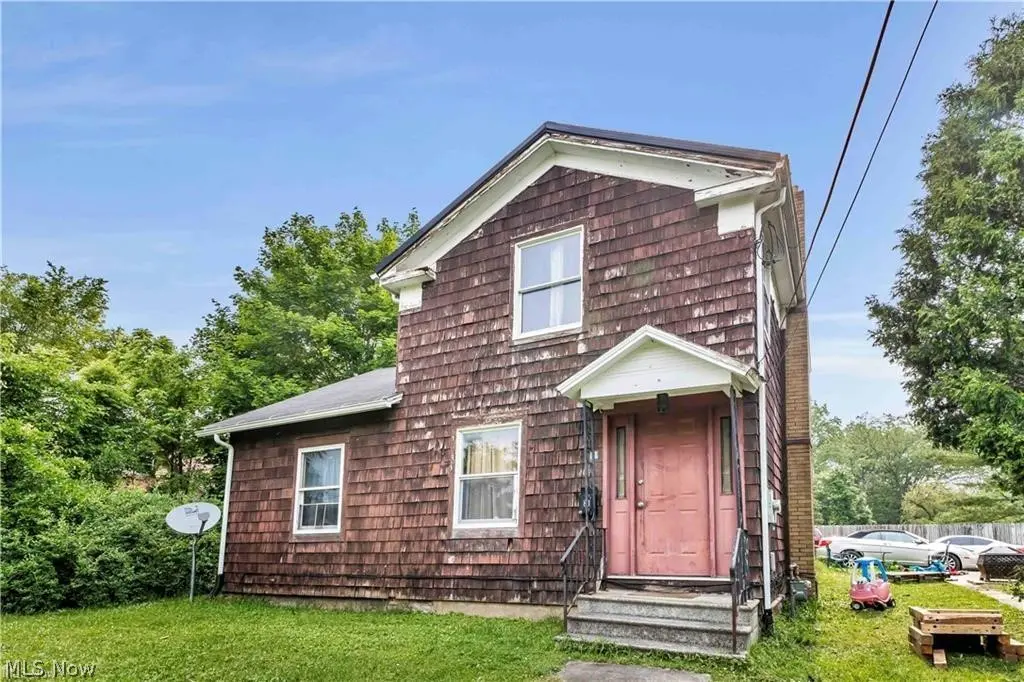
81 S Pleasant St · Oberlin, OH
Flood risk 1/10 · Minimal
- FEMA flood zone
- X (unshaded)
- Chance of flooding over 30 yrs
- 0.0%
- Est. flood insurance / yr
- $473 – $860
Fire risk 1/10 · Minimal
- Est. fire insurance / yr
- $713 – $1,323
Heat risk 3/10 · Minor
- Hot days now (above 99°F)
- 7 days/yr
- Hot days in 30 yrs
- 16 days/yr
Wind risk 1/10 · Minimal
- Chance of severe wind over 30 yrs
- —
Air-quality risk 2/10 · Minimal
- Unhealthy air days now
- 1 days/yr
- Unhealthy air days in 30 yrs
- 2 days/yr
Risk factors via First Street. Map © Google.
Why this score? — see what drove the B+ grade
The composite is a weighted blend of 9 inputs, each scored 0–100. Each bar is that input's sub-score; the figure is the points it added to the 100-point composite (weight × sub-score).
- Cash flow +29.6/30.0
- ARV discount +15.0/15.0
- DSCR +10.0/10.0
- 1% rule +8.0/10.0
- Schools +4.2/10.0
- Livability +4.2/5.0
- Rent growth +2.5/5.0
- Condition / age +2.5/5.0
- Appreciation +0.0/10.0
$149,000
🖨 Deal sheet (PDF) 📄 Offer letter ✓ Due diligence
Listing remarks
Location, location, location! Nestled in the heart of vibrant Oberlin, this spacious and beautifully updated 4-bedroom, 2-bathroom home offers the perfect blend of comfort, style, and convenience. Recently renovated throughout, the property features a stunning brand-new kitchen complete with elegant granite countertops, modern finishes, and ample space for cooking and entertaining. Fresh paint and new flooring throughout the entire home create a bright, clean, and move-in-ready atmosphere. Ideally located within walking distance to local shops, restaurants, parks, schools, and Oberlin College, this home places you in the center of everything Oberlin has to offer. Whether you’re lookin
Key facts
- Modern finishes
- Brand-new kitchen
- Granite countertops
Tags
Property features AI
Finance
- Financial info: Annual taxes listed (see broker for details)
Exterior
- Utilities: Public water; Public sewer
- Home design: Two-story wood-sided home; Asphalt/fiberglass roof
- Construction: Built per public records; Wood siding; Asphalt and fiberglass roofing
- Exterior features: 0.13-acre lot
Interior
- Bedrooms: 4 main-level bedrooms
- Bathrooms: 1 full bathroom (main level)
- Interior features: Full basement
Neighborhood map
What this means for you Summary
Snapshot
- This is a 4-bed/1.0-bath single-family listed at $149k.
Deal economics
- At list price, monthly cash flow is $537 ($6k/yr) — positive.
- The deal already cash-flows at list — no discount required.
- Meets the 1% rule at list price ($2k rent vs $149k).
- Recommended offer: $147k (1.5% below list) — sets the bar for market timing.
- Cap rate 10.6% vs local median 4.0% in Oberlin — top-decile yield for the area; either an underpriced asset or a hidden risk that comps aren't pricing in. Stress-test before assuming the spread holds.
Location & tenants
- Location reads 83/100 on livability (#62 in OH, #923 nationally) — a professional / high-income tenant draw. Strengths: cost of living A+, housing A+, amenities A; Watch: employment D+, commute F.
- Oberlin City Schools (town): math 41% / reading 56% proficiency, ranked #447 of 656 in OH (top 68%) — families likely to look elsewhere, expect single-tenant / working-renter base with shorter leases.
- Market conditions: 38 active listings in the ZIP; 1,098 units permitted in Lorain County in 2024 (20 in 5+ unit buildings).
- This rent runs 32% of the median local income ($74k/yr) — at the standard rent-burdened threshold; future hikes will face affordability resistance.
Forward outlook
- Local home prices are declining (-3.0%/yr); year-one equity from $1k of loan paydown is wiped out by about $4k of value loss. Plan a longer hold.
- At projected returns (-3.0% appreciation + 3.0% rent growth), your $42k cash investment doubles in ~8 years — after that, you're playing with house money.
Negotiation context
- It's been on market 29 days — a 2% lower offer ($147k) is reasonable based on typical stale-listing flexibility.
- 3 sale attempts; this cycle's ask has dropped $11k (7%) from the opening price — seller is motivated, your offer sets the floor, not the list.
- Current owner paid $53k; list at $149k implies a 181% gain — meaningful room to come down on a strong offer.
Risks & watch-outs
- Watch-outs: built in 1900 — expect roof / HVAC / electrical / plumbing capex.
Questions for the listing agent
- Built in 1900 — when were the roof, HVAC, electrical panel, plumbing, and water heater last replaced?
- Is there a deadline driving the sale (1031 exchange, divorce, estate, relocation)? That informs how much negotiation room exists.
- Schools are A-rated — typically a magnet for longer-tenancy family renters. What's the average tenant stay here, and is there a school-zone premium baked into asking?
- What's the average days-on-market for RENTAL listings here right now (not sales)? A rising rental-DOM trend means longer vacancies and softer asking-rent achievability than the comps imply.
- What's the recent tenant-quality profile in this submarket — average credit score on applications, eviction rate, late-payment / NSF rate, and stable-employment percentage? A property-management company in the area should have these aggregated.
- How much new for-sale + rental construction is in the pipeline within 1–3 miles? Heavy new supply typically softens prices + rents 12–24 months out; constrained supply supports both.
Investment metrics
- 1% rule
- 1.30% ✓
- Cap rate
- 10.62%
- Cash-on-cash
- 15.46%
- DSCR
- 1.69
- GRM
- 6.4
CMA / ARV
- ARV (on-the-fly)
- $208,984
- Comps found
- 11
Show comp detail 11 sales within ~0.75 mi
| Address | Dist | Beds/Ba | Sqft | Sold | Price | $/sf | Match |
|---|---|---|---|---|---|---|---|
| 177 Sumner St | 0.35mi | 3/1.5 (-1) | 1,312 (-5%) | 2mo | $255,000 | $194 | 67 |
| 177 S Pleasant St | 0.18mi | 3/2.0 (-1) | 1,323 (-4%) | 13mo | $127,000 | $96 | 65 |
| 180 N Park St | 0.51mi | 3/1.0 (-1) | 1,329 (-4%) | 3mo | $213,000 | $160 | 62 |
| 32 W Lincoln St | 0.52mi | 3/1.0 (-1) | 1,274 (-8%) | 1mo | $192,000 | $151 | 57 |
| 359 S Pleasant St | 0.52mi | 3/2.0 (-1) | 1,263 (-9%) | 8mo | $237,500 | $188 | 46 |
| 64 Edison St | 0.30mi | 4/2.5 | 1,564 (+13%) | 19mo | $210,000 | $134 | 42 |
| 201 Grafton St | 0.43mi | 4/2.0 | 1,504 (+9%) | 23mo | $225,000 | $150 | 42 |
| 263 E Lorain St | 0.47mi | 4/1.0 | 1,523 (+10%) | 23mo | $60,000 | $39 | 42 |
| 269 N Main St | 0.67mi | 3/1.5 (-1) | 1,436 (+4%) | 19mo | $183,500 | $128 | 39 |
| 395 Washington Cir | 0.71mi | 4/1.5 | 1,236 (-11%) | 14mo | $222,000 | $180 | 35 |
| 45773 E Hamilton St | 0.71mi | 3/1.0 (-1) | 1,286 (-7%) | 23mo | $246,000 | $191 | 31 |
Match score weights: distance 35% · size 25% · config 20% · recency 20%. Top-matched comps best support the ARV.
Projected returns pro-forma
-3.0% appreciation · 3.0% rent growth · sell at horizon
- IRR
- 6.2%
- Equity multiple
- 1.24×
- Total profit
- $10,085
- Equity at exit
- $22,216
- IRR
- 15.6%
- Equity multiple
- 2.27×
- Total profit
- $52,873
- Equity at exit
- $12,883
Cash invested: $41,720 (down + closing). Projections, not guarantees.
Landlord ↔ Tenant lean methodology
- Overall (STATE)
- 73 Landlord-Friendly
- State Ohio
- 73 Landlord-Friendly · R+6
- County
- — inherits STATE
- City
- — inherits STATE
ZIP-level market 44074
- Home prices YoY
- -25.8%
- Active inventory
- 38
- Price-to-rent
- 6.4×
Monthly cashflow live
- Estimated rent
- $1,935 medium interval (Pro) →
- Mortgage (P&I)
- −$781
- Tax from tax record
- −$148 /mo · $1,776/yr
- Insurance
- −$62
- HOA
- −$0
- Vacancy / Maint / Mgmt
- −$406
- Net cashflow
- $537
Break-even live
Sensitivity live
| Price | -10% $622 | -5% $580 | +0% $537 | +5% $495 | +10% $453 |
|---|---|---|---|---|---|
| Rent | -10% $384 | -5% $461 | +0% $537 | +5% $614 | +10% $690 |
| Rate | -1.0pp $612 | -0.5pp $575 | base $537 | +0.5pp $499 | +1.0pp $459 |
UW: 25.0% down · 7.5% · 30yr · 1.5% tax · 5.0% vac · 8.0% maint · 8.0% mgmt
Financing live
Cash to close
- Down payment
- $37,250
- Closing costs
- $4,470
- Reserves months
- —
- Total cash needed
- —
Loan-product check · same deal, 3 products live
Conventional
25% down · 7.5% · 30yr
- Down + closing
- —
- Monthly P&I
- —
- Monthly cashflow
- —
- DSCR
- —
- Eligible?
- —
Personal DTI + credit; lowest rate.
DSCR
20% down · 8.5% · 30yr
- Down + closing
- —
- Monthly P&I
- —
- Monthly cashflow
- —
- DSCR
- —
- Eligible?
- —
No personal income docs; deal must DSCR.
Hard money
10% down · 12.0% · 12mo
- Down + closing
- —
- Monthly P&I
- —
- Monthly cashflow
- —
- DSCR
- —
- Eligible?
- —
Short-term bridge; refi at stabilization.
Listing history 25 events
-
2026-06-18days on market $149,000 Active 29 DOM
-
2026-06-17days on market $149,000 Active 28 DOM
-
2026-06-16days on market $149,000 Active 27 DOM
-
2026-06-15days on market $149,000 Active 26 DOM
-
2026-06-13pricedays on market $149,000 Active 24 DOM
-
2026-06-13days on market $153,000 Active 23 DOM
-
2026-06-09days on market $153,000 Active 20 DOM
-
2026-06-08days on market $153,000 Active 19 DOM
-
2026-06-07pricedays on market $153,000 Active 18 DOM
-
2026-06-05days on market $156,000 Active 15 DOM
-
2026-06-03days on market $156,000 Active 14 DOM
-
2026-06-02pricedays on market $156,000 Active 13 DOM
-
2026-06-01days on market $158,000 Active 12 DOM
-
2026-05-31days on market $158,000 Active 11 DOM
-
2026-05-20$160,000 Active
-
2025-11-13historical
-
2025-10-23$99,000 Active
-
2025-10-03historical
-
2025-09-05price $94,000
-
2025-08-26price $97,900
-
2025-08-13price $99,900
-
2025-06-16$109,000 Active
-
2014-07-28soldstatus $53,100
-
2011-09-16soldstatus $80,000
-
1988-07-15soldstatus $13,000
ⓘ Source: listings_history table (triggers on properties + properties_extension) + one-shot
backfill from property_details.listing_events for pre-trigger history.
Tax reassessment forecast OH · Partial reset (capped growth)
- Current annual tax
- $1,776 · $148/mo
- Projected year-2 tax
- $2,050 · $171/mo
- Expected delta
- +$274/yr (+$23/mo · 15.4%)
ⓘ Screening estimate from a state-policy table — verify with the county assessor before closing.
Climate risk First Street
- Flood 1/10 Low FEMA zone X (unshaded) · 0% chance over 30 yrs
- Wildfire 1/10 Low
- Heat 3/10 Moderate 7 d/yr ≥99°F today · 16 d/yr by 30 yrs out
- Wind 1/10 Low
- Air quality 2/10 Low 1 unhealthy d/yr today · 2 by 30 yrs out
Nearby sold comps map
Loading sold comps map…
Walkable amenities ~0.75 mi
Loading nearby amenities…
Taxation est. · year 1
- Rental income
- $23,222
- − Mortgage interest
- −$8,346
- − Property taxes
- −$1,776
- − Insurance
- −$745
- − Repairs & maintenance
- −$1,858
- − Management
- −$1,858
- − Depreciation
- −$4,335
- Taxable income
- $4,305
- Est. tax owed @ 24.0%
- −$1,033
- After-tax cash flow
- $5,415/yr
For passive investors: Depreciation is non-cash, so a rental often shows a tax loss while cash-flowing — sheltering income. Rental losses are passive: they offset passive income freely, and up to $25,000/yr can offset ordinary (W-2) income if you actively participate and your MAGI is under $100k (phasing out to $0 by $150k); unused losses carry forward. On sale, claimed depreciation is recaptured at up to 25%, and gains may owe capital-gains tax (a 1031 exchange can defer both). Figures are a year-1 estimate at your 24.0% rate — not tax advice; consult a CPA.
Schools (NCES district)
- District
- Oberlin City Schools
- NCES district ID
- 3904459
- Math proficiency
- 41% ▼ -21.00%
- Reading proficiency
- 56% ▼ -7.00%
- Median HH income
- $54,514
- Composite
- 41.92/100
- National rank
- #3362
- State rank
- #447 of 656 in OH
Livability — Oberlin
- Score
- 83/100
- State rank
- #62
- US rank
- #923
Category grades
Schools grade is shown separately in the Schools card above.
Census & demographics
- Census place
- Oberlin, OH
- County
- Lorain · 305,041 people
- City population
- 11,684
- Metro
- Cleveland, OH
- Population (ZIP)
- 11,684
- Household income
- $73,697
- Rent vs Own
- Severe rent burden
- 7.1
Population outlook (Lorain County) Hauer SSP2
- Today (2025)
- 314,924 people
- By 2030
- 317,546 · +0.8%
- By 2040
- 317,962 · +1.0%
- By 2050
- 312,872 · -0.7%
- By 2075
- 301,806 · -4.2%
- By 2100
- 278,271 · -11.6%
Race, ethnicity, and origin ACS 2023
- Neighborhood character
- Predominantly White (75%)
- Race & ethnicity
- White 75% Two or more races 11% Black 9% Hispanic / Latino 6% Asian 3%
- Hispanic origin (detail)
- Mexican 2% Puerto Rican 2%
- Common ancestry
- Romanian 5% Slovak 2% Lithuanian 2%
- Foreign-born
- 4% · Canada, China
- Languages at home
- 92% English-only · Spanish 3% Other Indo-European 1% Chinese 1%
Political lean MEDSL · Lorain
- 2024 margin
- Lean R (+5.7) · D 46.7% · R 52.4%
- 2008→2024 swing
- -23.6pp toward R · 2008: 17.9pp · 2024: -5.7pp
- All cycles
- 2024: R+5.7 2020: R+2.5 2016: R+0.3 2012: D+14.4 2008: D+17.9
Not yet ingested
- Civics
- —
Market trends
- HPI YoY
- ▼ -72.36%
- Current HPI
- 208.1653
- Rent YoY
- —
- Metro
- —
- State GDP YoY
- ▲ 1.98%
- F500 in state
- 48
Industry mix (Fortune 500 HQ in OH)
| Industry | F500 HQs | Revenue |
|---|---|---|
| Insurance | 3 | $145B |
|
||
| Industrial Machinery | 3 | $49B |
|
||
| Financial Services | 3 | $24B |
|
||
| Consumer Goods | 2 | $93B |
|
||
| Aerospace / Defense | 2 | $47B |
|
||
| Utilities | 2 | $33B |
|
||
Price history
+1130.8% since first listed11 events — show timeline
- 2026-05-20 Listed $160,000 MLSNOW
- 2025-11-13 Listing Removed — MLSNOW
- 2025-10-23 Listed $99,000 MLSNOW
- 2025-10-03 Listing Removed — MLSNOW
- 2025-09-05 Price Changed $94,000 MLSNOW
- 2025-08-26 Price Changed $97,900 MLSNOW
- 2025-08-13 Price Changed $99,900 MLSNOW
- 2025-06-16 Listed $109,000 MLSNOW
- 2014-07-28 Sold (Public Records) $53,100 Public Records
- 2011-09-16 Sold (Public Records) $80,000 Public Records
- 1988-07-15 Sold (Public Records) $13,000 Public Records
Property tax history
+4.9%/yrLatest (2025): $1,776 · -1.8% YoY. Source: county tax records.
Cash-flow waterfall
monthlySold comps — $/sqft
last 12 mo · ≤1 miLoading sold comps…