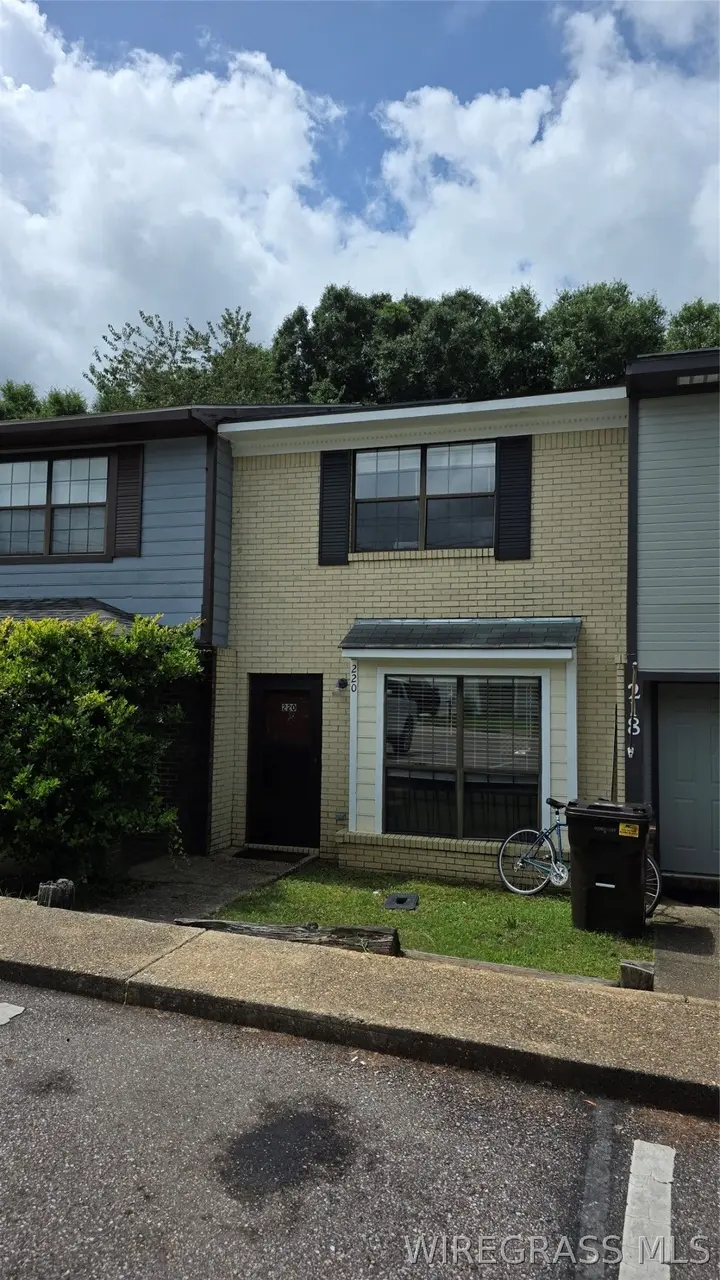
220 Edith Way · Daleville, AL
Flood risk 1/10 · Minimal
- FEMA flood zone
- X (unshaded)
- Chance of flooding over 30 yrs
- 0.0%
- Est. flood insurance / yr
- $507 – $1,088
Fire risk 3/10 · Minor
- Est. fire insurance / yr
- $916 – $1,700
Heat risk 8/10 · Major
- Hot days now (above 106°F)
- 7 days/yr
- Hot days in 30 yrs
- 20 days/yr
Wind risk 8/10 · Major
- Chance of severe wind over 30 yrs
- 99.0%
Air-quality risk 1/10 · Minimal
- Unhealthy air days now
- 0 days/yr
- Unhealthy air days in 30 yrs
- 0 days/yr
Risk factors via First Street. Map © Google.
Why this score? — see what drove the B grade
The composite is a weighted blend of 9 inputs, each scored 0–100. Each bar is that input's sub-score; the figure is the points it added to the 100-point composite (weight × sub-score).
- Cash flow +28.3/30.0
- DSCR +10.0/10.0
- Appreciation +10.0/10.0
- ARV discount +7.3/15.0
- 1% rule +6.9/10.0
- Livability +3.1/5.0
- Rent growth +2.5/5.0
- Condition / age +2.5/5.0
- Schools +2.0/10.0
$94,900
🖨 Deal sheet 📄 Offer letter ✓ Due diligence
Listing remarks MLS
OWNER IS READY TO SELL THIS UNIT!!! CHECK OUT THE LOW PRICE HE HAD PLASED ON IT. IT IS RENTED UNTILL JULY OF 2009 AT 500 A MONTH. ,
Key facts
- Half bath
- Spacious living area
- Balcony
Tags
Property features AI
Exterior
- Parking: Parking pad
- Security: Fire alarm
- Utilities: Public water; Public sewer; Cable available; Electricity available
- Home design: Residential townhouse; Two levels; Level topography; City lot; Paved road access; Subdivision: Hickory Oak
- Construction: Brick and Masonite construction; Slab foundation
- Exterior features: Balcony; Deck; Storage
Interior
- Kitchen: Dishwasher; Electric range; Range hood; Refrigerator
- Flooring: Carpet; Vinyl
- Bathrooms: 1 full bathroom; 1 half bathroom
- Heating & cooling: Central heating; Hot water heating; Electric heating; Heat pump; Central air conditioning; Electric cooling; Heat pump cooling
- Interior features: Wet bar; Window coverings with blinds
- Laundry & utility: Electric water heater
Neighborhood map
What this means for you Summary
Snapshot
- This is a 2-bed/1.0-bath townhouse listed at $95k.
Deal economics
- At list price, monthly cash flow is $304 ($4k/yr) — positive.
- The deal already cash-flows at list — no discount required.
- Meets the 1% rule at list price ($1k rent vs $95k).
- Recommended offer: $93k (1.5% below list) — sets the bar for market timing.
- Cap rate 10.1% vs local median 6.5% in Daleville — top-decile yield for the area; either an underpriced asset or a hidden risk that comps aren't pricing in. Stress-test before assuming the spread holds.
Location & tenants
- Location reads 61/100 on livability (#278 in AL) — a middle-class / working-renter tenant base. Strengths: cost of living A+, housing A-; Watch: health & safety D, amenities F, commute F.
- Daleville City (town): math 9% / reading 37% proficiency, ranked #97 of 129 in AL (top 75%) — low school quality limits family demand, transient renter base, plan for 1-2y turnover; 62% free/reduced lunch — lower-income household profile, screen leases tightly.
- Zoned schools: A M Windham Elementary School (math 17% / reading 37%, grade F, #392 of 627 statewide, top 65%, 499 students, 70% FRL); Daleville Middle School (math 7% / reading 39%, grade F, #176 of 257 statewide, top 70%, 361 students, 72% FRL); Daleville High School (math 2% / reading 22%, grade F, #238 of 305 statewide, top 79%, 294 students, 60% FRL).
- Market conditions: 41 active listings in the ZIP; 1 comparable units currently listed for rent nearby; 38 units permitted in Dale County in 2024 (0 in 5+ unit buildings).
Forward outlook
- In year one you build about $10k of equity ($656 loan paydown + $9k appreciation (10.0% local appreciation)).
- Dale County population projected at -20% by 2050 — secular population decline; favor cash flow + early exit over multi-decade hold.
- At projected returns (10.0% appreciation + 3.0% rent growth), your $27k cash investment doubles in ~2 years — after that, you're playing with house money.
- By year 4, paydown + projected appreciation supports a ~$36k cash-out refi (75% LTV) — recoverable capital for the next deal without selling this one.
Negotiation context
- It's been on market 18 days — a 2% lower offer ($93k) is reasonable based on typical stale-listing flexibility.
- 4 sale attempts since 17y ago with the ask held roughly flat each time — persistent listings suggest the price (not the market) is what's stuck; bring a comps-based counter.
- Current owner paid $46k; list at $95k implies a 109% gain — meaningful room to come down on a strong offer.
Risks & watch-outs
- Climate carrying-cost: severe wind risk, 99% chance of damaging wind over 30y; extreme-heat days projected 7→20/yr by 2055 (HVAC capex compounding) — expect insurance premiums to compound above CPI over the hold.
Questions for the listing agent
- Is there a deadline driving the sale (1031 exchange, divorce, estate, relocation)? That informs how much negotiation room exists.
- Schools are F-rated, which usually means shorter tenancies and higher turnover. Who's the typical renter profile here, and what's been the actual vacancy rate?
- What's the average days-on-market for RENTAL listings here right now (not sales)? A rising rental-DOM trend means longer vacancies and softer asking-rent achievability than the comps imply.
- What's the recent tenant-quality profile in this submarket — average credit score on applications, eviction rate, late-payment / NSF rate, and stable-employment percentage? A property-management company in the area should have these aggregated.
- How much new for-sale + rental construction is in the pipeline within 1–3 miles? Heavy new supply typically softens prices + rents 12–24 months out; constrained supply supports both.
Investment metrics
- 1% rule
- 1.19% ✓
- Cap rate
- 10.14%
- Cash-on-cash
- 13.74%
- DSCR
- 1.61
- GRM
- 7.0
CMA / ARV
- ARV (on-the-fly)
- $94,464
- Comps found
- 3
Show comp detail 3 sales within ~0.75 mi
| Address | Dist | Beds/Ba | Sqft | Sold | Price | $/sf | Match |
|---|---|---|---|---|---|---|---|
| 240 Edith Way | 0.04mi | 2/1.5 | 1,152 (0%) | 11mo | $91,500 | $79 | 87 |
| 214 Edith Way | 0.01mi | 2/1.5 | 1,152 (0%) | 21mo | $100,000 | $87 | 80 |
| 197 Lakeview Dr | 0.70mi | 2/1.5 | 1,200 (+4%) | 3mo | $98,000 | $82 | 56 |
Match score weights: distance 35% · size 25% · config 20% · recency 20%. Top-matched comps best support the ARV.
Projected returns pro-forma
10.0% appreciation · 3.0% rent growth · sell at horizon
- IRR
- 34.4%
- Equity multiple
- 3.67×
- Total profit
- $71,046
- Equity at exit
- $85,493
- IRR
- 29.6%
- Equity multiple
- 8.30×
- Total profit
- $193,931
- Equity at exit
- $184,370
Cash invested: $26,572 (down + closing). Projections, not guarantees.
Landlord ↔ Tenant lean methodology
- Overall (STATE)
- 90 Strongly Landlord-Friendly
- State Alabama
- 90 Strongly Landlord-Friendly · R+15
- County
- — inherits STATE
- City
- — inherits STATE
ZIP-level market 36322
- Home prices YoY
- 31.4%
- Active inventory
- 41
- Price-to-rent
- 7.0×
Monthly cashflow live
- Estimated rent
- $1,133 medium interval (Pro) →
- Mortgage (P&I)
- −$498
- Tax from tax record
- −$53 /mo · $641/yr
- Insurance
- −$40
- HOA
- −$0
- Vacancy / Maint / Mgmt
- −$238
- Net cashflow
- $304
Break-even live
UW: 25.0% down · 7.5% · 30yr · 1.5% tax · 5.0% vac · 8.0% maint · 8.0% mgmt
Financing live
Cash to close
- Down payment
- $23,725
- Closing costs
- $2,847
- Reserves months
- —
- Total cash needed
- —
Loan-product check · same deal, 3 products live
Conventional
25% down · 7.5% · 30yr
- Down + closing
- —
- Monthly P&I
- —
- Monthly cashflow
- —
- DSCR
- —
- Eligible?
- —
Personal DTI + credit; lowest rate.
DSCR
20% down · 8.5% · 30yr
- Down + closing
- —
- Monthly P&I
- —
- Monthly cashflow
- —
- DSCR
- —
- Eligible?
- —
No personal income docs; deal must DSCR.
Hard money
10% down · 12.0% · 12mo
- Down + closing
- —
- Monthly P&I
- —
- Monthly cashflow
- —
- DSCR
- —
- Eligible?
- —
Short-term bridge; refi at stabilization.
Rent comps 1 comps
| Address | Beds | Baths | Sqft | Rent | $/sqft | DOM | Units | Dist |
|---|---|---|---|---|---|---|---|---|
| 222 Myrtle St Daleville, AL | 3.0 | 2.0 | 1150 | $1,100 | $0.96 | 43d | 1 | 0.72mi |
Listing history 14 events
-
2026-06-19days on market $94,900 Active 18 DOM
-
2026-06-18days on market $94,900 Active 17 DOM
-
2026-06-17days on market $94,900 Active 16 DOM
-
2026-06-16days on market $94,900 Active 15 DOM
-
2026-06-15days on market $94,900 Active 14 DOM
-
2026-06-14days on market $94,900 Active 12 DOM
-
2026-06-12days on market $94,900 Active 11 DOM
-
2026-06-09days on market $94,900 Active 8 DOM
-
2026-06-08days on market $94,900 Active 7 DOM
-
2026-06-07days on market $94,900 Active 6 DOM
-
2026-06-05days on market $94,900 Active 3 DOM
-
2026-06-03days on market $94,900 Active 2 DOM
-
2026-06-02remarks 699-char remark
-
2026-06-02$94,900 Active 1 DOM
ⓘ Source: listings_history table (triggers on properties + properties_extension) + one-shot
backfill from property_details.listing_events for pre-trigger history.
Tax reassessment forecast AL · Resets to sale price
- Current annual tax
- $641 · $53/mo
- Projected year-2 tax
- $641 · $53/mo
- Expected delta
- $0/yr ($0/mo · 0.0%)
ⓘ Screening estimate from a state-policy table — verify with the county assessor before closing.
Climate risk First Street
- Flood 1/10 Low FEMA zone X (unshaded) · 0% chance over 30 yrs
- Wildfire 3/10 Moderate
- Heat 8/10 Severe 7 d/yr ≥106°F today · 20 d/yr by 30 yrs out
- Wind 8/10 Severe 99% chance of damaging wind over 30 yrs
- Air quality 1/10 Low 0 unhealthy d/yr today · 0 by 30 yrs out
Nearby sold comps map
Loading sold comps map…
Walkable amenities ~0.75 mi
Loading nearby amenities…
Taxation est. · year 1
- Rental income
- $13,594
- − Mortgage interest
- −$5,316
- − Property taxes
- −$641
- − Insurance
- −$474
- − Repairs & maintenance
- −$1,088
- − Management
- −$1,088
- − Depreciation
- −$2,761
- Taxable income
- $2,227
- Est. tax owed @ 24.0%
- −$535
- After-tax cash flow
- $3,118/yr
For passive investors: Depreciation is non-cash, so a rental often shows a tax loss while cash-flowing — sheltering income. Rental losses are passive: they offset passive income freely, and up to $25,000/yr can offset ordinary (W-2) income if you actively participate and your MAGI is under $100k (phasing out to $0 by $150k); unused losses carry forward. On sale, claimed depreciation is recaptured at up to 25%, and gains may owe capital-gains tax (a 1031 exchange can defer both). Figures are a year-1 estimate at your 24.0% rate — not tax advice; consult a CPA.
Schools (NCES district)
- District
- Daleville City
- NCES district ID
- 0101080
- Math proficiency
- 9% ▼ -18.00%
- Reading proficiency
- 37% ▲ 1.00%
- Median HH income
- $45,865
- Composite
- 19.89/100
- National rank
- #8687
- State rank
- #97 of 129 in AL
Livability — Daleville
- Score
- 61/100
- State rank
- #278
- US rank
- #18463
Category grades
Schools grade is shown separately in the Schools card above.
Census & demographics
- Census place
- Daleville, AL
- County
- Dale County · 7,959 people
- City population
- 7,740
- Metro
- Ozark, AL
- Population (ZIP)
- 7,959
- Household income
- $47,276
- Rent vs Own
- Severe rent burden
- 115.0
Population outlook (Dale County) Hauer SSP2
- Today (2025)
- 46,805 people
- By 2030
- 45,176 · -3.5%
- By 2040
- 41,523 · -11.3%
- By 2050
- 37,575 · -19.7%
- By 2075
- 28,931 · -38.2%
- By 2100
- 22,172 · -52.6%
Race, ethnicity, and origin ACS 2023
- Neighborhood character
- Diverse neighborhood (Simpson 0.59)
- Race & ethnicity
- White 59% Black 23% Two or more races 9% Hispanic / Latino 7% Asian 2% Native American 1%
- Hispanic origin (detail)
- Mexican 4% Puerto Rican 3%
- Common ancestry
- Lithuanian 3% Italian 2% Slovak 1%
- Foreign-born
- 5% · South Korea, China, Canada
- Languages at home
- 92% English-only · Spanish 4% Other Indo-European 1% Korean 1%
Political lean MEDSL · Dale
- 2024 margin
- Solid R (+52.3) · D 23.5% · R 75.8%
- 2008→2024 swing
- -7.7pp toward R · 2008: -44.6pp · 2024: -52.3pp
- All cycles
- 2024: R+52.3 2020: R+46.3 2016: R+50.4 2012: R+42.2 2008: R+44.6
Not yet ingested
- Civics
- —
Market trends
- HPI YoY
- ▲ 49.15%
- Current HPI
- 205.6
- Rent YoY
- —
- Metro
- Ozark, AL
- State GDP YoY
- ▲ 2.94%
- F500 in state
- 4
Industry mix (Fortune 500 HQ in AL)
| Industry | F500 HQs | Revenue |
|---|---|---|
| Financial Services | 1 | $8B |
|
||
| Healthcare | 1 | $5B |
|
||
Price history
+97.7% since first listed6 events — show timeline
- 2026-06-01 Listed $94,900 WBR
- 2013-10-10 Listed $49,500 MAAR
- 2013-10-10 Listed $49,500 WBR
- 2009-03-06 Sold (Public Records) $45,500 Public Records
- 2009-03-06 Sold (MLS) $45,500 MAAR
- 2009-02-18 Listed $48,000 MAAR
Property tax history
+9.7%/yrLatest (2025): $641 · +6.6% YoY. Source: county tax records.
Cash-flow waterfall
monthlySold comps — $/sqft
last 12 mo · ≤1 miLoading sold comps…