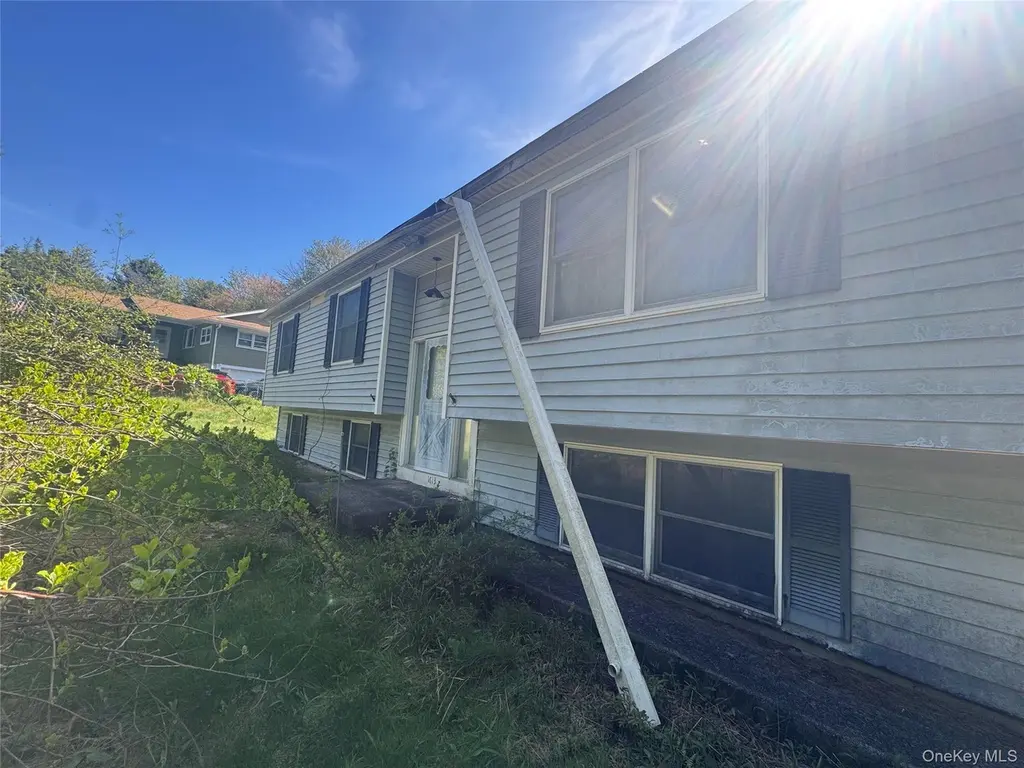
1613 Forestburgh Rd · Eldred, NY
Flood risk 1/10 · Minimal
- FEMA flood zone
- X (unshaded)
- Chance of flooding over 30 yrs
- 0.0%
- Est. flood insurance / yr
- $473 – $860
Fire risk 5/10 · Moderate
- Est. fire insurance / yr
- $691 – $1,283
Heat risk 2/10 · Minimal
- Hot days now (above 93°F)
- 7 days/yr
- Hot days in 30 yrs
- 14 days/yr
Wind risk 3/10 · Minor
- Chance of severe wind over 30 yrs
- 4.0%
Air-quality risk 2/10 · Minimal
- Unhealthy air days now
- 1 days/yr
- Unhealthy air days in 30 yrs
- 1 days/yr
Risk factors via First Street. Map © Google.
Why this score? — see what drove the D+ grade
The composite is a weighted blend of 9 inputs, each scored 0–100. Each bar is that input's sub-score; the figure is the points it added to the 100-point composite (weight × sub-score).
- ARV discount +11.7/15.0
- Appreciation +10.0/10.0
- Cash flow +8.6/30.0
- Schools +3.6/10.0
- 1% rule +3.3/10.0
- Rent growth +2.5/5.0
- Livability +2.5/5.0
- Condition / age +2.5/5.0
- DSCR +2.4/10.0
$249,999
🖨 Deal sheet (PDF) 📄 Offer letter ✓ Due diligence
Listing remarks
Split-Level Ranch with Expansion Potential in Glen Spey, Sullivan County, NY Welcome to 1613 Forestburgh Road — a 3-bedroom, 2-bathroom split-level ranch offering 1,248 square feet of comfortable living space in the scenic Hudson Valley community of Glen Spey, New York. Whether you're a first-time buyer, investor, or looking for a weekend retreat in Sullivan County, this property checks all the boxes. When entering the kitchen you'll immediately appreciate the sliding glass doors that open directly onto a deck — perfect for morning coffee, summer entertaining, or simply enjoying the fresh Catskill mountain air. The spacious backyard offers plenty of room for outdoor activities,
Key facts
- Spacious backyard
- Private driveway
- Sliding glass doors
Tags
Property features AI
Exterior
- Parking: Detached garage; Driveway; Garage (1 car)
- Utilities: Electricity connected (Orange & Rockland); Water connected; Septic tank
- Home design: Single-family residence
- Construction: Vinyl siding construction
- Exterior features: Vinyl siding; Not waterfront
Interior
- Kitchen: Oven; Refrigerator
- Flooring: Carpet; Linoleum
- Bathrooms: 2 full bathrooms
- Heating & cooling: Oil heating; No central cooling
- Interior features: Chandelier; Eat-in kitchen; Original details; Storage; Deck (patio/porch feature); Unfinished attic; Unfinished basement with walk-out access; 7 total rooms
Neighborhood map
What this means for you Summary
Snapshot
- This is a 3-bed/2.0-bath single-family listed at $250k.
Deal economics
- At list price, monthly cash flow is $-216 ($-3k/yr) — negative.
- To cash-flow at today's rent, offer at most $212k (15.3% below list).
- To meet the 1% rule (rent ≥ 1% of price), the offer needs to be $207k (17.2% below list).
- Recommended offer: $207k (17.2% below list) — sets the bar for 1% rule.
- Cap rate 5.3% vs local median 2.3% in Eldred — top-decile yield for the area; either an underpriced asset or a hidden risk that comps aren't pricing in. Stress-test before assuming the spread holds.
Location & tenants
- Location reads: area grade D — affects rentability + tenant quality, not the cash-flow math above.
- Eldred Central School District (rural): math 33% / reading 50% proficiency, ranked #495 of 590 in NY (top 84%) — families likely to look elsewhere, expect single-tenant / working-renter base with shorter leases.
- Zoned schools: George Ross Mackenzie Elementary School (math 22% / reading 47%, grade F, #1,577 of 2,108 statewide, top 77%, 242 students, 38% FRL); Eldred Junior-Senior High School (math 47% / reading 57%, grade D+, #946 of 1,100 statewide, top 88%, 230 students, 46% FRL).
- Market conditions: 66 active listings in the ZIP; 739 units permitted in Sullivan County in 2024 (5 in 5+ unit buildings).
Forward outlook
- In year one you build about $27k of equity ($2k loan paydown + $25k appreciation (10.0% local appreciation)).
- Sullivan County population projected at -24% by 2050 — secular population decline; favor cash flow + early exit over multi-decade hold.
- By year 2, paydown + projected appreciation supports a ~$43k cash-out refi (75% LTV) — recoverable capital for the next deal without selling this one.
Negotiation context
- It's been on market 35 days — a 3% lower offer ($242k) is reasonable based on typical stale-listing flexibility.
Risks & watch-outs
- Climate carrying-cost: moderate wildfire risk — expect insurance premiums to compound above CPI over the hold.
Questions for the listing agent
- What do current leases actually rent for vs. the listed asking? Can we see a recent rent roll and the last 12 months of T-12 income?
- It's been on market 35 days. Have you received any prior offers? Is the seller open to a 17% concession, seller financing, or rate buy-down credit?
- Is there a deadline driving the sale (1031 exchange, divorce, estate, relocation)? That informs how much negotiation room exists.
- The area grade is low — what's the realistic commute time and amenity access for the typical tenant pool here? Any planned neighborhood developments (good or bad) we should know about?
- What's the average days-on-market for RENTAL listings here right now (not sales)? A rising rental-DOM trend means longer vacancies and softer asking-rent achievability than the comps imply.
- What's the recent tenant-quality profile in this submarket — average credit score on applications, eviction rate, late-payment / NSF rate, and stable-employment percentage? A property-management company in the area should have these aggregated.
- How much new for-sale + rental construction is in the pipeline within 1–3 miles? Heavy new supply typically softens prices + rents 12–24 months out; constrained supply supports both.
Investment metrics
- 1% rule
- 0.83% ✗
- Cap rate
- 5.26%
- Cash-on-cash
- -3.70%
- DSCR
- 0.84
- GRM
- 10.1
CMA / ARV
- ARV (on-the-fly)
- $275,808
- Comps found
- 2
Show comp detail 2 sales within ~0.75 mi
| Address | Dist | Beds/Ba | Sqft | Sold | Price | $/sf | Match |
|---|---|---|---|---|---|---|---|
| 62 Stefanyk Rd | 0.50mi | 3/2.0 | 1,200 (-4%) | 7mo | $265,000 | $221 | 65 |
| 7 Hoyt Rd | 0.57mi | 2/2.0 (-1) | 1,340 (+7%) | 5mo | $210,000 | $157 | 52 |
Match score weights: distance 35% · size 25% · config 20% · recency 20%. Top-matched comps best support the ARV.
Projected returns pro-forma
10.0% appreciation · 3.0% rent growth · sell at horizon
- IRR
- 21.7%
- Equity multiple
- 2.75×
- Total profit
- $122,509
- Equity at exit
- $225,219
- IRR
- 19.5%
- Equity multiple
- 6.31×
- Total profit
- $371,797
- Equity at exit
- $485,693
Cash invested: $70,000 (down + closing). Projections, not guarantees.
Landlord ↔ Tenant lean methodology
- Overall (STATE)
- 15 Strongly Tenant-Friendly
- State New York
- 15 Strongly Tenant-Friendly · D+10
- County
- — inherits STATE
- City
- — inherits STATE
ZIP-level market 12737
- Active inventory
- 66
- Price-to-rent
- 10.1×
Monthly cashflow live
- Estimated rent
- $2,070 medium interval (Pro) →
- Mortgage (P&I)
- −$1,311
- Tax from tax record
- −$436 /mo · $5,229/yr
- Insurance
- −$104
- HOA
- −$0
- Vacancy / Maint / Mgmt
- −$435
- Net cashflow
- $-216
Break-even live
Sensitivity live
| Price | -10% $-74 | -5% $-145 | +0% $-216 | +5% $-287 | +10% $-357 |
|---|---|---|---|---|---|
| Rent | -10% $-379 | -5% $-298 | +0% $-216 | +5% $-134 | +10% $-52 |
| Rate | -1.0pp $-90 | -0.5pp $-152 | base $-216 | +0.5pp $-281 | +1.0pp $-347 |
UW: 25.0% down · 7.5% · 30yr · 1.5% tax · 5.0% vac · 8.0% maint · 8.0% mgmt
Financing live
Cash to close
- Down payment
- $62,500
- Closing costs
- $7,500
- Reserves months
- —
- Total cash needed
- —
Loan-product check · same deal, 3 products live
Conventional
25% down · 7.5% · 30yr
- Down + closing
- —
- Monthly P&I
- —
- Monthly cashflow
- —
- DSCR
- —
- Eligible?
- —
Personal DTI + credit; lowest rate.
DSCR
20% down · 8.5% · 30yr
- Down + closing
- —
- Monthly P&I
- —
- Monthly cashflow
- —
- DSCR
- —
- Eligible?
- —
No personal income docs; deal must DSCR.
Hard money
10% down · 12.0% · 12mo
- Down + closing
- —
- Monthly P&I
- —
- Monthly cashflow
- —
- DSCR
- —
- Eligible?
- —
Short-term bridge; refi at stabilization.
Listing history 18 events
-
2026-06-22days on market $249,999 Active 35 DOM
-
2026-06-21days on market $249,999 Active 34 DOM
-
2026-06-21days on market $249,999 Active 33 DOM
-
2026-06-18days on market $249,999 Active 31 DOM
-
2026-06-17days on market $249,999 Active 30 DOM
-
2026-06-16days on market $249,999 Active 29 DOM
-
2026-06-15days on market $249,999 Active 28 DOM
-
2026-06-13days on market $249,999 Active 26 DOM
-
2026-06-12days on market $249,999 Active 25 DOM
-
2026-06-09days on market $249,999 Active 22 DOM
-
2026-06-08days on market $249,999 Active 21 DOM
-
2026-06-07days on market $249,999 Active 20 DOM
-
2026-06-07days on market $249,999 Active 19 DOM
-
2026-06-04days on market $249,999 Active 16 DOM
-
2026-06-02days on market $249,999 Active 15 DOM
-
2026-06-01days on market $249,999 Active 14 DOM
-
2026-05-31days on market $249,999 Active 13 DOM
-
2026-05-13$249,999 Active
ⓘ Source: listings_history table (triggers on properties + properties_extension) + one-shot
backfill from property_details.listing_events for pre-trigger history.
Tax reassessment forecast NY · Partial reset (capped growth)
- Current annual tax
- $5,229 · $436/mo
- Projected year-2 tax
- $5,229 · $436/mo
- Expected delta
- $0/yr ($0/mo · 0.0%)
ⓘ Screening estimate from a state-policy table — verify with the county assessor before closing.
Climate risk First Street
- Flood 1/10 Low FEMA zone X (unshaded) · 0% chance over 30 yrs
- Wildfire 5/10 Major
- Heat 2/10 Low 7 d/yr ≥93°F today · 14 d/yr by 30 yrs out
- Wind 3/10 Moderate 4% chance of damaging wind over 30 yrs
- Air quality 2/10 Low 1 unhealthy d/yr today · 1 by 30 yrs out
Nearby sold comps map
Loading sold comps map…
Walkable amenities ~0.75 mi
Loading nearby amenities…
Taxation est. · year 1
- Rental income
- $24,836
- − Mortgage interest
- −$14,004
- − Property taxes
- −$5,229
- − Insurance
- −$1,250
- − Repairs & maintenance
- −$1,987
- − Management
- −$1,987
- − Depreciation
- −$7,273
- Taxable loss
- −$6,894
- Est. tax savings @ 24.0%
- +$1,655
- After-tax cash flow
- $-937/yr
For passive investors: Depreciation is non-cash, so a rental often shows a tax loss while cash-flowing — sheltering income. Rental losses are passive: they offset passive income freely, and up to $25,000/yr can offset ordinary (W-2) income if you actively participate and your MAGI is under $100k (phasing out to $0 by $150k); unused losses carry forward. On sale, claimed depreciation is recaptured at up to 25%, and gains may owe capital-gains tax (a 1031 exchange can defer both). Figures are a year-1 estimate at your 24.0% rate — not tax advice; consult a CPA.
Schools (NCES district)
- District
- Eldred Central School District
- NCES district ID
- 3610410
- Math proficiency
- 33% ▼ -15.00%
- Reading proficiency
- 50% ▲ 11.00%
- Median HH income
- $52,775
- Composite
- 35.94/100
- National rank
- #4800
- State rank
- #495 of 590 in NY
Livability — Eldred
No livability data for this city. (Only ~50 U.S. cities are tracked.)
Census & demographics
- Population (ZIP)
- 1,817
Population outlook (Sullivan County) Hauer SSP2
- Today (2025)
- 68,974 people
- By 2030
- 65,609 · -4.9%
- By 2040
- 58,878 · -14.6%
- By 2050
- 52,500 · -23.9%
- By 2075
- 39,941 · -42.1%
- By 2100
- 28,880 · -58.1%
Race, ethnicity, and origin ACS 2023
- Neighborhood character
- Predominantly White (82%)
- Race & ethnicity
- White 82% Hispanic / Latino 13% Two or more races 12%
- Hispanic origin (detail)
- Puerto Rican 9% Cuban 1%
- Common ancestry
- Romanian 7% Slovak 5% Lithuanian 4%
- Foreign-born
- 5% · South Korea
- Languages at home
- 92% English-only · Russian/Polish/Slavic 3% Other Indo-European 3% Spanish 2%
Political lean MEDSL · Sullivan
- 2024 margin
- R (+16.7) · D 41.6% · R 58.4%
- 2008→2024 swing
- -26.2pp toward R · 2008: 9.5pp · 2024: -16.7pp
- All cycles
- 2024: R+16.7 2020: R+9.2 2016: R+13.7 2012: D+10.4 2008: D+9.5
Not yet ingested
- Civics
- —
Market trends
- HPI YoY
- ▲ 132.02%
- Current HPI
- 443.8248
- Rent YoY
- —
- Metro
- —
- State GDP YoY
- ▲ 2.60%
- F500 in state
- 92
Industry mix (Fortune 500 HQ in NY)
| Industry | F500 HQs | Revenue |
|---|---|---|
| Financial Services | 10 | $950B |
|
||
| Consumer Goods | 9 | $162B |
|
||
| Insurance | 4 | $225B |
|
||
| Telecommunications | 2 | $144B |
|
||
| Pharmaceuticals | 2 | $112B |
|
||
| Media / Entertainment | 2 | $69B |
|
||
Price history
1 event — show timeline
- 2026-05-13 Listed $249,999 OneKey® MLS as Distributed by MLS Grid
Property tax history
+10.9%/yrLatest (2025): $5,229 · +1.6% YoY. Source: county tax records.
Cash-flow waterfall
monthlySold comps — $/sqft
last 12 mo · ≤1 miLoading sold comps…