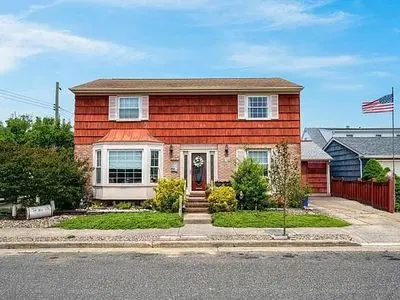
8407 Fremont Ave · Margate City, NJ
Flood risk 8/10 · Major
- FEMA flood zone
- AE
- Chance of flooding over 30 yrs
- 0.99%
- Est. flood insurance / yr
- $1,737 – $8,500
Fire risk 2/10 · Minimal
- Est. fire insurance / yr
- $526 – $976
Heat risk 8/10 · Major
- Hot days now (above 95°F)
- 7 days/yr
- Hot days in 30 yrs
- 16 days/yr
Wind risk 8/10 · Major
- Chance of severe wind over 30 yrs
- 80.0%
Air-quality risk 2/10 · Minimal
- Unhealthy air days now
- 1 days/yr
- Unhealthy air days in 30 yrs
- 2 days/yr
Risk factors via First Street. Map © Google.
Why this score? — see what drove the B grade
The composite is a weighted blend of 9 inputs, each scored 0–100. Each bar is that input's sub-score; the figure is the points it added to the 100-point composite (weight × sub-score).
- Cash flow +27.0/30.0
- ARV discount +15.0/15.0
- DSCR +9.4/10.0
- 1% rule +6.4/10.0
- Schools +4.8/10.0
- Rent growth +4.7/5.0
- Livability +3.8/5.0
- Condition / age +2.5/5.0
- Appreciation +0.0/10.0
$979,000
🖨 Deal sheet (PDF) 📄 Offer letter ✓ Due diligence
Listing remarks
!!!!PRIME MARGATE LOCATION!!! Renovate or Build New. Close To: Playground, Ball Field, Places of Worship, Beach, and Local Businesses. Great Neighborhood for Year-Round Living or Convenient Location for your Dream Vacation Home.
Key facts
- Built 1962
Neighborhood map
What this means for you Summary
Snapshot
- This is a 3-bed/3.0-bath single-family listed at $979k.
Deal economics
- At list price, monthly cash flow is $2k ($28k/yr) — positive.
- The deal already cash-flows at list — no discount required.
- Meets the 1% rule at list price ($11k rent vs $979k).
- Cap rate 9.7% vs local median 7.4% in Margate City — top-decile yield for the area; either an underpriced asset or a hidden risk that comps aren't pricing in. Stress-test before assuming the spread holds.
Location & tenants
- Location reads 75/100 on livability (#149 in NJ, #3,893 nationally) — a middle-class / working-renter tenant base. Strengths: crime A+, employment A+, health & safety A+; Watch: amenities F, commute F, cost of living F.
- Margate City School District (suburban): math 50% / reading 58% proficiency, ranked #113 of 472 in NJ (top 24%) — acceptable for families but not a draw, mixed tenant base, ~2y average lease; only 8% free/reduced lunch — higher-income household profile.
- Zoned schools: William H. Ross Iii School (math 37% / reading 62%, grade D, #256 of 1,303 statewide, top 22%, 184 students, 4% FRL); Eugene A. Tighe Middle School (math 57% / reading 57%, grade B, #51 of 431 statewide, top 12%, 152 students, 6% FRL) — zoned schools at 5% FRL track the district average.
- Market conditions: Rents rising fast (+8.9%/yr); 147 active listings in the ZIP; 18 comparable units currently listed for rent nearby; rentals lingering (median 46d on market — plan ~5-8 weeks vacancy on turnover, expect pricing pressure); 56% of comp listings sitting > 30 days — soft ceiling on asking rent; high-income renter base; 672 units permitted in Atlantic County in 2024 (258 in 5+ unit buildings).
- At $11,203/mo this rent would consume 110% of the median local household income ($122k/yr) (locally 23% of renters already pay >50% of income on rent) — very limited rent-growth headroom before tenants either downsize or default.
Forward outlook
- Local home prices are declining (-3.0%/yr); year-one equity from $7k of loan paydown is wiped out by about $29k of value loss. Plan a longer hold.
- Atlantic County population projected at -12% by 2050 — secular population decline; favor cash flow + early exit over multi-decade hold.
- At projected returns (-3.0% appreciation + 8.0% rent growth), your $274k cash investment doubles in ~8 years — after that, you're playing with house money.
Negotiation context
- Only 0 days on market — expect competitive offers; lowballing is unlikely to land.
- 7 sale attempts since 3y ago with the ask held roughly flat each time — persistent listings suggest the price (not the market) is what's stuck; bring a comps-based counter.
Risks & watch-outs
- Watch-outs: flood insurance adds $427/mo.
- Climate carrying-cost: in FEMA flood zone AE (mandatory federal flood insurance); severe wind risk, 80% chance of damaging wind over 30y; extreme-heat days projected 7→16/yr by 2055 (HVAC capex compounding) — expect insurance premiums to compound above CPI over the hold.
Questions for the listing agent
- Built in 1962 — when were the roof, HVAC, electrical panel, plumbing, and water heater last replaced?
- What's the actual annual flood-insurance premium (NFIP or private), and is the property in a SFHA with mandatory coverage?
- Is there a deadline driving the sale (1031 exchange, divorce, estate, relocation)? That informs how much negotiation room exists.
- Schools are A-rated — typically a magnet for longer-tenancy family renters. What's the average tenant stay here, and is there a school-zone premium baked into asking?
- What's the average days-on-market for RENTAL listings here right now (not sales)? A rising rental-DOM trend means longer vacancies and softer asking-rent achievability than the comps imply.
- What's the recent tenant-quality profile in this submarket — average credit score on applications, eviction rate, late-payment / NSF rate, and stable-employment percentage? A property-management company in the area should have these aggregated.
- How much new for-sale + rental construction is in the pipeline within 1–3 miles? Heavy new supply typically softens prices + rents 12–24 months out; constrained supply supports both.
Investment metrics
- 1% rule
- 1.14% ✓
- Cap rate
- 9.67%
- Cash-on-cash
- 12.05%
- DSCR
- 1.54
- GRM
- 7.3
CMA / ARV
- ARV (on-the-fly)
- $1,439,482
- Comps found
- 12
Show comp detail 12 sales within ~0.75 mi
| Address | Dist | Beds/Ba | Sqft | Sold | Price | $/sf | Match |
|---|---|---|---|---|---|---|---|
| 7 S Hanover Ave | 0.49mi | 4/3.0 (+1) | 2,240 (+1%) | 3mo | $1,695,000 | $757 | 68 |
| 25 N Huntington Ave | 0.36mi | 4/3.0 (+1) | 2,259 (+2%) | 10mo | $1,465,000 | $649 | 67 |
| 119 N Clermont Ave | 0.56mi | 3/2.5 | 2,125 (-4%) | 1mo | $1,150,000 | $541 | 64 |
| 8702 Winchester Ave Ave | 0.36mi | 3/2.5 | 2,048 (-8%) | 8mo | $1,700,000 | $830 | 62 |
| 302 N Mansfield Ave | 0.13mi | 4/3.5 (+1) | 2,500 (+13%) | 5mo | $2,100,000 | $840 | 61 |
| 6 Bayside Ct | 0.34mi | 3/2.5 | 2,448 (+10%) | 7mo | $933,000 | $381 | 59 |
| 212 N Union Ave | 0.45mi | 4/3.5 (+1) | 2,390 (+8%) | 1mo | $2,225,000 | $931 | 59 |
| 8508 Wellington Ave | 0.11mi | 4/3.0 (+1) | 2,547 (+15%) | 8mo | $1,325,000 | $520 | 58 |
| 614 N Delavan Ave | 0.57mi | 3/2.5 | 2,084 (-6%) | 6mo | $810,000 | $389 | 56 |
| 414 N Clermont Ave | 0.51mi | 4/3.0 (+1) | 2,076 (-6%) | 9mo | $760,000 | $366 | 53 |
| 1 S Douglas Ave | 0.65mi | 4/3.5 (+1) | 2,357 (+6%) | 3mo | $1,425,000 | $605 | 50 |
| 109 N Douglas Ave | 0.52mi | 4/3.5 (+1) | 2,000 (-10%) | 10mo | $1,375,000 | $688 | 44 |
Match score weights: distance 35% · size 25% · config 20% · recency 20%. Top-matched comps best support the ARV.
Projected returns pro-forma
-3.0% appreciation · 8.0% rent growth · sell at horizon
- IRR
- 4.4%
- Equity multiple
- 1.18×
- Total profit
- $48,773
- Equity at exit
- $145,972
- IRR
- 18.0%
- Equity multiple
- 2.83×
- Total profit
- $502,841
- Equity at exit
- $84,646
Cash invested: $274,120 (down + closing). Projections, not guarantees.
Landlord ↔ Tenant lean methodology
- Overall (STATE)
- 21 Tenant-Leaning
- State New Jersey
- 21 Tenant-Leaning · D+6
- County
- — inherits STATE
- City
- — inherits STATE
ZIP-level market 08402
- Rents YoY
- 8.9%
- Active inventory
- 147
- Price-to-rent
- 7.3×
Monthly cashflow live
- Estimated rent
- $11,203 medium interval (Pro) →
- Mortgage (P&I)
- −$5,134
- Tax from tax record
- −$555 /mo · $6,666/yr
- Insurance
- −$408
- Flood insurance flood zone
- −$427 /mo · $5,118/yr
- HOA
- −$0
- Lot rent
- −$0
- Vacancy / Maint / Mgmt
- −$2,353
- Net cashflow
- $2,327
Break-even live
Sensitivity live
| Price | -10% $2,881 | -5% $2,604 | +0% $2,327 | +5% $2,050 | +10% $1,772 |
|---|---|---|---|---|---|
| Rent | -10% $1,442 | -5% $1,884 | +0% $2,327 | +5% $2,769 | +10% $3,212 |
| Rate | -1.0pp $2,820 | -0.5pp $2,576 | base $2,327 | +0.5pp $2,073 | +1.0pp $1,815 |
UW: 25.0% down · 7.5% · 30yr · 1.5% tax · 5.0% vac · 8.0% maint · 8.0% mgmt
Financing live
Cash to close
- Down payment
- $244,750
- Closing costs
- $29,370
- Reserves months
- —
- Total cash needed
- —
Loan-product check · same deal, 3 products live
Conventional
25% down · 7.5% · 30yr
- Down + closing
- —
- Monthly P&I
- —
- Monthly cashflow
- —
- DSCR
- —
- Eligible?
- —
Personal DTI + credit; lowest rate.
DSCR
20% down · 8.5% · 30yr
- Down + closing
- —
- Monthly P&I
- —
- Monthly cashflow
- —
- DSCR
- —
- Eligible?
- —
No personal income docs; deal must DSCR.
Hard money
10% down · 12.0% · 12mo
- Down + closing
- —
- Monthly P&I
- —
- Monthly cashflow
- —
- DSCR
- —
- Eligible?
- —
Short-term bridge; refi at stabilization.
Rent comps 18 comps
| Address | Beds | Baths | Sqft | Rent | $/sqft | DOM | Units | Dist |
|---|---|---|---|---|---|---|---|---|
| 8606 Monmouth Ave Unit August 9/13 Margate City, NJ | 4.0 | 3.5 | 2430 | $20,000 | $8.23 | 46d | 1 | 0.21mi |
| 8208 Lagoon Dr Margate City, NJ | 4.0 | 2.5 | 2480 | $18,000 | $7.26 | 15d | 1 | 0.44mi |
| 307 N Essex Ave Margate City, NJ | 4.0 | 2.0 | 1561 | $1,800 | $1.15 | 46d | 1 | 0.46mi |
| 200 N Essex Ave Margate City, NJ | 4.0 | 3.0 | 1570 | $15,000 | $9.55 | 46d | 1 | 0.47mi |
| 2 N Frontenac Ave Margate City, NJ | 3.0 | 2.5 | 1850 | $17,000 | $9.19 | 23d | 1 | 0.52mi |
| 9406 Amherst Ave Margate City, NJ | 4.0 | 4.0 | 2554 | $47,000 | $18.40 | 23d | 1 | 0.69mi |
| 119 N Belmont Ave Unit June 2026 Margate City, NJ | 4.0 | 2.5 | 2044 | $10,000 | $4.89 | 15d | 1 | 0.71mi |
| 16 S Decatur Ave Unit 9/15-10/31 Margate City, NJ | 4.0 | 3.0 | 1732 | $7,000 | $4.04 | 46d | 1 | 0.73mi |
| 7701 Atlantic Ave Margate City, NJ | 1.0–3.0 | 2.0–3.0 | 1660 | $75,000 | $45.18 | 46d | 4 | 0.74mi |
| 6 N Melbourne Ave Ventnor City, NJ | 4.0 | 3.5 | 2028 | $3,000 | $1.48 | 46d | 1 | 1.00mi |
| 7103 Ventnor Ave Ventnor City, NJ | 4.0 | 3.0 | 2288 | $5,500 | $2.40 | 15d | 1 | 1.05mi |
| 109 N Wissahickon Ave Unit B Ventnor City, NJ | 4.0 | 3.5 | 2000 | $25,000 | $12.50 | 23d | 1 | 1.18mi |
| 7 S Richards Ave Ventnor City, NJ | 4.0 | 2.0 | 1600 | $25,000 | $15.62 | 15d | 1 | 1.29mi |
| 129 N New Haven Ave #2 Ventnor City, NJ | 3.0 | 2.5 | 2812 | $21,000 | $7.47 | 23d | 1 | 1.33mi |
| 129 N New Haven Ave Fl 2 (MemDay June30) Ventnor City, NJ | 3.0 | 2.5 | 2812 | $12,000 | $4.27 | 46d | 1 | 1.33mi |
| 129 N New Haven Ave Fl 2 (June '26) Ventnor City, NJ | 3.0 | 2.5 | 2812 | $9,000 | $3.20 | 46d | 1 | 1.33mi |
| 129 N New Haven Ave Fl 2 (MemDay July 31) Ventnor City, NJ | 3.0 | 2.5 | 2812 | $35,000 | $12.45 | 46d | 1 | 1.33mi |
| 129 N New Haven Ave Fl 2 (July '26) Ventnor City, NJ | 3.0 | 2.5 | 2812 | $24,000 | $8.53 | 46d | 1 | 1.33mi |
Listing history 20 events
-
2026-05-26$979,000
-
2025-12-13historical
-
2025-09-25price $999,900
-
2025-09-06price $1,049,000
-
2025-07-22price $1,095,000
-
2025-06-14$1,175,000 Active
-
2024-07-01historical $6,600
-
2024-06-28price $6,600
-
2024-06-13price $15,000
-
2024-03-27$17,500
-
2024-02-24historical $17,500
-
2023-12-07historical $17,500
-
2023-12-05$17,500
-
2023-11-09historical $17,500
-
2023-10-31$17,500
-
2023-10-06$17,500
-
2023-10-05historical $1,900
-
2023-09-07price $1,900
-
2023-09-02$7,500
-
2023-07-18historical
ⓘ Source: listings_history table (triggers on properties + properties_extension) + one-shot
backfill from property_details.listing_events for pre-trigger history.
Tax reassessment forecast NJ · Partial reset (capped growth)
- Current annual tax
- $6,666 · $555/mo
- Projected year-2 tax
- $15,521 · $1,293/mo
- Expected delta
- +$8,856/yr (+$738/mo · 132.9%)
ⓘ Screening estimate from a state-policy table — verify with the county assessor before closing.
Climate risk First Street
- Flood 8/10 Severe FEMA zone AE · 99% chance over 30 yrs
- Wildfire 2/10 Low
- Heat 8/10 Severe 7 d/yr ≥95°F today · 16 d/yr by 30 yrs out
- Wind 8/10 Severe 80% chance of damaging wind over 30 yrs
- Air quality 2/10 Low 1 unhealthy d/yr today · 2 by 30 yrs out
Nearby sold comps map
Loading sold comps map…
Walkable amenities ~0.75 mi
Loading nearby amenities…
Taxation est. · year 1
- Rental income
- $134,439
- − Mortgage interest
- −$54,839
- − Property taxes
- −$6,666
- − Insurance
- −$10,014
- − Repairs & maintenance
- −$10,755
- − Management
- −$10,755
- − Depreciation
- −$28,480
- Taxable income
- $12,930
- Est. tax owed @ 24.0%
- −$3,103
- After-tax cash flow
- $24,817/yr
For passive investors: Depreciation is non-cash, so a rental often shows a tax loss while cash-flowing — sheltering income. Rental losses are passive: they offset passive income freely, and up to $25,000/yr can offset ordinary (W-2) income if you actively participate and your MAGI is under $100k (phasing out to $0 by $150k); unused losses carry forward. On sale, claimed depreciation is recaptured at up to 25%, and gains may owe capital-gains tax (a 1031 exchange can defer both). Figures are a year-1 estimate at your 24.0% rate — not tax advice; consult a CPA.
Schools (NCES district)
- District
- Margate City School District
- NCES district ID
- 3409690
- Math proficiency
- 50% ▼ -26.00%
- Reading proficiency
- 58% ▼ -28.00%
- Median HH income
- $67,112
- Composite
- 47.71/100
- National rank
- #2241
- State rank
- #113 of 472 in NJ
Livability — Margate City
- Score
- 75/100
- State rank
- #149
- US rank
- #3893
Category grades
Schools grade is shown separately in the Schools card above.
Census & demographics
- Census place
- Margate City, NJ
- County
- Atlantic County · 143,611 people
- City population
- 5,234
- Metro
- Atlantic City-Hammonton, NJ
- Population (ZIP)
- 5,234
- Household income
- $121,800
- Rent vs Own
- Severe rent burden
- 23.0
Population outlook (Atlantic County) Hauer SSP2
- Today (2025)
- 268,948 people
- By 2030
- 264,497 · -1.7%
- By 2040
- 252,261 · -6.2%
- By 2050
- 237,846 · -11.6%
- By 2075
- 210,650 · -21.7%
- By 2100
- 180,234 · -33.0%
Race, ethnicity, and origin ACS 2023
- Neighborhood character
- Predominantly White (94%)
- Race & ethnicity
- White 94% Two or more races 3% Asian 2% Hispanic / Latino 2%
- Common ancestry
- Scotch-Irish 9% Romanian 6% Lithuanian 2%
- Foreign-born
- 5% · Canada, Jamaica
- Languages at home
- 92% English-only · Other Indo-European 2% Tagalog/Filipino 2% Spanish 1%
Political lean MEDSL · Atlantic
- 2024 margin
- Toss-up / Even · D 47.7% · R 50.7% · Other 1.6%
- 2008→2024 swing
- -18.1pp toward R · 2008: 15.1pp · 2024: -3.0pp
- All cycles
- 2024: R+3.0 2020: D+6.7 2016: D+6.2 2012: D+17.2 2008: D+15.1
Not yet ingested
- Civics
- —
Market trends
- HPI YoY
- ▼ -625.70%
- Current HPI
- 475.1366
- Rent YoY
- ▲ 8.91%
- Metro
- Atlantic City-Hammonton, NJ
- State GDP YoY
- ▲ 2.05%
- F500 in state
- 34
Industry mix (Fortune 500 HQ in NJ)
| Industry | F500 HQs | Revenue |
|---|---|---|
| Consumer Goods | 3 | $31B |
|
||
| Pharmaceuticals | 2 | $153B |
|
||
| Technology | 2 | $21B |
|
||
| Insurance | 2 | $20B |
|
||
| Healthcare | 2 | $19B |
|
||
| Financial Services | 1 | $70B |
|
||
Price history
+12953.3% since first listed20 events — show timeline
- 2026-05-26 Listed $979,000 FSBO.com
- 2025-12-13 Listing Removed — SJSRMLS
- 2025-09-25 Price Changed $999,900 SJSRMLS
- 2025-09-06 Price Changed $1,049,000 SJSRMLS
- 2025-07-22 Price Changed $1,095,000 SJSRMLS
- 2025-06-14 Listed $1,175,000 SJSRMLS
- 2024-07-01 Rental Removed $6,600 SJSRMLS
- 2024-06-28 Price Changed $6,600 SJSRMLS
- 2024-06-13 Price Changed $15,000 SJSRMLS
- 2024-03-27 Listed for Rent $17,500 SJSRMLS
- 2024-02-24 Rental Removed $17,500 SJSRMLS
- 2023-12-07 Rental Removed $17,500 SJSRMLS
- 2023-12-05 Listed for Rent $17,500 SJSRMLS
- 2023-11-09 Rental Removed $17,500 SJSRMLS
- 2023-10-31 Listed for Rent $17,500 SJSRMLS
- 2023-10-06 Listed for Rent $17,500 SJSRMLS
- 2023-10-05 Rental Removed $1,900 SJSRMLS
- 2023-09-07 Price Changed $1,900 SJSRMLS
- 2023-09-02 Listed for Rent $7,500 SJSRMLS
- 2023-07-18 Rental Removed — SJSRMLS
Property tax history
+1.9%/yrLatest (2025): $6,666 · +4.6% YoY. Source: county tax records.
Cash-flow waterfall
monthlySold comps — $/sqft
last 12 mo · ≤1 miLoading sold comps…