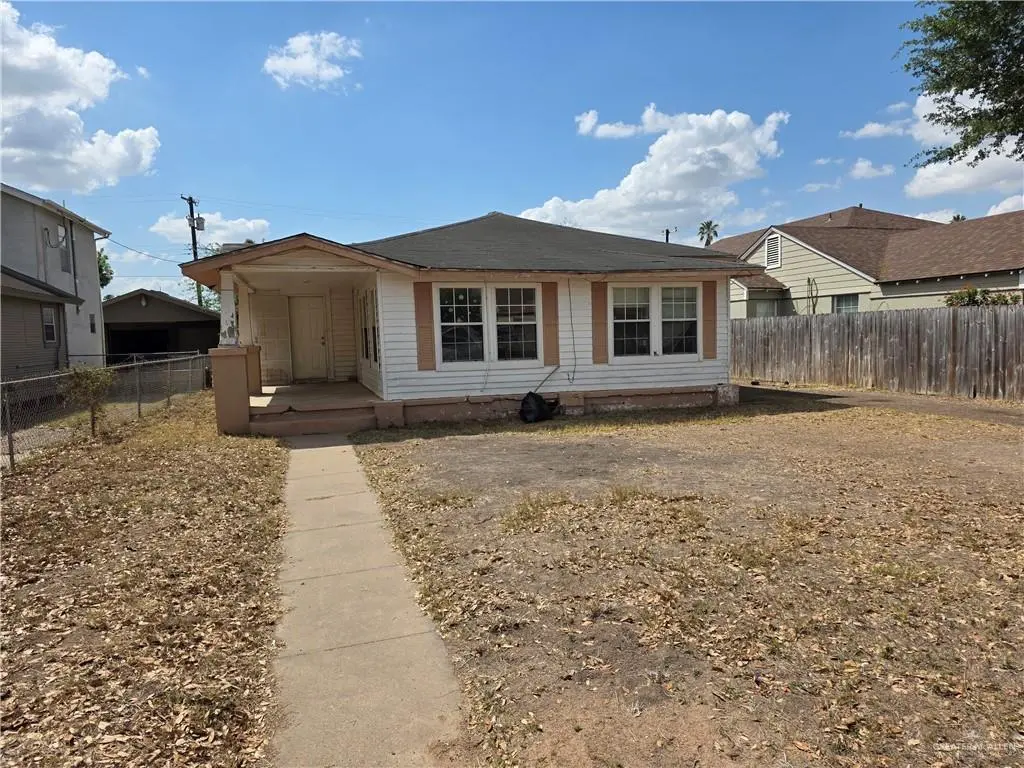
1321 N Saint Marie St · Mission, TX
Flood risk 1/10 · Minimal
- FEMA flood zone
- X
- Chance of flooding over 30 yrs
- 0.0%
- Est. flood insurance / yr
- $507 – $1,088
Fire risk 2/10 · Minimal
- Est. fire insurance / yr
- $1,222 – $2,270
Heat risk 9/10 · Severe
- Hot days now (above 111°F)
- 7 days/yr
- Hot days in 30 yrs
- 20 days/yr
Wind risk 8/10 · Major
- Chance of severe wind over 30 yrs
- 96.0%
Air-quality risk 2/10 · Minimal
- Unhealthy air days now
- 1 days/yr
- Unhealthy air days in 30 yrs
- 2 days/yr
Risk factors via First Street. Map © Google.
Why this score? — see what drove the D- grade
The composite is a weighted blend of 9 inputs, each scored 0–100. Each bar is that input's sub-score; the figure is the points it added to the 100-point composite (weight × sub-score).
- ARV discount +15.0/15.0
- Cash flow +7.5/30.0
- Livability +3.8/5.0
- 1% rule +3.4/10.0
- Rent growth +2.7/5.0
- Condition / age +2.5/5.0
- DSCR +1.7/10.0
- Schools +1.7/10.0
- Appreciation +0.0/10.0
$155,000
🖨 Deal sheet 📄 Offer letter ✓ Due diligence
Listing remarks MLS
INVESTORS!!! Great home in the Heart of Mission, This house features a 3-bedroom one bath home with a large family room to enjoy, and in the back above the carport, you have a one-bedroom one bath apartment with a small kitchen that can be rented out or used as a mother in-law suite. Either way in total you have 2464 sq ft of living. This is a great investment opportunity; both can be rented out individually. Don't miss out and set up your appointment now to see it. Call now to schedule your private showing, Sellers are motivated
Key facts
- Large family room
- Mother in-law suite
- 7,501 sq ft lot
Tags
Neighborhood map
What this means for you Summary
Snapshot
- This is a 2-bed/1.0-bath single-family listed at $155k.
Deal economics
- At list price, monthly cash flow is $-190 ($-2k/yr) — negative.
- To cash-flow at today's rent, offer at most $122k (21.6% below list).
- To meet the 1% rule (rent ≥ 1% of price), the offer needs to be $130k (16.4% below list).
- Recommended offer: $122k (21.6% below list) — sets the bar for cash-flow.
- Cap rate 4.8% vs local median 3.5% in Mission — top-decile yield for the area; either an underpriced asset or a hidden risk that comps aren't pricing in. Stress-test before assuming the spread holds.
Location & tenants
- Location reads 75/100 on livability (#148 in TX, #4,155 nationally) — a middle-class / working-renter tenant base. Strengths: cost of living A+, housing A+, health & safety A+; Watch: schools C-, amenities F, commute F.
- Mission CISD (urban): math 15% / reading 28% proficiency, ranked #775 of 826 in TX (top 94%) — low school quality limits family demand, transient renter base, plan for 1-2y turnover; 78% free/reduced lunch — lower-income household profile, screen leases tightly.
- Market conditions: Rents flat; 852 active listings in the ZIP; 22 comparable units currently listed for rent nearby; rentals lingering (median 44d on market — plan ~5-8 weeks vacancy on turnover, expect pricing pressure); 55% of comp listings sitting > 30 days — soft ceiling on asking rent; 7,378 units permitted in Hidalgo County in 2024 (641 in 5+ unit buildings).
Forward outlook
- Local home prices are declining (-3.0%/yr); year-one equity from $1k of loan paydown is wiped out by about $5k of value loss. Plan a longer hold.
- Hidalgo County population projected at +28% by 2050 — long-run rental-demand tailwind backs the buy-and-hold thesis.
Negotiation context
- It's been on market 82 days — a 6% lower offer ($146k) is reasonable based on typical stale-listing flexibility.
- 4 sale attempts since 7y ago; this cycle's ask has dropped $20k (11%) from the opening price — seller is motivated, your offer sets the floor, not the list.
Risks & watch-outs
- Watch-outs: property tax is 2.6% of price.
- Climate carrying-cost: severe wind risk, 96% chance of damaging wind over 30y; extreme-heat days projected 7→20/yr by 2055 (HVAC capex compounding) — expect insurance premiums to compound above CPI over the hold.
Questions for the listing agent
- What do current leases actually rent for vs. the listed asking? Can we see a recent rent roll and the last 12 months of T-12 income?
- It's been on market 82 days. Have you received any prior offers? Is the seller open to a 22% concession, seller financing, or rate buy-down credit?
- Property tax is high relative to price — has the assessment been appealed recently, and will the sale trigger a re-assessment?
- Why hasn't it sold? Are there any deal-killer items the seller is aware of (foundation, flood, title, zoning, code violations)?
- Is there a deadline driving the sale (1031 exchange, divorce, estate, relocation)? That informs how much negotiation room exists.
- The area grade is low — what's the realistic commute time and amenity access for the typical tenant pool here? Any planned neighborhood developments (good or bad) we should know about?
- What's the average days-on-market for RENTAL listings here right now (not sales)? A rising rental-DOM trend means longer vacancies and softer asking-rent achievability than the comps imply.
- What's the recent tenant-quality profile in this submarket — average credit score on applications, eviction rate, late-payment / NSF rate, and stable-employment percentage? A property-management company in the area should have these aggregated.
- How much new for-sale + rental construction is in the pipeline within 1–3 miles? Heavy new supply typically softens prices + rents 12–24 months out; constrained supply supports both.
Investment metrics
- 1% rule
- 0.84% ✗
- Cap rate
- 4.82%
- Cash-on-cash
- -5.24%
- DSCR
- 0.77
- GRM
- 10.0
CMA / ARV
- ARV (median comp)
- $273,847
- List price
- $155,000
- Delta
- -43.40%
- Verdict
- UNDERPRICED
- Comps
- 20 within 1.0 mi
Show comp detail 9 sales within ~0.75 mi
| Address | Dist | Beds/Ba | Sqft | Sold | Price | $/sf | Match |
|---|---|---|---|---|---|---|---|
| 816 E 12th St | 0.25mi | 3/2.0 (+1) | 1,611 (+1%) | 10mo | $185,000 | $115 | 69 |
| 1022 N Keralum Ave | 0.23mi | 1/2.0 (-1) | 1,635 (+3%) | 14mo | $153,000 | $94 | 64 |
| 1013 Pamela Dr | 0.51mi | 3/1.0 (+1) | 1,600 (+1%) | 14mo | $175,000 | $109 | 59 |
| 1205 Elm St | 0.59mi | 3/2.0 (+1) | 1,522 (-4%) | 1mo | $184,900 | $121 | 56 |
| 916 Country Club Dr | 0.40mi | 3/2.0 (+1) | 1,816 (+14%) | 2mo | $175,000 | $96 | 47 |
| 1110 Oak St | 0.55mi | 3/2.0 (+1) | 1,468 (-8%) | 16mo | $197,000 | $134 | 39 |
| 902 Ramirez St | 0.66mi | 3/2.5 (+1) | 1,788 (+12%) | 2mo | $323,000 | $181 | 36 |
| 1812 Peace Ave | 0.70mi | 3/2.0 (+1) | 1,810 (+14%) | 6mo | $199,000 | $110 | 30 |
| 806 Ramirez St | 0.66mi | 3/2.5 (+1) | 1,750 (+10%) | 16mo | $318,500 | $182 | 28 |
Match score weights: distance 35% · size 25% · config 20% · recency 20%. Top-matched comps best support the ARV.
Projected returns pro-forma
-3.0% appreciation · 0.93% rent growth · sell at horizon
- IRR
- -27.8%
- Equity multiple
- 0.08×
- Total profit
- $-39,731
- Equity at exit
- $23,111
- IRR
- -38.1%
- Equity multiple
- -0.39×
- Total profit
- $-60,120
- Equity at exit
- $13,402
Cash invested: $43,400 (down + closing). Projections, not guarantees.
Landlord ↔ Tenant lean methodology
- Overall (STATE)
- 87 Strongly Landlord-Friendly
- State Texas
- 87 Strongly Landlord-Friendly · R+5
- County
- — inherits STATE
- City
- — inherits STATE
ZIP-level market 78572
- Home prices YoY
- -22.9%
- Rents YoY
- 0.9%
- Active inventory
- 852
- Price-to-rent
- 10.0×
Monthly cashflow live
- Estimated rent
- $1,295 high interval (Pro) →
- Mortgage (P&I)
- −$813
- Tax from tax record
- −$335 /mo · $4,024/yr
- Insurance
- −$65
- HOA
- −$0
- Vacancy / Maint / Mgmt
- −$272
- Net cashflow
- $-190
Break-even live
UW: 25.0% down · 7.5% · 30yr · 1.5% tax · 5.0% vac · 8.0% maint · 8.0% mgmt
Financing live
Cash to close
- Down payment
- $38,750
- Closing costs
- $4,650
- Reserves months
- —
- Total cash needed
- —
Loan-product check · same deal, 3 products live
Conventional
25% down · 7.5% · 30yr
- Down + closing
- —
- Monthly P&I
- —
- Monthly cashflow
- —
- DSCR
- —
- Eligible?
- —
Personal DTI + credit; lowest rate.
DSCR
20% down · 8.5% · 30yr
- Down + closing
- —
- Monthly P&I
- —
- Monthly cashflow
- —
- DSCR
- —
- Eligible?
- —
No personal income docs; deal must DSCR.
Hard money
10% down · 12.0% · 12mo
- Down + closing
- —
- Monthly P&I
- —
- Monthly cashflow
- —
- DSCR
- —
- Eligible?
- —
Short-term bridge; refi at stabilization.
Rent comps 22 comps
| Address | Beds | Baths | Sqft | Rent | $/sqft | DOM | Units | Dist |
|---|---|---|---|---|---|---|---|---|
| 1400 N Dunlap Ave Mission, TX | 2.0 | 1.0 | 1068 | $800 | $0.75 | 19d | 1 | 0.36mi |
| 221 W 14th St Mission, TX | 3.0 | 2.0 | 1290 | $1,100 | $0.85 | 43d | 1 | 0.44mi |
| 1707 Highland Park Ave Unit 4-B Mission, TX | 2.0 | 2.0 | 1336 | $1,200 | $0.90 | 14d | 1 | 0.44mi |
| 1801 Highland Park Ave Mission, TX | 2.0 | 2.0 | 1173 | $1,500 | $1.28 | 19d | 1 | 0.50mi |
| 1006 Fairway Dr Mission, TX | 2.0 | 2.0 | 1072 | $1,100 | $1.03 | 43d | 1 | 0.52mi |
| 1827 Highland Park Ave Unit 1 Mission, TX | 2.0 | 2.0 | 1300 | $1,200 | $0.92 | 43d | 1 | 0.54mi |
| 523 Perkins Ave Mission, TX | 2.0 | 2.0 | 1050 | $950 | $0.90 | 43d | 1 | 0.75mi |
| 2002 Thornton St Mission, TX | 3.0 | 2.0 | 1374 | $1,300 | $0.95 | 43d | 1 | 0.78mi |
| 2216 Robyn Ln Mission, TX | 3.0 | 3.0 | 2033 | $2,000 | $0.98 | 21d | 1 | 0.95mi |
| 1511 Evergreen Ave Mission, TX | 3.0 | 2.0 | 1286 | $1,300 | $1.01 | 43d | 1 | 1.00mi |
| 906 Hidden Hills St Unit 4 Mission, TX | 2.0 | 3.0 | 1180 | $1,250 | $1.06 | 14d | 1 | 1.07mi |
| 721 W 4th St Mission, TX | 3.0 | 1.5 | 1194 | $1,400 | $1.17 | 14d | 1 | 1.07mi |
| 702 W 25th St Mission, TX | 3.0 | 2.0 | 1375 | $1,650 | $1.20 | 19d | 1 | 1.18mi |
| 100 Yosemite Dr Unit 1 Mission, TX | 3.0 | 2.0 | 1195 | $1,375 | $1.15 | 43d | 1 | 1.24mi |
| 103 Yosemite Dr Unit 2 Mission, TX | 3.0 | 2.0 | 1116 | $1,375 | $1.23 | 43d | 1 | 1.27mi |
| 101 San Jose Dr Apt 3 Mission, TX | 3.0 | 2.0 | 1195 | $1,350 | $1.13 | 43d | 1 | 1.28mi |
| 101 San Jose Dr Apt 4 Mission, TX | 3.0 | 2.0 | 1195 | $1,375 | $1.15 | 23d | 1 | 1.28mi |
| 101 San Jose Dr Apt 4 Mission, TX | 3.0 | 2.0 | 1195 | $1,375 | $1.15 | 43d | 1 | 1.28mi |
| 105 San Jose Dr Unit 1 Mission, TX | 3.0 | 2.0 | 1195 | $1,345 | $1.13 | 14d | 1 | 1.28mi |
| 105 San Jose Dr Unit 4 Mission, TX | 3.0 | 2.0 | 1195 | $1,350 | $1.13 | 43d | 1 | 1.28mi |
| 105 San Jose Dr Unit 1 Mission, TX | 3.0 | 2.0 | 1195 | $1,345 | $1.13 | 19d | 1 | 1.28mi |
| 607 Alameda Dr Mission, TX | 3.0 | 2.5 | 1731 | $2,200 | $1.27 | 44d | 1 | 1.29mi |
Listing history 23 events
-
2026-06-18days on market $155,000 Active 82 DOM
-
2026-06-17days on market $155,000 Active 81 DOM
-
2026-06-16days on market $155,000 Active 80 DOM
-
2026-06-15days on market $155,000 Active 79 DOM
-
2026-06-14days on market $155,000 Active 77 DOM
-
2026-06-10days on market $155,000 Active 74 DOM
-
2026-06-09days on market $155,000 Active 73 DOM
-
2026-06-08days on market $155,000 Active 72 DOM
-
2026-06-07days on market $155,000 Active 71 DOM
-
2026-06-03days on market $155,000 Active 67 DOM
-
2026-06-02days on market $155,000 Active 66 DOM
-
2026-06-01days on market $155,000 Active 65 DOM
-
2026-05-31days on market $155,000 Active 64 DOM
-
2026-05-31remarks 546-char remark
-
2026-05-31pricedays on market $155,000 Active 63 DOM
-
2026-04-17price $168,000 535-char remark
Show marketing remark (535 chars)
INVESTORS!!! Great home in the Heart of Mission, This house features a 3-bedroom one bath home with a large family room to enjoy, and in the back above the carport, you have a one-bedroom one bath apartment with a small kitchen that can be rented out or used as a mother in-law suite. Either way in total you have 2464 sq ft of living. This is a great investment opportunity; both can be rented out individually. Don't miss out and set up your appointment now to see it. Call now to schedule your private showing, Sellers are motivated
-
2026-03-28$175,000 Active 535-char remark
Show marketing remark (535 chars)
INVESTORS!!! Great home in the Heart of Mission, This house features a 3-bedroom one bath home with a large family room to enjoy, and in the back above the carport, you have a one-bedroom one bath apartment with a small kitchen that can be rented out or used as a mother in-law suite. Either way in total you have 2464 sq ft of living. This is a great investment opportunity; both can be rented out individually. Don't miss out and set up your appointment now to see it. Call now to schedule your private showing, Sellers are motivated
-
2021-04-21soldstatus
-
2021-01-28$145,000 Active
-
2020-03-23$135,000 Active
-
2020-03-16historical Withdrawn
-
2020-01-28price $149,000
-
2019-12-23$160,000 Active
ⓘ Source: listings_history table (triggers on properties + properties_extension) + one-shot
backfill from property_details.listing_events for pre-trigger history.
Tax reassessment forecast TX · Resets to sale price
- Current annual tax
- $4,024 · $335/mo
- Projected year-2 tax
- $4,024 · $335/mo
- Expected delta
- $0/yr ($0/mo · 0.0%)
ⓘ Screening estimate from a state-policy table — verify with the county assessor before closing.
Climate risk First Street
- Flood 1/10 Low FEMA zone X · 0% chance over 30 yrs
- Wildfire 2/10 Low
- Heat 9/10 Extreme 7 d/yr ≥111°F today · 20 d/yr by 30 yrs out
- Wind 8/10 Severe 96% chance of damaging wind over 30 yrs
- Air quality 2/10 Low 1 unhealthy d/yr today · 2 by 30 yrs out
Nearby sold comps map
Loading sold comps map…
Walkable amenities ~0.75 mi
Loading nearby amenities…
Taxation est. · year 1
- Rental income
- $15,541
- − Mortgage interest
- −$8,682
- − Property taxes
- −$4,024
- − Insurance
- −$775
- − Repairs & maintenance
- −$1,243
- − Management
- −$1,243
- − Depreciation
- −$4,509
- Taxable loss
- −$4,936
- Est. tax savings @ 24.0%
- +$1,185
- After-tax cash flow
- $-1,091/yr
For passive investors: Depreciation is non-cash, so a rental often shows a tax loss while cash-flowing — sheltering income. Rental losses are passive: they offset passive income freely, and up to $25,000/yr can offset ordinary (W-2) income if you actively participate and your MAGI is under $100k (phasing out to $0 by $150k); unused losses carry forward. On sale, claimed depreciation is recaptured at up to 25%, and gains may owe capital-gains tax (a 1031 exchange can defer both). Figures are a year-1 estimate at your 24.0% rate — not tax advice; consult a CPA.
Schools (NCES district)
- District
- Mission CISD
- NCES district ID
- 4831040
- Math proficiency
- 15% ▼ -35.00%
- Reading proficiency
- 28% ▼ -15.00%
- Median HH income
- $32,855
- Composite
- 17.47/100
- National rank
- #9061
- State rank
- #775 of 826 in TX
Livability — Mission
- Score
- 75/100
- State rank
- #148
- US rank
- #4155
Category grades
Schools grade is shown separately in the Schools card above.
Census & demographics
- Census place
- Mission, TX
- County
- Hidalgo County · 623,128 people
- City population
- 78,024
- Metro
- McAllen-Edinburg-Mission, TX
- Population (ZIP)
- 78,024
- Household income
- $54,298
- Rent vs Own
- Severe rent burden
- 1714.0
Population outlook (Hidalgo County) Hauer SSP2
- Today (2025)
- 955,232 people
- By 2030
- 1,009,774 · +5.7%
- By 2040
- 1,120,332 · +17.3%
- By 2050
- 1,225,036 · +28.2%
- By 2075
- 1,439,189 · +50.7%
- By 2100
- 1,533,429 · +60.5%
Race, ethnicity, and origin ACS 2023
- Neighborhood character
- Predominantly Hispanic (85%)
- Race & ethnicity
- Hispanic / Latino 85% Two or more races 47% White 12% Asian 2%
- Hispanic origin (detail)
- Mexican 80%
- Common ancestry
- Slovak 1% Portuguese 0%
- Foreign-born
- 28% · Canada, South Korea
- Languages at home
- 22% English-only · Spanish 76%
Political lean MEDSL · Hidalgo
- 2024 margin
- Toss-up / Even · D 48.1% · R 51.0%
- 2008→2024 swing
- -41.6pp toward R · 2008: 38.7pp · 2024: -2.9pp
- All cycles
- 2024: R+2.9 2020: D+17.1 2016: D+40.5 2012: D+41.8 2008: D+38.7
Not yet ingested
- Civics
- —
Market trends
- HPI YoY
- ▼ -62.35%
- Current HPI
- 209.3573
- Rent YoY
- ▲ 0.93%
- Metro
- McAllen-Edinburg-Mission, TX
- State GDP YoY
- ▲ 3.95%
- F500 in state
- 110
Industry mix (Fortune 500 HQ in TX)
| Industry | F500 HQs | Revenue |
|---|---|---|
| Energy | 16 | $1,198B |
|
||
| Technology | 5 | $198B |
|
||
| Engineering / Construction | 4 | $72B |
|
||
| Energy Services | 3 | $60B |
|
||
| Utilities | 3 | $41B |
|
||
| Healthcare | 2 | $330B |
|
||
Price history
+5.0% since first listed8 events — show timeline
- 2026-04-17 Price Changed $168,000 MCALLENMLS
- 2026-03-28 Listed $175,000 MCALLENMLS
- 2021-04-21 Sold (Public Records) — Public Records
- 2021-01-28 Listed $145,000 MCALLENMLS
- 2020-03-23 Listed $135,000 MCALLENMLS
- 2020-03-16 Delisted — MCALLENMLS
- 2020-01-28 Price Changed $149,000 MCALLENMLS
- 2019-12-23 Listed $160,000 MCALLENMLS
Property tax history
+11.1%/yrLatest (2025): $4,024 · +7.9% YoY. Source: county tax records.
Cash-flow waterfall
monthlySold comps — $/sqft
last 12 mo · ≤1 miLoading sold comps…