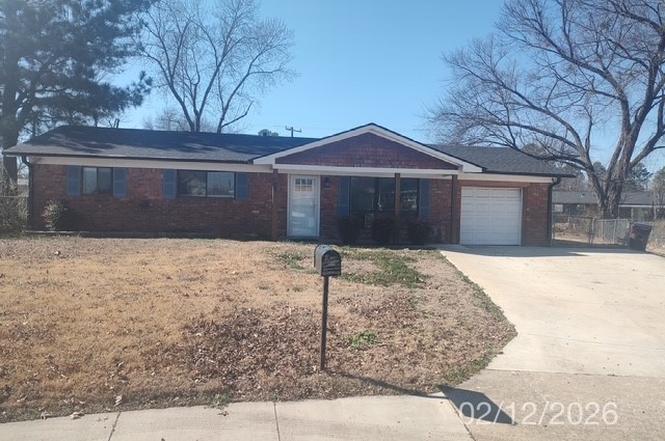
108 Fordham Cir · Fort Smith, AR
Flood risk 1/10 · Minimal
- FEMA flood zone
- X (unshaded)
- Chance of flooding over 30 yrs
- 0.0%
- Est. flood insurance / yr
- $507 – $1,088
Fire risk 4/10 · Minor
- Est. fire insurance / yr
- $1,499 – $2,785
Heat risk 7/10 · Major
- Hot days now (above 111°F)
- 7 days/yr
- Hot days in 30 yrs
- 20 days/yr
Wind risk 2/10 · Minimal
- Chance of severe wind over 30 yrs
- 3.0%
Air-quality risk 2/10 · Minimal
- Unhealthy air days now
- 0 days/yr
- Unhealthy air days in 30 yrs
- 1 days/yr
Risk factors via First Street. Map © Google.
Why this score? — see what drove the C grade
The composite is a weighted blend of 9 inputs, each scored 0–100. Each bar is that input's sub-score; the figure is the points it added to the 100-point composite (weight × sub-score).
- Cash flow +19.8/30.0
- ARV discount +15.0/15.0
- DSCR +6.3/10.0
- 1% rule +4.0/10.0
- Livability +3.2/5.0
- Schools +3.1/10.0
- Rent growth +2.5/5.0
- Condition / age +2.5/5.0
- Appreciation +0.0/10.0
$140,900
🖨 Deal sheet (PDF) 📄 Offer letter ✓ Due diligence
Listing remarks MLS
3 bed 2 bath home just minutes to I-540 and at the end of cul-de-sac. This home features lots of updates including roof, appliances, and driveway. Fenced in backyard makes a great place to relax.
Key facts
- Fenced in backyard
- Cul-de-sac
- 0.32 acre lot
Tags
Property features AI
Exterior
- Parking: Attached garage; 2 covered parking spaces; Concrete driveway/parking
- Utilities: Public water; Electricity available; Natural gas available; Sewer available; Water available
- Home design: Single-family house; One story
- Construction: Brick and vinyl siding construction; Slab foundation
- Exterior features: Covered patio; Patio; Back yard fencing; Chain link fence; Shingle roof; Cleared lot; Paved road access; Publicly maintained road
Interior
- Kitchen: Dishwasher; Microwave; Range; Gas water heater
- Flooring: Carpet; Ceramic tile
- Bathrooms: 2 full bathrooms
- Heating & cooling: Central heating (natural gas); Central air conditioning; Ceiling fans
- Interior features: Ceiling fans; Eat-in kitchen
- Laundry & utility: Electric dryer hookup
Neighborhood map
What this means for you Summary
Snapshot
- This is a 3-bed/2.0-bath single-family listed at $141k.
Deal economics
- At list price, monthly cash flow is $167 ($2k/yr) — positive.
- The deal already cash-flows at list — no discount required.
- To meet the 1% rule (rent ≥ 1% of price), the offer needs to be $127k (9.7% below list).
- Recommended offer: $124k (12.0% below list) — sets the bar for market timing.
- Cap rate 7.7% vs local median 4.3% in Fort Smith — top-decile yield for the area; either an underpriced asset or a hidden risk that comps aren't pricing in. Stress-test before assuming the spread holds.
Location & tenants
- Location reads 65/100 on livability (#151 in AR) — a middle-class / working-renter tenant base. Strengths: cost of living A+, housing A+, health & safety A+; Watch: crime F, amenities F, commute F.
- Fort Smith School District (urban): math 35% / reading 39% proficiency, ranked #106 of 238 in AR (top 44%) — families likely to look elsewhere, expect single-tenant / working-renter base with shorter leases; 64% free/reduced lunch — lower-income household profile, screen leases tightly.
- Zoned schools: Cavanaugh Elementary School (math 57% / reading 52%, grade C, #60 of 454 statewide, top 15%, 310 students, 66% FRL); Ramsey Junior High School (math 37% / reading 47%, grade D-, #78 of 201 statewide, top 40%, 832 students, 67% FRL); Southside High School (math 36% / reading 53%, grade F, #31 of 292 statewide, top 12%, 1,956 students, 47% FRL) — zoned schools at 60% FRL track the district average.
- Market conditions: 97 active listings in the ZIP; 14 comparable units currently listed for rent nearby; rentals at typical pace (median 23d on market — plan ~3-4 weeks tenant-placement turnaround); 388 units permitted in Sebastian County in 2024 (16 in 5+ unit buildings).
Forward outlook
- Local home prices are declining (-3.0%/yr); year-one equity from $974 of loan paydown is wiped out by about $4k of value loss. Plan a longer hold.
- Sebastian County population projected at +7% by 2050 — modest demand growth; plan on rents tracking national, not racing it.
Negotiation context
- It's been on market 135 days — a 12% lower offer ($124k) is reasonable based on typical stale-listing flexibility.
- 3 sale attempts since 6y ago; this cycle's ask has dropped $32k (19%) from the opening price — seller is motivated, your offer sets the floor, not the list.
Risks & watch-outs
- Climate carrying-cost: extreme-heat days projected 7→20/yr by 2055 (HVAC capex compounding) — expect insurance premiums to compound above CPI over the hold.
Questions for the listing agent
- It's been on market 135 days. Have you received any prior offers? Is the seller open to a 12% concession, seller financing, or rate buy-down credit?
- Why hasn't it sold? Are there any deal-killer items the seller is aware of (foundation, flood, title, zoning, code violations)?
- Is there a deadline driving the sale (1031 exchange, divorce, estate, relocation)? That informs how much negotiation room exists.
- Schools are D-rated, which usually means shorter tenancies and higher turnover. Who's the typical renter profile here, and what's been the actual vacancy rate?
- Crime grade is F in this area — have there been break-ins, vandalism, or insurance claims at this property in the last 3 years? What carrier currently insures it and at what premium?
- What's the average days-on-market for RENTAL listings here right now (not sales)? A rising rental-DOM trend means longer vacancies and softer asking-rent achievability than the comps imply.
- What's the recent tenant-quality profile in this submarket — average credit score on applications, eviction rate, late-payment / NSF rate, and stable-employment percentage? A property-management company in the area should have these aggregated.
- How much new for-sale + rental construction is in the pipeline within 1–3 miles? Heavy new supply typically softens prices + rents 12–24 months out; constrained supply supports both.
Investment metrics
- 1% rule
- 0.90% ✗
- Cap rate
- 7.72%
- Cash-on-cash
- 5.08%
- DSCR
- 1.23
- GRM
- 9.2
CMA / ARV
- ARV (on-the-fly)
- $184,044
- Comps found
- 12
Show comp detail 12 sales within ~0.75 mi
| Address | Dist | Beds/Ba | Sqft | Sold | Price | $/sf | Match |
|---|---|---|---|---|---|---|---|
| 202 S 21st Ter | 0.16mi | 3/2.0 | 1,325 (+6%) | 1mo | $195,000 | $147 | 82 |
| 7912 S 24th St | 0.32mi | 3/2.0 | 1,279 (+2%) | 0mo | $180,000 | $141 | 81 |
| 125 Georgetown Ln | 0.13mi | 3/2.0 | 1,189 (-5%) | 10mo | $178,500 | $150 | 77 |
| 217 Baylor Cir | 0.35mi | 3/2.0 | 1,304 (+4%) | 4mo | $120,500 | $92 | 73 |
| 8218 Colony Ln | 0.06mi | 4/2.0 (+1) | 1,400 (+12%) | 2mo | $239,000 | $171 | 70 |
| 8023 Colony Ln | 0.12mi | 3/2.0 | 1,080 (-14%) | 7mo | $175,000 | $162 | 65 |
| 7713 S 24th St | 0.42mi | 3/2.0 | 1,340 (+7%) | 7mo | $180,000 | $134 | 63 |
| 213 Cornell Ave | 0.26mi | 3/1.5 | 1,080 (-14%) | 3mo | $149,000 | $138 | 61 |
| 204 Amherst Cir | 0.27mi | 4/2.0 (+1) | 1,425 (+14%) | 0mo | $170,000 | $119 | 59 |
| 8604 Meadow Dr | 0.41mi | 3/2.0 | 1,376 (+10%) | 12mo | $202,500 | $147 | 54 |
| 7800 Colony Ln | 0.30mi | 3/1.5 | 1,064 (-15%) | 8mo | $149,000 | $140 | 52 |
| 8105 S 22nd Ter | 0.24mi | 3/1.0 | 1,075 (-14%) | 13mo | $165,000 | $153 | 50 |
Match score weights: distance 35% · size 25% · config 20% · recency 20%. Top-matched comps best support the ARV.
Projected returns pro-forma
-3.0% appreciation · 3.0% rent growth · sell at horizon
- IRR
- -8.5%
- Equity multiple
- 0.69×
- Total profit
- $-12,252
- Equity at exit
- $21,009
- IRR
- 1.0%
- Equity multiple
- 1.07×
- Total profit
- $2,775
- Equity at exit
- $12,182
Cash invested: $39,452 (down + closing). Projections, not guarantees.
Landlord ↔ Tenant lean methodology
- Overall (STATE)
- 92 Strongly Landlord-Friendly
- State Arkansas
- 92 Strongly Landlord-Friendly · R+14
- County
- — inherits STATE
- City
- — inherits STATE
ZIP-level market 72908
- Active inventory
- 97
- Price-to-rent
- 9.2×
Monthly cashflow live
- Estimated rent
- $1,272 high interval (Pro) →
- Mortgage (P&I)
- −$739
- Tax from tax record
- −$40 /mo · $479/yr
- Insurance
- −$59
- HOA
- −$0
- Vacancy / Maint / Mgmt
- −$267
- Net cashflow
- $167
Break-even live
Sensitivity live
| Price | -10% $247 | -5% $207 | +0% $167 | +5% $127 | +10% $87 |
|---|---|---|---|---|---|
| Rent | -10% $67 | -5% $117 | +0% $167 | +5% $217 | +10% $268 |
| Rate | -1.0pp $238 | -0.5pp $203 | base $167 | +0.5pp $131 | +1.0pp $93 |
UW: 25.0% down · 7.5% · 30yr · 1.5% tax · 5.0% vac · 8.0% maint · 8.0% mgmt
Financing live
Cash to close
- Down payment
- $35,225
- Closing costs
- $4,227
- Reserves months
- —
- Total cash needed
- —
Loan-product check · same deal, 3 products live
Conventional
25% down · 7.5% · 30yr
- Down + closing
- —
- Monthly P&I
- —
- Monthly cashflow
- —
- DSCR
- —
- Eligible?
- —
Personal DTI + credit; lowest rate.
DSCR
20% down · 8.5% · 30yr
- Down + closing
- —
- Monthly P&I
- —
- Monthly cashflow
- —
- DSCR
- —
- Eligible?
- —
No personal income docs; deal must DSCR.
Hard money
10% down · 12.0% · 12mo
- Down + closing
- —
- Monthly P&I
- —
- Monthly cashflow
- —
- DSCR
- —
- Eligible?
- —
Short-term bridge; refi at stabilization.
Rent comps 14 comps
| Address | Beds | Baths | Sqft | Rent | $/sqft | DOM | Units | Dist |
|---|---|---|---|---|---|---|---|---|
| 8500 S 28th St Unit 8502-09 Fort Smith, AR | 2.0 | 2.0 | 920 | $825 | $0.90 | 23d | 1 | 0.49mi |
| 1206 Mesa Dr Fort Smith, AR | 3.0 | 2.0 | 1369 | $1,400 | $1.02 | 15d | 1 | 0.49mi |
| 2601 Oakview Rd Unit 2609-03 Fort Smith, AR | 2.0 | 2.0 | 920 | $825 | $0.90 | 23d | 1 | 0.61mi |
| 8817 S 28th St Unit 13-4 Fort Smith, AR | 2.0 | 2.0 | 975 | $900 | $0.92 | 23d | 1 | 0.71mi |
| 1709 Brooken Hill Dr Fort Smith, AR | 2.0 | 2.0 | 1043 | $1,100 | $1.05 | 15d | 1 | 0.76mi |
| 2807 Fairway Hamlet Ct Fort Smith, AR | 3.0 | 2.0 | 1319 | $1,400 | $1.06 | 23d | 1 | 0.77mi |
| 8605 S 32nd Ter Fort Smith, AR | 3.0 | 1.5 | 1196 | $1,600 | $1.34 | 15d | 1 | 0.82mi |
| 3305 Grinnell Ave Fort Smith, AR | 3.0 | 1.5 | 1140 | $1,200 | $1.05 | 15d | 1 | 0.89mi |
| 8516 S 35th Ter Fort Smith, AR | 3.0 | 2.0 | 1294 | $1,200 | $0.93 | 23d | 1 | 0.98mi |
| 1415 Willowbrook Cir Fort Smith, AR | 3.0 | 2.0 | 1650 | $1,299 | $0.79 | 15d | 1 | 0.98mi |
| 7401 Martin Dr Unit 7 Fort Smith, AR | 2.0 | 2.0 | 900 | $995 | $1.11 | 15d | 1 | 1.02mi |
| 3406 Erin Oaks Ct Fort Smith, AR | 3.0 | 2.0 | 1715 | $2,000 | $1.17 | 23d | 1 | 1.21mi |
| 700 Hillside Dr Fort Smith, AR | 3.0 | 1.5 | 1168 | $1,400 | $1.20 | 23d | 1 | 1.21mi |
| 1439 Brazil Ave Fort Smith, AR | 3.0 | 2.0 | 1050 | $900 | $0.86 | 23d | 1 | 1.39mi |
Listing history 18 events
-
2026-06-07statusdays on market $140,900 Pending 135 DOM
-
2026-06-03days on market $140,900 Active 132 DOM
-
2026-06-02days on market $140,900 Active 131 DOM
-
2026-06-01days on market $140,900 Active 130 DOM
-
2026-05-31days on market $140,900 Active 129 DOM
-
2026-05-30days on market $140,900 Active 128 DOM
-
2026-05-19price $140,900
-
2026-04-08price $149,000
-
2026-02-24price $164,000
-
2026-01-21$173,000 Active
-
2023-11-24soldstatus $168,000 Closed 195-char remark
Show marketing remark (195 chars)
3 bed 2 bath home just minutes to I-540 and at the end of cul-de-sac. This home features lots of updates including roof, appliances, and driveway. Fenced in backyard makes a great place to relax.
-
2023-10-30status Pending 195-char remark
Show marketing remark (195 chars)
3 bed 2 bath home just minutes to I-540 and at the end of cul-de-sac. This home features lots of updates including roof, appliances, and driveway. Fenced in backyard makes a great place to relax.
-
2023-10-29price $168,000 195-char remark
Show marketing remark (195 chars)
3 bed 2 bath home just minutes to I-540 and at the end of cul-de-sac. This home features lots of updates including roof, appliances, and driveway. Fenced in backyard makes a great place to relax.
-
2023-10-26$162,000 Active 195-char remark
Show marketing remark (195 chars)
3 bed 2 bath home just minutes to I-540 and at the end of cul-de-sac. This home features lots of updates including roof, appliances, and driveway. Fenced in backyard makes a great place to relax.
-
2020-06-29soldstatus $120,000
-
2020-06-29soldstatus $120,000
-
2020-06-26soldstatus $120,000 1-char remark
Show marketing remark (1 chars)
.
-
2020-05-19$114,900 1-char remark
Show marketing remark (1 chars)
.
ⓘ Source: listings_history table (triggers on properties + properties_extension) + one-shot
backfill from property_details.listing_events for pre-trigger history.
Tax reassessment forecast AR · Resets to sale price
- Current annual tax
- $479 · $40/mo
- Projected year-2 tax
- $902 · $75/mo
- Expected delta
- +$422/yr (+$35/mo · 88.1%)
ⓘ Screening estimate from a state-policy table — verify with the county assessor before closing.
Climate risk First Street
- Flood 1/10 Low FEMA zone X (unshaded) · 0% chance over 30 yrs
- Wildfire 4/10 Moderate
- Heat 7/10 Severe 7 d/yr ≥111°F today · 20 d/yr by 30 yrs out
- Wind 2/10 Low 3% chance of damaging wind over 30 yrs
- Air quality 2/10 Low 0 unhealthy d/yr today · 1 by 30 yrs out
Nearby sold comps map
Loading sold comps map…
Walkable amenities ~0.75 mi
Loading nearby amenities…
Taxation est. · year 1
- Rental income
- $15,261
- − Mortgage interest
- −$7,893
- − Property taxes
- −$479
- − Insurance
- −$704
- − Repairs & maintenance
- −$1,221
- − Management
- −$1,221
- − Depreciation
- −$4,099
- Taxable loss
- −$356
- Est. tax savings @ 24.0%
- +$85
- After-tax cash flow
- $2,091/yr
For passive investors: Depreciation is non-cash, so a rental often shows a tax loss while cash-flowing — sheltering income. Rental losses are passive: they offset passive income freely, and up to $25,000/yr can offset ordinary (W-2) income if you actively participate and your MAGI is under $100k (phasing out to $0 by $150k); unused losses carry forward. On sale, claimed depreciation is recaptured at up to 25%, and gains may owe capital-gains tax (a 1031 exchange can defer both). Figures are a year-1 estimate at your 24.0% rate — not tax advice; consult a CPA.
Schools (NCES district)
- District
- Fort Smith School District
- NCES district ID
- 0506330
- Math proficiency
- 35% ▼ -11.00%
- Reading proficiency
- 39% ▼ -7.00%
- Median HH income
- $36,066
- Composite
- 30.66/100
- National rank
- #6183
- State rank
- #106 of 238 in AR
Livability — Fort Smith
- Score
- 65/100
- State rank
- #151
- US rank
- #13185
Category grades
Schools grade is shown separately in the Schools card above.
Census & demographics
- Census place
- Fort Smith, AR
- County
- Sebastian County · 99,312 people
- City population
- 94,356
- Metro
- Fort Smith, AR-OK
- Population (ZIP)
- 14,288
- Household income
- $72,732
- Rent vs Own
- Severe rent burden
- 354.0
Population outlook (Sebastian County) Hauer SSP2
- Today (2025)
- 133,992 people
- By 2030
- 136,620 · +2.0%
- By 2040
- 140,832 · +5.1%
- By 2050
- 143,301 · +6.9%
- By 2075
- 147,964 · +10.4%
- By 2100
- 145,848 · +8.8%
Race, ethnicity, and origin ACS 2023
- Neighborhood character
- Predominantly White (74%)
- Race & ethnicity
- White 74% Two or more races 11% Hispanic / Latino 9% Asian 6% Black 2% Native American 2%
- Hispanic origin (detail)
- Mexican 6%
- Common ancestry
- Slovak 4% Lithuanian 4% Italian 1%
- Foreign-born
- 5% · Vietnam, Canada
- Languages at home
- 90% English-only · Spanish 4% Vietnamese 3% Other Asian/Pacific 2%
Political lean MEDSL · Sebastian
- 2024 margin
- Solid R (+37.5) · D 30.0% · R 67.6% · Other 2.4%
- 2008→2024 swing
- -2.9pp toward R · 2008: -34.6pp · 2024: -37.5pp
- All cycles
- 2024: R+37.5 2020: R+35.5 2016: R+38.1 2012: R+37.1 2008: R+34.6
Not yet ingested
- Civics
- —
Market trends
- HPI YoY
- ▼ -136.01%
- Current HPI
- 202.0886
- Rent YoY
- —
- Metro
- Fort Smith, AR-OK
- State GDP YoY
- ▲ 3.80%
- F500 in state
- 10
Industry mix (Fortune 500 HQ in AR)
| Industry | F500 HQs | Revenue |
|---|---|---|
| Retail | 1 | $681B |
|
||
| Food / Agriculture | 1 | $53B |
|
||
| Retail / Energy | 1 | $22B |
|
||
| Transportation / Logistics | 1 | $12B |
|
||
| Energy | 1 | $4B |
|
||
Price history
+22.6% since first listed12 events — show timeline
- 2026-05-19 Price Changed $140,900 WRVBOR
- 2026-04-08 Price Changed $149,000 WRVBOR
- 2026-02-24 Price Changed $164,000 WRVBOR
- 2026-01-21 Listed $173,000 WRVBOR
- 2023-11-24 Sold (MLS) $168,000 WRVBOR
- 2023-10-30 Pending — WRVBOR
- 2023-10-29 Price Changed $168,000 WRVBOR
- 2023-10-26 Listed $162,000 WRVBOR
- 2020-06-29 Sold (Public Records) $120,000 Public Records
- 2020-06-29 Sold (Public Records) $120,000 Public Records
- 2020-06-26 Sold (MLS) $120,000 WRVBOR
- 2020-05-19 Listed $114,900 WRVBOR
Property tax history
-4.4%/yrLatest (2025): $479 · -10.9% YoY. Source: county tax records.
Cash-flow waterfall
monthlySold comps — $/sqft
last 12 mo · ≤1 miLoading sold comps…