510 7th Ave · Vinton, IA
Flood risk 1/10 · Minimal
- FEMA flood zone
- X (unshaded)
- Chance of flooding over 30 yrs
- 0.0%
- Est. flood insurance / yr
- $507 – $1,088
Fire risk 4/10 · Minor
- Est. fire insurance / yr
- $902 – $1,676
Heat risk 3/10 · Minor
- Hot days now (above 102°F)
- 7 days/yr
- Hot days in 30 yrs
- 15 days/yr
Wind risk 2/10 · Minimal
- Chance of severe wind over 30 yrs
- —
Air-quality risk 2/10 · Minimal
- Unhealthy air days now
- 0 days/yr
- Unhealthy air days in 30 yrs
- 1 days/yr
Risk factors via First Street. Map © Google.
Why this score? — see what drove the B grade
The composite is a weighted blend of 9 inputs, each scored 0–100. Each bar is that input's sub-score; the figure is the points it added to the 100-point composite (weight × sub-score).
- Cash flow +30.0/30.0
- 1% rule +10.0/10.0
- DSCR +10.0/10.0
- ARV discount +7.5/15.0
- Schools +6.6/10.0
- Livability +4.0/5.0
- Rent growth +2.5/5.0
- Condition / age +2.5/5.0
- Appreciation +0.0/10.0
$37,500
🖨 Deal sheet 📄 Offer letter ✓ Due diligence
Listing remarks MLS
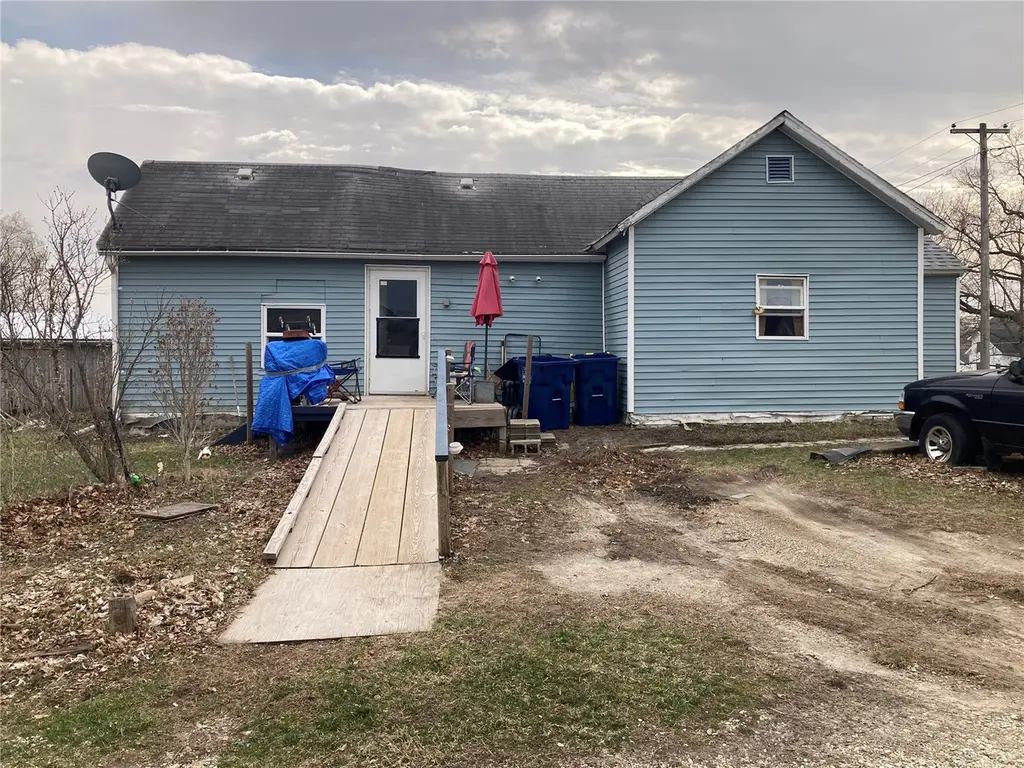
PRICED FOR INVESTORS - A 1 story, 2 bedroom, 1 bathroom home with newer forced air gas furnace, vinyl siding, 1 old storage building and a newer yard shed. Property is being sols in "as-is" and "where-as condition. "
Key facts
- Storage building
- Vinyl siding
- Yard shed
Tags
Neighborhood map
What this means for you Summary
Snapshot
- This is a 2-bed/1.0-bath single-family listed at $38k.
Deal economics
- At list price, monthly cash flow is $456 ($5k/yr) — positive.
- The deal already cash-flows at list — no discount required.
- Meets the 1% rule at list price ($856 rent vs $38k).
- Recommended offer: $35k (6.0% below list) — sets the bar for market timing.
- Cap rate 20.9% vs local median 1.9% in Vinton — top-decile yield for the area; either an underpriced asset or a hidden risk that comps aren't pricing in. Stress-test before assuming the spread holds.
Location & tenants
- Location reads 80/100 on livability (#88 in IA, #1,848 nationally) — a professional / high-income tenant draw. Strengths: schools A+, crime A+, cost of living A+; Watch: employment C-, amenities F, commute F.
- Vinton-Shellsburg Community School District (rural): math 79% / reading 77% proficiency, ranked #43 of 289 in IA (top 15%) — strong family-tenant draw, lease renewals of 3-5y typical.
- Market conditions: 61 active listings in the ZIP; 34 units permitted in Benton County in 2024 (0 in 5+ unit buildings).
Forward outlook
- Local home prices are declining (-3.0%/yr); year-one equity from $259 of loan paydown is wiped out by about $1k of value loss. Plan a longer hold.
- Benton County population projected at -13% by 2050 — secular population decline; favor cash flow + early exit over multi-decade hold.
- At projected returns (-3.0% appreciation + 3.0% rent growth), your $10k cash investment doubles in ~3 years — after that, you're playing with house money.
Negotiation context
- It's been on market 73 days — a 6% lower offer ($35k) is reasonable based on typical stale-listing flexibility.
- Current owner paid $22k; list at $38k implies a 70% gain — meaningful room to come down on a strong offer.
Risks & watch-outs
- Watch-outs: built in 1890 — expect roof / HVAC / electrical / plumbing capex.
Questions for the listing agent
- It's been on market 73 days. Have you received any prior offers? Is the seller open to a 6% concession, seller financing, or rate buy-down credit?
- Built in 1890 — when were the roof, HVAC, electrical panel, plumbing, and water heater last replaced?
- Why hasn't it sold? Are there any deal-killer items the seller is aware of (foundation, flood, title, zoning, code violations)?
- Is there a deadline driving the sale (1031 exchange, divorce, estate, relocation)? That informs how much negotiation room exists.
- Schools are A-rated — typically a magnet for longer-tenancy family renters. What's the average tenant stay here, and is there a school-zone premium baked into asking?
- What's the average days-on-market for RENTAL listings here right now (not sales)? A rising rental-DOM trend means longer vacancies and softer asking-rent achievability than the comps imply.
- What's the recent tenant-quality profile in this submarket — average credit score on applications, eviction rate, late-payment / NSF rate, and stable-employment percentage? A property-management company in the area should have these aggregated.
- How much new for-sale + rental construction is in the pipeline within 1–3 miles? Heavy new supply typically softens prices + rents 12–24 months out; constrained supply supports both.
Investment metrics
- 1% rule
- 2.28% ✓
- Cap rate
- 20.90%
- Cash-on-cash
- 52.15%
- DSCR
- 3.32
- GRM
- 3.7
CMA / ARV
- ARV (median comp)
- $127,883
- List price
- $37,500
- Delta
- -70.68%
- Verdict
- UNDERPRICED
- Comps
- 20 within 1.0 mi
Show comp detail 12 sales within ~0.75 mi
| Address | Dist | Beds/Ba | Sqft | Sold | Price | $/sf | Match |
|---|---|---|---|---|---|---|---|
| 510 7th Ave | 0.00mi | 2/1.0 | 987 (0%) | 1mo | $20,000 | $20 | 100 |
| 806 E 5th St | 0.08mi | 3/1.0 (+1) | 999 (+1%) | 7mo | $97,850 | $98 | 83 |
| 815 E 4th St | 0.18mi | 2/1.0 | 1,060 (+7%) | 18mo | $126,000 | $119 | 64 |
| 1005 5th Ave | 0.35mi | 3/1.0 (+1) | 936 (-5%) | 7mo | $148,000 | $158 | 64 |
| 706 5th Ave | 0.17mi | 2/1.0 | 1,134 (+15%) | 11mo | $123,000 | $108 | 58 |
| 1012 C | 0.66mi | 2/1.0 | 976 (-1%) | 15mo | $125,000 | $128 | 55 |
| 106 N 8th Ave | 0.37mi | 1/1.0 (-1) | 1,033 (+5%) | 18mo | $160,000 | $155 | 55 |
| 615 E 6th St | 0.03mi | 2/1.0 | 1,132 (+15%) | 23mo | $145,000 | $128 | 55 |
| 807 3rd Ave | 0.33mi | 3/1.0 (+1) | 1,057 (+7%) | 19mo | $90,000 | $85 | 52 |
| 606 E 11th St | 0.36mi | 1/1.0 (-1) | 842 (-15%) | 4mo | $96,000 | $114 | 50 |
| 1210 6th Ave | 0.44mi | 1/1.0 (-1) | 860 (-13%) | 18mo | $55,000 | $64 | 38 |
| 1106 C Ave | 0.69mi | 3/1.0 (+1) | 1,097 (+11%) | 14mo | $165,513 | $151 | 33 |
Match score weights: distance 35% · size 25% · config 20% · recency 20%. Top-matched comps best support the ARV.
Projected returns pro-forma
-3.0% appreciation · 3.0% rent growth · sell at horizon
- IRR
- 50.1%
- Equity multiple
- 3.19×
- Total profit
- $22,977
- Equity at exit
- $5,591
- IRR
- 55.5%
- Equity multiple
- 6.47×
- Total profit
- $57,389
- Equity at exit
- $3,242
Cash invested: $10,500 (down + closing). Projections, not guarantees.
Landlord ↔ Tenant lean methodology
- Overall (STATE)
- 83 Strongly Landlord-Friendly
- State Iowa
- 83 Strongly Landlord-Friendly · R+6
- County
- — inherits STATE
- City
- — inherits STATE
ZIP-level market 52349
- Home prices YoY
- -29.0%
- Active inventory
- 61
- Price-to-rent
- 3.7×
Monthly cashflow live
- Estimated rent
- $856 medium interval (Pro) →
- Mortgage (P&I)
- −$197
- Tax from tax record
- −$8 /mo · $92/yr
- Insurance
- −$16
- HOA
- −$0
- Vacancy / Maint / Mgmt
- −$180
- Net cashflow
- $456
Break-even live
UW: 25.0% down · 7.5% · 30yr · 1.5% tax · 5.0% vac · 8.0% maint · 8.0% mgmt
Financing live
Cash to close
- Down payment
- $9,375
- Closing costs
- $1,125
- Reserves months
- —
- Total cash needed
- —
Loan-product check · same deal, 3 products live
Conventional
25% down · 7.5% · 30yr
- Down + closing
- —
- Monthly P&I
- —
- Monthly cashflow
- —
- DSCR
- —
- Eligible?
- —
Personal DTI + credit; lowest rate.
DSCR
20% down · 8.5% · 30yr
- Down + closing
- —
- Monthly P&I
- —
- Monthly cashflow
- —
- DSCR
- —
- Eligible?
- —
No personal income docs; deal must DSCR.
Hard money
10% down · 12.0% · 12mo
- Down + closing
- —
- Monthly P&I
- —
- Monthly cashflow
- —
- DSCR
- —
- Eligible?
- —
Short-term bridge; refi at stabilization.
Listing history 11 events
-
2026-06-08days on market $37,500 Active 73 DOM
-
2026-06-07days on market $37,500 Active 72 DOM
-
2026-06-07days on market $37,500 Active 71 DOM
-
2026-06-04days on market $37,500 Active 68 DOM
-
2026-06-02days on market $37,500 Active 67 DOM
-
2026-06-01days on market $37,500 Active 66 DOM
-
2026-05-31days on market $37,500 Active 65 DOM
-
2026-05-31days on market $37,500 Active 64 DOM
-
2026-03-24$37,500 Active 236-char remark
Show marketing remark (236 chars)
PRICED FOR INVESTORS - A 1 story, 2 bedroom, 1 bathroom home with newer forced air gas furnace, vinyl siding, 1 old storage building and a newer yard shed. Property is being sols in "as-is" and "where-as condition. "
-
1997-08-26soldstatus $22,000
-
1997-08-14soldstatus $15,500
ⓘ Source: listings_history table (triggers on properties + properties_extension) + one-shot
backfill from property_details.listing_events for pre-trigger history.
Tax reassessment forecast IA · Partial reset (capped growth)
- Current annual tax
- $92 · $8/mo
- Projected year-2 tax
- $340 · $28/mo
- Expected delta
- +$248/yr (+$21/mo · 270.0%)
ⓘ Screening estimate from a state-policy table — verify with the county assessor before closing.
Climate risk First Street
- Flood 1/10 Low FEMA zone X (unshaded) · 0% chance over 30 yrs
- Wildfire 4/10 Moderate
- Heat 3/10 Moderate 7 d/yr ≥102°F today · 15 d/yr by 30 yrs out
- Wind 2/10 Low
- Air quality 2/10 Low 0 unhealthy d/yr today · 1 by 30 yrs out
Nearby sold comps map
Loading sold comps map…
Walkable amenities ~0.75 mi
Loading nearby amenities…
Taxation est. · year 1
- Rental income
- $10,273
- − Mortgage interest
- −$2,101
- − Property taxes
- −$92
- − Insurance
- −$188
- − Repairs & maintenance
- −$822
- − Management
- −$822
- − Depreciation
- −$1,091
- Taxable income
- $5,158
- Est. tax owed @ 24.0%
- −$1,238
- After-tax cash flow
- $4,238/yr
For passive investors: Depreciation is non-cash, so a rental often shows a tax loss while cash-flowing — sheltering income. Rental losses are passive: they offset passive income freely, and up to $25,000/yr can offset ordinary (W-2) income if you actively participate and your MAGI is under $100k (phasing out to $0 by $150k); unused losses carry forward. On sale, claimed depreciation is recaptured at up to 25%, and gains may owe capital-gains tax (a 1031 exchange can defer both). Figures are a year-1 estimate at your 24.0% rate — not tax advice; consult a CPA.
Schools (NCES district)
- District
- Vinton-Shellsburg Community School District
- NCES district ID
- 1929310
- Math proficiency
- 79% ▼ -6.00%
- Reading proficiency
- 77% ▼ -1.00%
- Median HH income
- $52,023
- Composite
- 66.21/100
- National rank
- #430
- State rank
- #43 of 289 in IA
Livability — Vinton
- Score
- 80/100
- State rank
- #88
- US rank
- #1848
Category grades
Schools grade is shown separately in the Schools card above.
Census & demographics
- Census place
- Vinton, IA
- Population (ZIP)
- 7,745
Population outlook (Benton County) Hauer SSP2
- Today (2025)
- 25,078 people
- By 2030
- 24,606 · -1.9%
- By 2040
- 23,425 · -6.6%
- By 2050
- 21,891 · -12.7%
- By 2075
- 19,482 · -22.3%
- By 2100
- 17,139 · -31.7%
Race, ethnicity, and origin ACS 2023
- Neighborhood character
- Predominantly White (94%)
- Race & ethnicity
- White 94% Two or more races 4% Hispanic / Latino 2%
- Common ancestry
- Portuguese 7% Italian 3% Iranian 3%
- Foreign-born
- 1% · Canada
- Languages at home
- 96% English-only · German/W. Germanic 2% Spanish 2%
Political lean MEDSL · Benton
- 2024 margin
- Solid R (+33.2) · D 32.8% · R 66.0% · Other 1.3%
- 2008→2024 swing
- -37.7pp toward R · 2008: 4.5pp · 2024: -33.2pp
- All cycles
- 2024: R+33.2 2020: R+27.5 2016: R+26.0 2012: R+0.6 2008: D+4.5
Not yet ingested
- Civics
- —
Market trends
- HPI YoY
- ▼ -80.56%
- Current HPI
- 197.3164
- Rent YoY
- —
- Metro
- —
- State GDP YoY
- ▲ 2.48%
- F500 in state
- 4
Industry mix (Fortune 500 HQ in IA)
| Industry | F500 HQs | Revenue |
|---|---|---|
| Financial Services | 1 | $16B |
|
||
| Retail / Convenience | 1 | $15B |
|
||
Price history
+141.9% since first listed3 events — show timeline
- 2026-03-24 Listed $37,500 CRAAR, CDRMLS
- 1997-08-26 Sold (Public Records) $22,000 Public Records
- 1997-08-14 Sold (Public Records) $15,500 Public Records
Property tax history
-1.2%/yrLatest (2024): $92 · -53.5% YoY. Source: county tax records.
Cash-flow waterfall
monthlySold comps — $/sqft
last 12 mo · ≤1 miLoading sold comps…