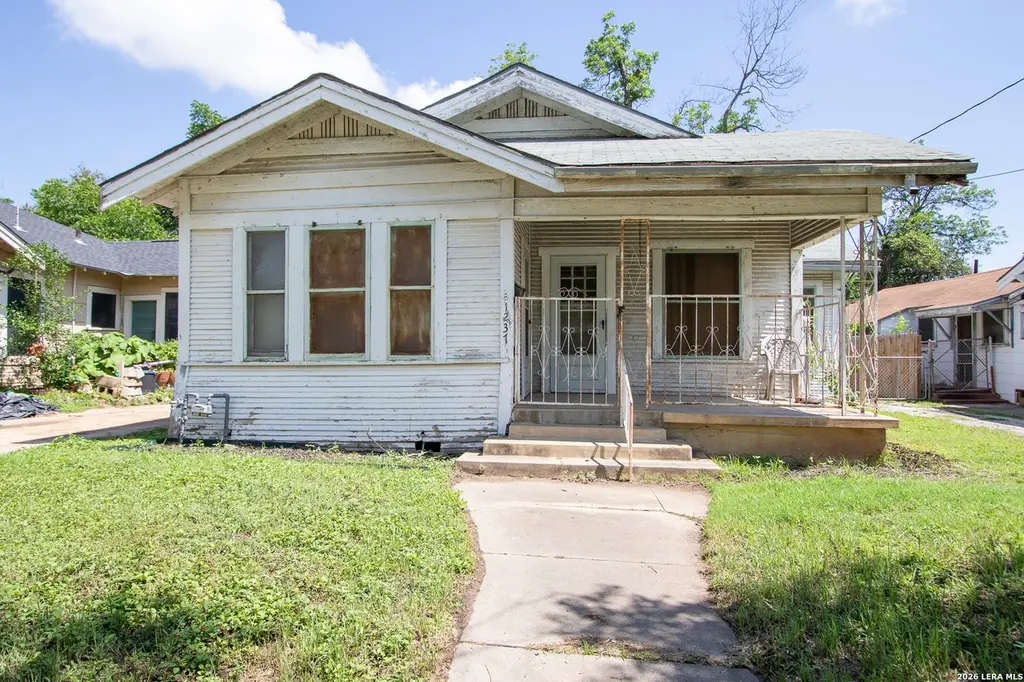
1237 Denver Blvd · San Antonio, TX
Flood risk 1/10 · Minimal
- FEMA flood zone
- X (unshaded)
- Chance of flooding over 30 yrs
- 0.0%
- Est. flood insurance / yr
- $507 – $1,088
Fire risk 1/10 · Minimal
- Est. fire insurance / yr
- $1,222 – $2,270
Heat risk 8/10 · Major
- Hot days now (above 108°F)
- 7 days/yr
- Hot days in 30 yrs
- 21 days/yr
Wind risk 8/10 · Major
- Chance of severe wind over 30 yrs
- 80.0%
Air-quality risk 2/10 · Minimal
- Unhealthy air days now
- 1 days/yr
- Unhealthy air days in 30 yrs
- 2 days/yr
Risk factors via First Street. Map © Google.
Why this score? — see what drove the C+ grade
The composite is a weighted blend of 9 inputs, each scored 0–100. Each bar is that input's sub-score; the figure is the points it added to the 100-point composite (weight × sub-score).
- Cash flow +22.2/30.0
- ARV discount +15.0/15.0
- DSCR +7.1/10.0
- 1% rule +6.6/10.0
- Livability +4.0/5.0
- Rent growth +2.8/5.0
- Condition / age +2.5/5.0
- Schools +1.4/10.0
- Appreciation +0.0/10.0
$135,000
🖨 Deal sheet 📄 Offer letter ✓ Due diligence
Listing remarks
Investor opportunity with endless potential! This 3 bedroom, 1 bath home offers a great foundation for your next project, rental investment, or fixer-upper opportunity. The property also includes a detached dwelling featuring 1 bedroom and 1 bath - ideal for guest quarters, rental income, or a private workspace. Situated on a spacious property with plenty of possibilities, this home is ready for your vision and creativity. Whether you're looking to renovate, expand, or add to your investment portfolio, this property offers incredible potential.
Key facts
- Private workspace
- Guest quarters
- Detached dwelling
Tags
Property features AI
Finance
- Other: Possession at closing/funding; For sale
- HOA & community: Subdivision: Denver Heights
Exterior
- Parking: 2-car garage
- Utilities: City water (SAWS); City sewer (SAWS); Electric service (CPS); City garbage service
- Home design: Wood exterior; Composition roof; Pre-owned; Approximate age: 82 years
- Construction: Wood exterior construction; Composition roof
- Exterior features: Covered patio; Patio slab; Mature trees; Detached quarters
Interior
- Kitchen: Eat-in kitchen (10 x 12)
- Bedrooms: Master bedroom (11 x 11) with ceiling fan; Bedroom 2 (10 x 10); Bedroom 3 (10 x 10)
- Flooring: Wood flooring; Vinyl flooring; Laminate flooring
- Bathrooms: 1 full bathroom
- Heating & cooling: Electric heat (window unit); Two window air conditioning units
- Interior features: Ceiling fans; Washer and dryer connections; Eat-in kitchen; Ground level / no steps; Laundry on main level; All window coverings remain; 1 living area
- Laundry & utility: Washer connection; Dryer connection; Laundry located on main level
Neighborhood map
What this means for you Summary
Snapshot
- This is a 3-bed/1.0-bath single-family listed at $135k.
Deal economics
- At list price, monthly cash flow is $220 ($3k/yr) — positive.
- The deal already cash-flows at list — no discount required.
- Meets the 1% rule at list price ($2k rent vs $135k).
- Recommended offer: $133k (1.5% below list) — sets the bar for market timing.
- Cap rate 8.3% vs local median 3.8% in San Antonio — top-decile yield for the area; either an underpriced asset or a hidden risk that comps aren't pricing in. Stress-test before assuming the spread holds.
Location & tenants
- Location reads 80/100 on livability (#31 in TX, #1,616 nationally) — a professional / high-income tenant draw. Strengths: amenities A+, commute A+, cost of living A+; Watch: schools C-, crime F.
- San Antonio ISD (urban): math 12% / reading 22% proficiency, ranked #805 of 826 in TX (top 98%) — low school quality limits family demand, transient renter base, plan for 1-2y turnover; 80% free/reduced lunch — lower-income household profile, screen leases tightly.
- Market conditions: Rents rising (+1.1%/yr); 269 active listings in the ZIP; 40 comparable units currently listed for rent nearby; rentals at typical pace (median 24d on market — plan ~3-4 weeks tenant-placement turnaround); 8,308 units permitted in Bexar County in 2024 (2,506 in 5+ unit buildings).
- This rent runs 34% of the median local income ($55k/yr) — at the standard rent-burdened threshold; future hikes will face affordability resistance.
Forward outlook
- Local home prices are declining (-3.0%/yr); year-one equity from $933 of loan paydown is wiped out by about $4k of value loss. Plan a longer hold.
- Bexar County population projected at +50% by 2050 — long-run rental-demand tailwind backs the buy-and-hold thesis.
Negotiation context
- It's been on market 24 days — a 2% lower offer ($133k) is reasonable based on typical stale-listing flexibility.
Risks & watch-outs
- Watch-outs: built in 1944 — expect roof / HVAC / electrical / plumbing capex.
- Climate carrying-cost: severe wind risk, 80% chance of damaging wind over 30y; extreme-heat days projected 7→21/yr by 2055 (HVAC capex compounding) — expect insurance premiums to compound above CPI over the hold.
Questions for the listing agent
- Built in 1944 — when were the roof, HVAC, electrical panel, plumbing, and water heater last replaced?
- Is there a deadline driving the sale (1031 exchange, divorce, estate, relocation)? That informs how much negotiation room exists.
- Crime grade is F in this area — have there been break-ins, vandalism, or insurance claims at this property in the last 3 years? What carrier currently insures it and at what premium?
- What's the average days-on-market for RENTAL listings here right now (not sales)? A rising rental-DOM trend means longer vacancies and softer asking-rent achievability than the comps imply.
- What's the recent tenant-quality profile in this submarket — average credit score on applications, eviction rate, late-payment / NSF rate, and stable-employment percentage? A property-management company in the area should have these aggregated.
- How much new for-sale + rental construction is in the pipeline within 1–3 miles? Heavy new supply typically softens prices + rents 12–24 months out; constrained supply supports both.
Investment metrics
- 1% rule
- 1.16% ✓
- Cap rate
- 8.25%
- Cash-on-cash
- 7.00%
- DSCR
- 1.31
- GRM
- 7.2
CMA / ARV
- ARV (on-the-fly)
- $241,150
- Comps found
- 12
Show comp detail 12 sales within ~0.75 mi
| Address | Dist | Beds/Ba | Sqft | Sold | Price | $/sf | Match |
|---|---|---|---|---|---|---|---|
| 1210 S Walters | 0.17mi | 3/1.0 | 1,203 (-13%) | 2mo | $75,000 | $62 | 70 |
| 119 J | 0.27mi | 4/2.0 (+1) | 1,452 (+5%) | 2mo | $80,500 | $55 | 68 |
| 1109 Essex | 0.21mi | 3/2.0 | 1,226 (-11%) | 3mo | $160,000 | $131 | 65 |
| 139 Reichert St | 0.48mi | 3/2.0 | 1,447 (+5%) | 2mo | $260,000 | $180 | 64 |
| 147 Vine St | 0.38mi | 3/2.5 | 1,438 (+4%) | 6mo | $230,000 | $160 | 64 |
| 1411 E Highland Blvd | 0.59mi | 2/1.0 (-1) | 1,407 (+2%) | 4mo | $215,000 | $153 | 61 |
| 1307 Kayton Ave | 0.60mi | 3/2.0 | 1,287 (-7%) | 1mo | $225,000 | $175 | 56 |
| 1144 Rigsby | 0.50mi | 3/2.0 | 1,496 (+9%) | 4mo | $295,000 | $197 | 55 |
| 219 Nelson Ave | 0.68mi | 4/2.0 (+1) | 1,424 (+3%) | 4mo | $249,000 | $175 | 50 |
| 231 Nelson | 0.66mi | 3/2.0 | 1,228 (-11%) | 3mo | $243,900 | $199 | 45 |
| 923. Saint Anthony | 0.66mi | 2/3.0 (-1) | 1,536 (+12%) | 1mo | $134,900 | $88 | 37 |
| 229 Nelson Ave | 0.66mi | 2/2.0 (-1) | 1,200 (-13%) | 3mo | $275,000 | $229 | 36 |
Match score weights: distance 35% · size 25% · config 20% · recency 20%. Top-matched comps best support the ARV.
Projected returns pro-forma
-3.0% appreciation · 1.07% rent growth · sell at horizon
- IRR
- -7.9%
- Equity multiple
- 0.72×
- Total profit
- $-10,748
- Equity at exit
- $20,129
- IRR
- -1.2%
- Equity multiple
- 0.93×
- Total profit
- $-2,769
- Equity at exit
- $11,672
Cash invested: $37,800 (down + closing). Projections, not guarantees.
Landlord ↔ Tenant lean methodology
- Overall (STATE)
- 87 Strongly Landlord-Friendly
- State Texas
- 87 Strongly Landlord-Friendly · R+5
- County
- — inherits STATE
- City
- — inherits STATE
ZIP-level market 78210
- Rents YoY
- 1.1%
- Active inventory
- 269
- Price-to-rent
- 7.2×
Monthly cashflow live
- Estimated rent
- $1,569 high interval (Pro) →
- Mortgage (P&I)
- −$708
- Tax from tax record
- −$255 /mo · $3,057/yr
- Insurance
- −$56
- HOA
- −$0
- Vacancy / Maint / Mgmt
- −$329
- Net cashflow
- $220
Break-even live
UW: 25.0% down · 7.5% · 30yr · 1.5% tax · 5.0% vac · 8.0% maint · 8.0% mgmt
Financing live
Cash to close
- Down payment
- $33,750
- Closing costs
- $4,050
- Reserves months
- —
- Total cash needed
- —
Loan-product check · same deal, 3 products live
Conventional
25% down · 7.5% · 30yr
- Down + closing
- —
- Monthly P&I
- —
- Monthly cashflow
- —
- DSCR
- —
- Eligible?
- —
Personal DTI + credit; lowest rate.
DSCR
20% down · 8.5% · 30yr
- Down + closing
- —
- Monthly P&I
- —
- Monthly cashflow
- —
- DSCR
- —
- Eligible?
- —
No personal income docs; deal must DSCR.
Hard money
10% down · 12.0% · 12mo
- Down + closing
- —
- Monthly P&I
- —
- Monthly cashflow
- —
- DSCR
- —
- Eligible?
- —
Short-term bridge; refi at stabilization.
Rent comps 40 comps
| Address | Beds | Baths | Sqft | Rent | $/sqft | DOM | Units | Dist |
|---|---|---|---|---|---|---|---|---|
| 215 San Salvador Ave Unit 101 San Antonio, TX | 3.0 | 2.5 | 1783 | $1,595 | $0.89 | 4d | 1 | 0.06mi |
| 1518 S Walters St Unit 102 San Antonio, TX | 3.0 | 2.5 | 1180 | $1,400 | $1.19 | 4d | 1 | 0.08mi |
| 1303 Essex St #102 San Antonio, TX | 3.0 | 2.5 | 1180 | $1,400 | $1.19 | 23d | 1 | 0.09mi |
| 313 San Salvador Ave San Antonio, TX | 4.0 | 2.5 | 1240 | $1,395 | $1.12 | 43d | 1 | 0.09mi |
| 307 San Salvador Ave Unit 101 San Antonio, TX | 3.0 | 2.5 | 1783 | $1,595 | $0.89 | 4d | 1 | 0.10mi |
| 139 San Salvador Ave Unit 103 San Antonio, TX | 2.0 | 2.5 | 1245 | $1,490 | $1.20 | 14d | 1 | 0.12mi |
| 512 Cooper St San Antonio, TX | 2.0 | 1.0 | 1116 | $1,295 | $1.16 | 23d | 1 | 0.20mi |
| 322 Vine St #102 San Antonio, TX | 3.0 | 2.5 | 1401 | $1,400 | $1.00 | 23d | 1 | 0.25mi |
| 242 Vine St San Antonio, TX | 4.0 | 2.0 | 1250 | $1,695 | $1.36 | 43d | 1 | 0.28mi |
| 1431 Aransas Ave San Antonio, TX | 3.0 | 1.0 | 1108 | $1,195 | $1.08 | 14d | 1 | 0.35mi |
| 147 Vine St San Antonio, TX | 3.0 | 3.0 | 1438 | $1,700 | $1.18 | 23d | 1 | 0.39mi |
| 214 Nopal St Unit 201 San Antonio, TX | 4.0 | 2.0 | 1170 | $1,500 | $1.28 | 43d | 1 | 0.39mi |
| 302 Cooper St Unit 201 San Antonio, TX | 4.0 | 2.0 | 1170 | $1,500 | $1.28 | 4d | 1 | 0.40mi |
| 302 Cooper St Unit 201 San Antonio, TX | 4.0 | 2.0 | 1170 | $1,500 | $1.28 | 43d | 1 | 0.40mi |
| 838 Hammond Ave San Antonio, TX | 2.0 | 1.0 | 888 | $1,300 | $1.46 | 43d | 1 | 0.48mi |
| 212 Cooper St Unit A San Antonio, TX | 3.0 | 3.0 | 1750 | $1,625 | $0.93 | 43d | 1 | 0.49mi |
| 212 Cooper St Unit A San Antonio, TX | 3.0 | 3.0 | 1750 | $1,550 | $0.89 | 23d | 1 | 0.49mi |
| 1303 Rigsby Ave Unit 710 San Antonio, TX | 2.0 | 2.0 | 950 | $1,173 | $1.23 | 2d | 1 | 0.50mi |
| 318 Ferguson Ave Unit 1 San Antonio, TX | 3.0 | 2.0 | 1450 | $1,550 | $1.07 | 4d | 1 | 0.53mi |
| 343 Porter St #101 San Antonio, TX | 3.0 | 2.5 | 1600 | $2,100 | $1.31 | 4d | 1 | 0.64mi |
| 1007 Avant Ave San Antonio, TX | 3.0 | 2.0 | 1632 | $3,200 | $1.96 | 23d | 1 | 0.65mi |
| 113 Anderson Ave Unit 101 San Antonio, TX | 3.0 | 2.5 | 1539 | $1,700 | $1.10 | 43d | 1 | 0.66mi |
| 123 Dilworth St San Antonio, TX | 3.0 | 2.0 | 1384 | $1,900 | $1.37 | 43d | 1 | 0.66mi |
| 113 Dilworth St San Antonio, TX | 3.0 | 3.0 | 1383 | $1,850 | $1.34 | 23d | 1 | 0.67mi |
| 636 Rigsby Ave San Antonio, TX | 3.0 | 1.0 | 1327 | $1,595 | $1.20 | 43d | 1 | 0.70mi |
| 143 Ranger Unit 101 San Antonio, TX | 3.0 | 2.0 | 876 | $1,099 | $1.25 | 1d | 1 | 0.71mi |
| 136 Nelson Ave San Antonio, TX | 3.0 | 1.0 | 1092 | $1,316 | $1.21 | 43d | 1 | 0.74mi |
| 918 Hampton St Unit 1 San Antonio, TX | 3.0 | 1.0 | 912 | $975 | $1.07 | 43d | 1 | 0.75mi |
| 2346 Dakota St Unit 1101 San Antonio, TX | 2.0 | 1.0 | 1728 | $1,250 | $0.72 | 16d | 1 | 0.75mi |
| 2219 S New Braunfels Ave San Antonio, TX | 2.0 | 1.0 | 952 | $1,050 | $1.10 | 23d | 1 | 0.76mi |
| 521 S Polaris St San Antonio, TX | 3.0 | 1.0 | 1200 | $1,249 | $1.04 | 4d | 1 | 0.79mi |
| 314 Maryland St Unit 102 San Antonio, TX | 2.0 | 2.5 | 1055 | $1,295 | $1.23 | 43d | 1 | 0.80mi |
| 1138 Iowa St San Antonio, TX | 3.0 | 2.0 | 1505 | $1,650 | $1.10 | 23d | 1 | 0.80mi |
| 534 Rigsby Ave San Antonio, TX | 3.0 | 2.0 | 1438 | $1,950 | $1.36 | 23d | 1 | 0.81mi |
| 1627 Schley Ave San Antonio, TX | 3.0 | 1.0 | 1408 | $1,650 | $1.17 | 23d | 1 | 0.83mi |
| 627 Essex St San Antonio, TX | 3.0 | 2.5 | 1402 | $1,850 | $1.32 | 23d | 1 | 0.83mi |
| 1618 Dakota St Unit 102 San Antonio, TX | 3.0 | 2.5 | 1768 | $1,925 | $1.09 | 16d | 1 | 0.83mi |
| 1811 McKinley Ave San Antonio, TX | 2.0 | 2.0 | 1248 | $975 | $0.78 | 2d | 1 | 0.83mi |
| 2107 Schley Ave San Antonio, TX | 3.0 | 2.5 | 1568 | $2,200 | $1.40 | 43d | 1 | 0.84mi |
| 104 Shenandoah San Antonio, TX | 3.0 | 2.5 | 1580 | $1,925 | $1.22 | 17d | 1 | 0.87mi |
Listing history 14 events
-
2026-06-18days on market $135,000 Active 24 DOM
-
2026-06-17days on market $135,000 Active 23 DOM
-
2026-06-16days on market $135,000 Active 22 DOM
-
2026-06-15days on market $135,000 Active 21 DOM
-
2026-06-13days on market $135,000 Active 19 DOM
-
2026-06-09days on market $135,000 Active 15 DOM
-
2026-06-08days on market $135,000 Active 14 DOM
-
2026-06-07statusdays on market $135,000 Active 13 DOM
-
2026-06-04days on market $135,000 New 10 DOM
-
2026-06-03days on market $135,000 New 9 DOM
-
2026-06-02days on market $135,000 New 8 DOM
-
2026-06-01days on market $135,000 New 7 DOM
-
2026-05-31days on market $135,000 New 6 DOM
-
2026-05-25$135,000 New
ⓘ Source: listings_history table (triggers on properties + properties_extension) + one-shot
backfill from property_details.listing_events for pre-trigger history.
Tax reassessment forecast TX · Resets to sale price
- Current annual tax
- $3,057 · $255/mo
- Projected year-2 tax
- $3,057 · $255/mo
- Expected delta
- $0/yr ($0/mo · 0.0%)
ⓘ Screening estimate from a state-policy table — verify with the county assessor before closing.
Climate risk First Street
- Flood 1/10 Low FEMA zone X (unshaded) · 0% chance over 30 yrs
- Wildfire 1/10 Low
- Heat 8/10 Severe 7 d/yr ≥108°F today · 21 d/yr by 30 yrs out
- Wind 8/10 Severe 80% chance of damaging wind over 30 yrs
- Air quality 2/10 Low 1 unhealthy d/yr today · 2 by 30 yrs out
Nearby sold comps map
Loading sold comps map…
Walkable amenities ~0.75 mi
Loading nearby amenities…
Taxation est. · year 1
- Rental income
- $18,827
- − Mortgage interest
- −$7,562
- − Property taxes
- −$3,057
- − Insurance
- −$675
- − Repairs & maintenance
- −$1,506
- − Management
- −$1,506
- − Depreciation
- −$3,927
- Taxable income
- $593
- Est. tax owed @ 24.0%
- −$142
- After-tax cash flow
- $2,503/yr
For passive investors: Depreciation is non-cash, so a rental often shows a tax loss while cash-flowing — sheltering income. Rental losses are passive: they offset passive income freely, and up to $25,000/yr can offset ordinary (W-2) income if you actively participate and your MAGI is under $100k (phasing out to $0 by $150k); unused losses carry forward. On sale, claimed depreciation is recaptured at up to 25%, and gains may owe capital-gains tax (a 1031 exchange can defer both). Figures are a year-1 estimate at your 24.0% rate — not tax advice; consult a CPA.
Schools (NCES district)
- District
- San Antonio ISD
- NCES district ID
- 4838730
- Math proficiency
- 12% ▼ -21.00%
- Reading proficiency
- 22% ▼ -7.00%
- Median HH income
- $30,952
- Composite
- 13.57/100
- National rank
- #9512
- State rank
- #805 of 826 in TX
Livability — San Antonio
- Score
- 80/100
- State rank
- #31
- US rank
- #1616
Category grades
Schools grade is shown separately in the Schools card above.
Census & demographics
- Census place
- San Antonio, TX
- County
- Bexar County · 1,990,555 people
- City population
- 1,806,925
- Metro
- San Antonio-New Braunfels, TX
- Population (ZIP)
- 34,940
- Household income
- $55,028
- Rent vs Own
- Severe rent burden
- 1708.0
Population outlook (Bexar County) Hauer SSP2
- Today (2025)
- 2,336,851 people
- By 2030
- 2,560,728 · +9.6%
- By 2040
- 3,020,569 · +29.3%
- By 2050
- 3,493,522 · +49.5%
- By 2075
- 4,668,459 · +99.8%
- By 2100
- 5,533,242 · +136.8%
Race, ethnicity, and origin ACS 2023
- Neighborhood character
- Predominantly Hispanic (83%)
- Race & ethnicity
- Hispanic / Latino 83% Two or more races 29% White 11% Black 4% Native American 2%
- Hispanic origin (detail)
- Mexican 72% Puerto Rican 2%
- Common ancestry
- Lithuanian 1%
- Foreign-born
- 12% · Canada
- Languages at home
- 55% English-only · Spanish 44%
Political lean MEDSL · Bexar
- 2024 margin
- Lean D (+9.8) · D 54.3% · R 44.6% · Other 1.1%
- 2008→2024 swing
- +4.2pp toward D · 2008: 5.6pp · 2024: 9.8pp
- All cycles
- 2024: D+9.8 2020: D+18.2 2016: D+13.5 2012: D+4.6 2008: D+5.6
Not yet ingested
- Civics
- —
Market trends
- HPI YoY
- ▼ -163.42%
- Current HPI
- 286.299
- Rent YoY
- ▲ 1.07%
- Metro
- San Antonio-New Braunfels, TX
- State GDP YoY
- ▲ 3.95%
- F500 in state
- 110
Industry mix (Fortune 500 HQ in TX)
| Industry | F500 HQs | Revenue |
|---|---|---|
| Energy | 16 | $1,198B |
|
||
| Technology | 5 | $198B |
|
||
| Engineering / Construction | 4 | $72B |
|
||
| Energy Services | 3 | $60B |
|
||
| Utilities | 3 | $41B |
|
||
| Healthcare | 2 | $330B |
|
||
Price history
1 event — show timeline
- 2026-05-25 Listed $135,000 LERA
Property tax history
+5.5%/yrLatest (2025): $3,057 · +10.0% YoY. Source: county tax records.
Cash-flow waterfall
monthlySold comps — $/sqft
last 12 mo · ≤1 miLoading sold comps…