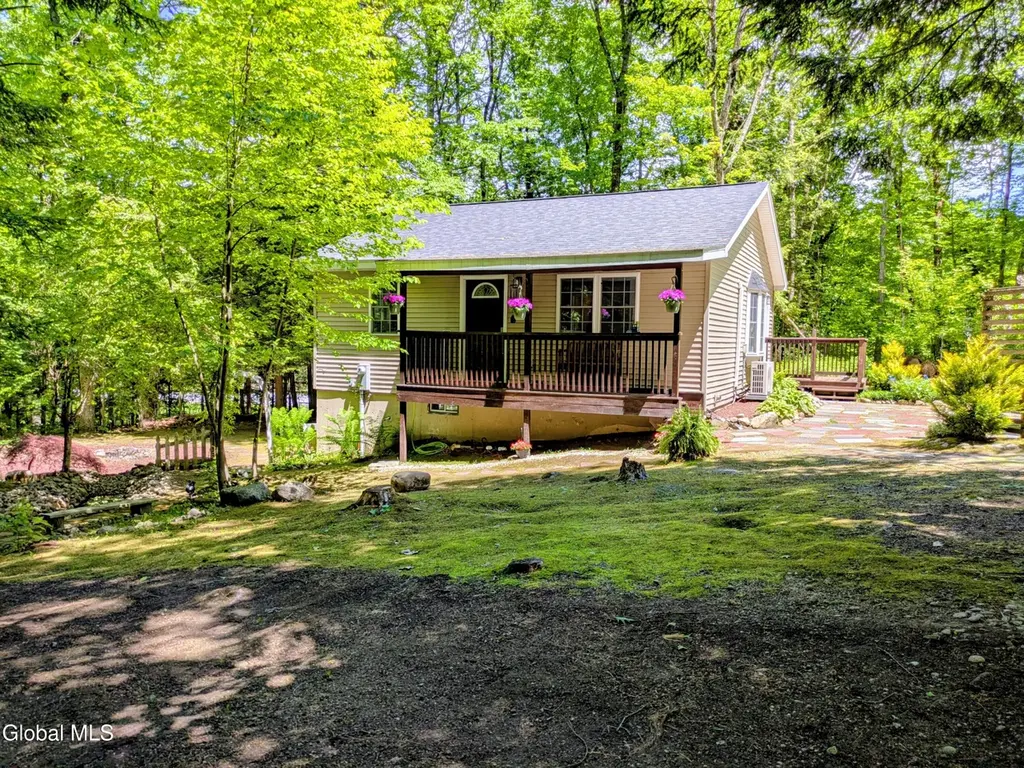
606 Goggins Rd · Lake George, NY
Flood risk 1/10 · Minimal
- FEMA flood zone
- —
- Chance of flooding over 30 yrs
- 0.0%
- Est. flood insurance / yr
- —
Fire risk 3/10 · Minor
- Est. fire insurance / yr
- $691 – $1,283
Heat risk 2/10 · Minimal
- Hot days now (above 94°F)
- 7 days/yr
- Hot days in 30 yrs
- 17 days/yr
Wind risk 2/10 · Minimal
- Chance of severe wind over 30 yrs
- 2.0%
Air-quality risk 1/10 · Minimal
- Unhealthy air days now
- 0 days/yr
- Unhealthy air days in 30 yrs
- 0 days/yr
Risk factors via First Street. Map © Google.
Why this score? — see what drove the C- grade
The composite is a weighted blend of 9 inputs, each scored 0–100. Each bar is that input's sub-score; the figure is the points it added to the 100-point composite (weight × sub-score).
- Cash flow +14.6/30.0
- Appreciation +10.0/10.0
- ARV discount +7.5/15.0
- Schools +6.1/10.0
- DSCR +4.4/10.0
- 1% rule +3.2/10.0
- Livability +3.2/5.0
- Rent growth +2.5/5.0
- Condition / age +2.5/5.0
$299,500
🖨 Deal sheet 📄 Offer letter ✓ Due diligence
Listing remarks MLS
You are not going to want to miss this charming Lake George home just 5 minutes from Million Dollar Beach & all of the shops, boutiques, restaurants in the village of Lake George AND several boat rentals/docks on the south end of Lake George!! Also just a few minutes off of the Northway for easy commuting AND only 20 minutes from Bolton Landing! This cute and cozy cottage is the perfect year round home or a fantastic opportunity as an Airbnb/short term rental investment (5 minutes to Lake George!!). Interior includes beautiful flooring, newer appliances and gorgeous paint!! Low maintenance pond right in your own yard with a firepit! Hurry & schedule your showing while you still can!
Key facts
- Covered front porch
- Firepit area
- Tree fort
Tags
Property features AI
Finance
- Other: Lot approximately 0.94 acre
Exterior
- Parking: Five parking spaces; Stone driveway
- Security: Smoke detectors; Carbon monoxide detectors
- Utilities: 150 Amp electric service with circuit breakers; Septic tank
- Home design: Single family residence; Updated/remodeled; Concrete perimeter foundation; Vinyl siding; Shingle/asphalt roof; House set back from road
- Construction: Vinyl siding construction; Shingle/asphalt roof; Concrete perimeter foundation
- Exterior features: Front porch; Side covered porch; Deck; Patio; Lighting; Shed(s); Landscaped, private wooded lot (irregular shape)
Interior
- Kitchen: Electric oven; Oven; Refrigerator
- Bedrooms: Primary bedroom on first floor (approx. 13'4" x 11'); Additional bedroom on first floor (approx. 8'6" x 11'); Basement office also used as guest room (sliding door to yard)
- Flooring: Ceramic tile; Laminate
- Bathrooms: One full bathroom on first floor
- Heating & cooling: Baseboard heating; Heat pump; Hot water heating; Propane heating; AC pump (ductless)
- Interior features: Paddle fan; Sliding doors; Bay windows; Double-pane windows; Finished, heated full basement with interior and exterior entry; 8 total rooms
- Laundry & utility: Washer; Dryer; Electric dryer hookup in basement; Basement utility room with laundry, storage, boiler and hot water heater
Neighborhood map
What this means for you Summary
Snapshot
- This is a 2-bed/1.0-bath single-family listed at $300k.
Deal economics
- At list price, monthly cash flow is $70 ($844/yr) — positive.
- The deal already cash-flows at list — no discount required.
- To meet the 1% rule (rent ≥ 1% of price), the offer needs to be $247k (17.5% below list).
- Recommended offer: $247k (17.5% below list) — sets the bar for 1% rule.
- Cap rate 6.6% vs local median 2.8% in Lake George — top-decile yield for the area; either an underpriced asset or a hidden risk that comps aren't pricing in. Stress-test before assuming the spread holds.
Location & tenants
- Location reads 63/100 on livability (#788 in NY) — a middle-class / working-renter tenant base. Watch: employment C-, cost of living D+, crime D.
- Lake George Central School District (rural): math 68% / reading 73% proficiency, ranked #131 of 590 in NY (top 22%) — strong family-tenant draw, lease renewals of 3-5y typical; only 17% free/reduced lunch — higher-income household profile.
- Zoned schools: Lake George Elementary School (math 62% / reading 82%, grade A-, #378 of 2,108 statewide, top 20%, 300 students, 24% FRL); Lake George Junior-Senior High School (math 72% / reading 62%, grade B, #746 of 1,100 statewide, top 69%, 330 students, 19% FRL) — zoned schools at 22% FRL track the district average.
- Market conditions: 110 active listings in the ZIP; 180 units permitted in Warren County in 2024 (40 in 5+ unit buildings).
Forward outlook
- In year one you build about $32k of equity ($2k loan paydown + $30k appreciation (10.0% local appreciation)).
- Warren County population projected at -19% by 2050 — secular population decline; favor cash flow + early exit over multi-decade hold.
- At projected returns (10.0% appreciation + 3.0% rent growth), your $84k cash investment doubles in ~3 years — after that, you're playing with house money.
- By year 2, paydown + projected appreciation supports a ~$51k cash-out refi (75% LTV) — recoverable capital for the next deal without selling this one.
Negotiation context
- Only 13 days on market — expect competitive offers; lowballing is unlikely to land.
- 6 sale attempts since 19y ago with the ask held roughly flat each time — persistent listings suggest the price (not the market) is what's stuck; bring a comps-based counter.
Questions for the listing agent
- Is there a deadline driving the sale (1031 exchange, divorce, estate, relocation)? That informs how much negotiation room exists.
- Schools are B-rated — typically a magnet for longer-tenancy family renters. What's the average tenant stay here, and is there a school-zone premium baked into asking?
- Crime grade is D in this area — have there been break-ins, vandalism, or insurance claims at this property in the last 3 years? What carrier currently insures it and at what premium?
- What's the average days-on-market for RENTAL listings here right now (not sales)? A rising rental-DOM trend means longer vacancies and softer asking-rent achievability than the comps imply.
- What's the recent tenant-quality profile in this submarket — average credit score on applications, eviction rate, late-payment / NSF rate, and stable-employment percentage? A property-management company in the area should have these aggregated.
- How much new for-sale + rental construction is in the pipeline within 1–3 miles? Heavy new supply typically softens prices + rents 12–24 months out; constrained supply supports both.
Investment metrics
- 1% rule
- 0.82% ✗
- Cap rate
- 6.57%
- Cash-on-cash
- 1.01%
- DSCR
- 1.04
- GRM
- 10.1
CMA / ARV
No comps found within radius.
Projected returns pro-forma
10.0% appreciation · 3.0% rent growth · sell at horizon
- IRR
- 25.0%
- Equity multiple
- 3.00×
- Total profit
- $167,516
- Equity at exit
- $269,813
- IRR
- 22.0%
- Equity multiple
- 6.84×
- Total profit
- $489,628
- Equity at exit
- $581,863
Cash invested: $83,860 (down + closing). Projections, not guarantees.
Landlord ↔ Tenant lean methodology
- Overall (STATE)
- 15 Strongly Tenant-Friendly
- State New York
- 15 Strongly Tenant-Friendly · D+10
- County
- — inherits STATE
- City
- — inherits STATE
ZIP-level market 12845
- Home prices YoY
- 3.5%
- Active inventory
- 110
- Price-to-rent
- 10.1×
Monthly cashflow live
- Estimated rent
- $2,471 medium interval (Pro) →
- Mortgage (P&I)
- −$1,571
- Tax from tax record
- −$186 /mo · $2,232/yr
- Insurance
- −$125
- HOA
- −$0
- Vacancy / Maint / Mgmt
- −$519
- Net cashflow
- $70
Break-even live
UW: 25.0% down · 7.5% · 30yr · 1.5% tax · 5.0% vac · 8.0% maint · 8.0% mgmt
Financing live
Cash to close
- Down payment
- $74,875
- Closing costs
- $8,985
- Reserves months
- —
- Total cash needed
- —
Loan-product check · same deal, 3 products live
Conventional
25% down · 7.5% · 30yr
- Down + closing
- —
- Monthly P&I
- —
- Monthly cashflow
- —
- DSCR
- —
- Eligible?
- —
Personal DTI + credit; lowest rate.
DSCR
20% down · 8.5% · 30yr
- Down + closing
- —
- Monthly P&I
- —
- Monthly cashflow
- —
- DSCR
- —
- Eligible?
- —
No personal income docs; deal must DSCR.
Hard money
10% down · 12.0% · 12mo
- Down + closing
- —
- Monthly P&I
- —
- Monthly cashflow
- —
- DSCR
- —
- Eligible?
- —
Short-term bridge; refi at stabilization.
Listing history 10 events
-
2026-06-15statusdays on market $299,500 Pending 13 DOM
-
2026-06-13days on market $299,500 Active 12 DOM
-
2026-06-12days on market $299,500 Active 11 DOM
-
2026-06-09days on market $299,500 Active 8 DOM
-
2026-06-08days on market $299,500 Active 7 DOM
-
2026-06-07days on market $299,500 Active 6 DOM
-
2026-06-07days on market $299,500 Active 5 DOM
-
2026-06-04days on market $299,500 Active 2 DOM
-
2026-06-02remarks 699-char remark
-
2026-06-02$299,500 Active 1 DOM
ⓘ Source: listings_history table (triggers on properties + properties_extension) + one-shot
backfill from property_details.listing_events for pre-trigger history.
Tax reassessment forecast NY · Partial reset (capped growth)
- Current annual tax
- $2,232 · $186/mo
- Projected year-2 tax
- $3,647 · $304/mo
- Expected delta
- +$1,415/yr (+$118/mo · 63.4%)
ⓘ Screening estimate from a state-policy table — verify with the county assessor before closing.
Climate risk First Street
- Flood 1/10 Low 0% chance over 30 yrs
- Wildfire 3/10 Moderate
- Heat 2/10 Low 7 d/yr ≥94°F today · 17 d/yr by 30 yrs out
- Wind 2/10 Low 2% chance of damaging wind over 30 yrs
- Air quality 1/10 Low 0 unhealthy d/yr today · 0 by 30 yrs out
Nearby sold comps map
Loading sold comps map…
Walkable amenities ~0.75 mi
Loading nearby amenities…
Taxation est. · year 1
- Rental income
- $29,647
- − Mortgage interest
- −$16,777
- − Property taxes
- −$2,232
- − Insurance
- −$1,498
- − Repairs & maintenance
- −$2,372
- − Management
- −$2,372
- − Depreciation
- −$8,713
- Taxable loss
- −$4,316
- Est. tax savings @ 24.0%
- +$1,036
- After-tax cash flow
- $1,880/yr
For passive investors: Depreciation is non-cash, so a rental often shows a tax loss while cash-flowing — sheltering income. Rental losses are passive: they offset passive income freely, and up to $25,000/yr can offset ordinary (W-2) income if you actively participate and your MAGI is under $100k (phasing out to $0 by $150k); unused losses carry forward. On sale, claimed depreciation is recaptured at up to 25%, and gains may owe capital-gains tax (a 1031 exchange can defer both). Figures are a year-1 estimate at your 24.0% rate — not tax advice; consult a CPA.
Schools (NCES district)
- District
- Lake George Central School District
- NCES district ID
- 3616470
- Math proficiency
- 68% ▼ -8.00%
- Reading proficiency
- 73% ▲ 9.00%
- Median HH income
- $65,873
- Composite
- 61.29/100
- National rank
- #777
- State rank
- #131 of 590 in NY
Livability — Lake George
- Score
- 63/100
- State rank
- #788
- US rank
- #15111
Category grades
Schools grade is shown separately in the Schools card above.
Census & demographics
- Population (ZIP)
- 4,389
Population outlook (Warren County) Hauer SSP2
- Today (2025)
- 62,372 people
- By 2030
- 60,491 · -3.0%
- By 2040
- 55,616 · -10.8%
- By 2050
- 50,437 · -19.1%
- By 2075
- 40,843 · -34.5%
- By 2100
- 31,159 · -50.0%
Race, ethnicity, and origin ACS 2023
- Neighborhood character
- Predominantly White (92%)
- Race & ethnicity
- White 92% Hispanic / Latino 5% Two or more races 3% Black 1%
- Common ancestry
- Lithuanian 7% Italian 4% Iranian 3%
- Foreign-born
- 2% · Canada
- Languages at home
- 96% English-only · Spanish 2% French/Haitian/Cajun 1% Other Indo-European 1%
Political lean MEDSL · Warren
- 2024 margin
- Toss-up / Even · D 47.9% · R 52.1%
- 2008→2024 swing
- -6.9pp toward R · 2008: 2.6pp · 2024: -4.2pp
- All cycles
- 2024: R+4.2 2020: R+0.2 2016: R+10.6 2012: D+2.1 2008: D+2.6
Not yet ingested
- Civics
- —
Market trends
- HPI YoY
- ▲ 12.18%
- Current HPI
- 364.9782
- Rent YoY
- —
- Metro
- —
- State GDP YoY
- ▲ 2.60%
- F500 in state
- 92
Industry mix (Fortune 500 HQ in NY)
| Industry | F500 HQs | Revenue |
|---|---|---|
| Financial Services | 10 | $950B |
|
||
| Consumer Goods | 9 | $162B |
|
||
| Insurance | 4 | $225B |
|
||
| Telecommunications | 2 | $144B |
|
||
| Pharmaceuticals | 2 | $112B |
|
||
| Media / Entertainment | 2 | $69B |
|
||
Price history
+71.2% since first listed15 events — show timeline
- 2026-06-01 Listed $299,500 Global MLS
- 2022-05-27 Sold (Public Records) $280,000 Public Records
- 2022-05-26 Sold (MLS) $280,000 Global MLS
- 2022-04-05 Pending — Global MLS
- 2022-04-01 Contingent — Global MLS
- 2022-03-23 Listed $274,900 Global MLS
- 2017-12-05 Sold (MLS) $159,900 Global MLS
- 2017-04-17 Listed $164,900 Global MLS
- 2017-04-15 Listing Removed — Global MLS
- 2016-10-15 Listed $174,900 Global MLS
- 2013-01-13 Listing Removed — Global MLS
- 2012-06-07 Listed $159,900 Global MLS
- 2007-09-17 Sold (Public Records) $145,000 Public Records
- 2007-09-16 Sold (MLS) $145,000 Global MLS
- 2007-03-29 Listed $174,900 Global MLS
Property tax history
+2.1%/yrLatest (2025): $2,232 · +11.6% YoY. Source: county tax records.
Cash-flow waterfall
monthlySold comps — $/sqft
last 12 mo · ≤1 miLoading sold comps…