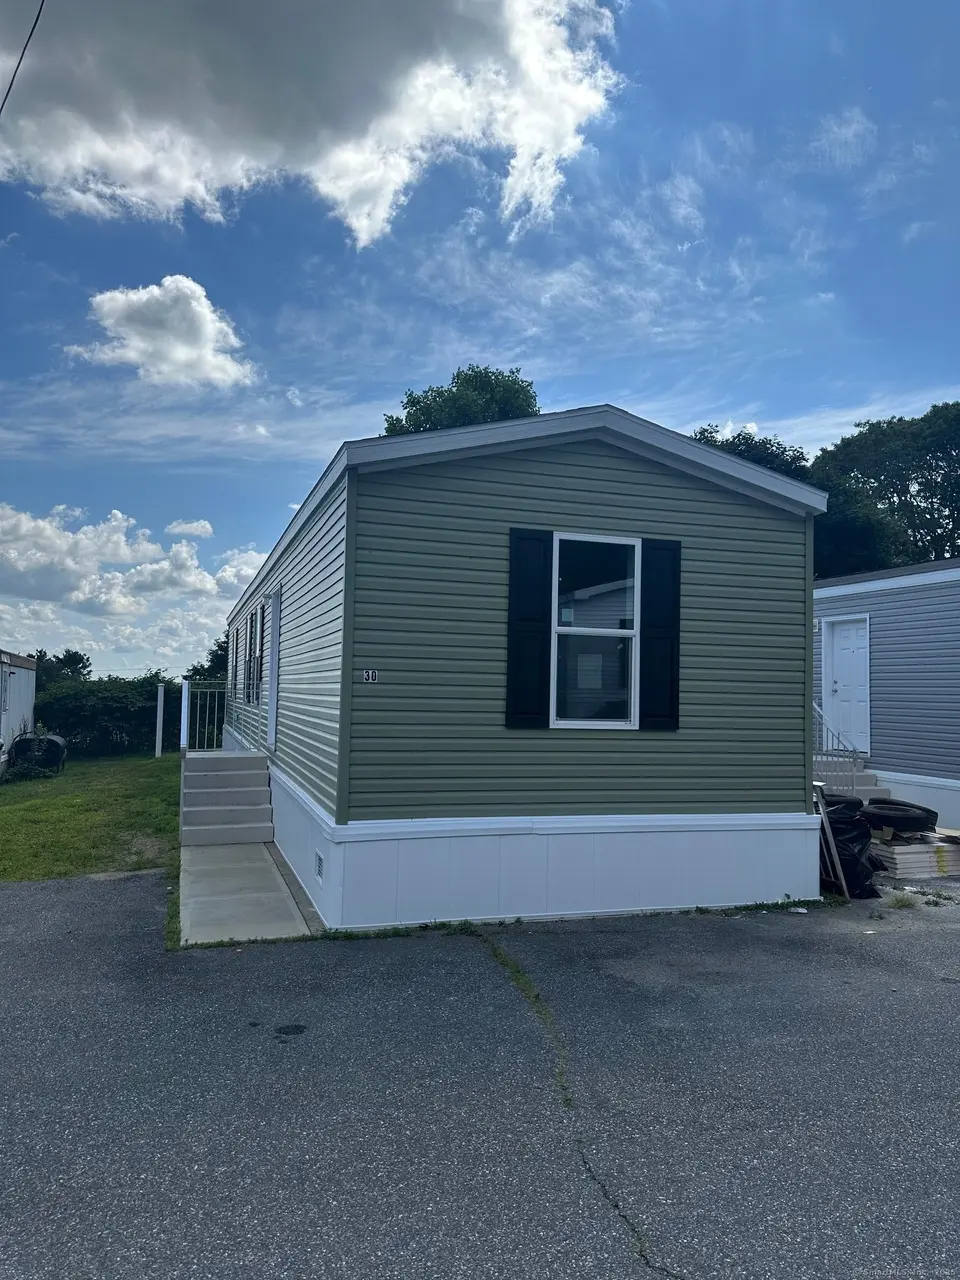
435 High St #30 · Mystic, CT
Flood risk No data
- FEMA flood zone
- —
- Chance of flooding over 30 yrs
- —
- Est. flood insurance / yr
- —
Fire risk No data
- Est. fire insurance / yr
- —
Heat risk No data
- Hot days now (above threshold)
- —
- Hot days in 30 yrs
- —
Wind risk No data
- Chance of severe wind over 30 yrs
- —
Air-quality risk No data
- Unhealthy air days now
- —
- Unhealthy air days in 30 yrs
- —
Risk factors via First Street. Map © Google.
Why this score? — see what drove the B- grade
The composite is a weighted blend of 9 inputs, each scored 0–100. Each bar is that input's sub-score; the figure is the points it added to the 100-point composite (weight × sub-score).
- Cash flow +24.9/30.0
- 1% rule +10.0/10.0
- ARV discount +8.6/15.0
- DSCR +8.1/10.0
- Livability +4.1/5.0
- Condition / age +4.0/5.0
- Schools +3.6/10.0
- Rent growth +2.5/5.0
- Appreciation +0.0/10.0
$135,000
🖨 Deal sheet (PDF) 📄 Offer letter ✓ Due diligence
Listing remarks MLS
New 2025 manufactured home in a mobile home community. Back patio to enjoy! Minutes from I95 and Downtown Mystic. Military/EB/Pfizer discounts available!
Key facts
- Minutes from i95
- Back patio
- 2,178 sq ft lot
Tags
Neighborhood map
What this means for you Summary
Snapshot
- This is a 2-bed/2.0-bath single-family listed at $135k. Condition is rated good.
Deal economics
- At list price, monthly cash flow is $291 ($3k/yr) — positive.
- The deal already cash-flows at list — no discount required.
- Meets the 1% rule at list price ($2k rent vs $135k).
- Recommended offer: $119k (12.0% below list) — sets the bar for market timing.
- Cap rate 8.9% vs local median 1.7% in Mystic — top-decile yield for the area; either an underpriced asset or a hidden risk that comps aren't pricing in. Stress-test before assuming the spread holds.
Location & tenants
- Location reads 82/100 on livability (#11 in CT, #1,266 nationally) — a professional / high-income tenant draw. Strengths: crime A+, employment A+, housing A+; Watch: commute F, cost of living F.
- Groton School District (suburban): math 32% / reading 50% proficiency, ranked #96 of 153 in CT (top 63%) — families likely to look elsewhere, expect single-tenant / working-renter base with shorter leases.
- Zoned schools: Northeast Academy Magnet School (math 42% / reading 62%, grade C-, #213 of 553 statewide, top 41%, 391 students, 27% FRL); Groton Middle School (math 28% / reading 47%, grade F, #112 of 175 statewide, top 66%, 907 students, 47% FRL); Robert E. Fitch High School (math 37% / reading 61%, grade D, #90 of 194 statewide, top 46%, 1,005 students, 43% FRL).
- Market conditions: 29 active listings in the ZIP; 8 comparable units currently listed for rent nearby; rentals at typical pace (median 23d on market — plan ~3-4 weeks tenant-placement turnaround); 487 units permitted in Southeastern Connecticut Planning Region in 2024 (244 in 5+ unit buildings).
Forward outlook
- Local home prices are declining (-3.0%/yr); year-one equity from $933 of loan paydown is wiped out by about $4k of value loss. Plan a longer hold.
Negotiation context
- It's been on market 239 days — a 12% lower offer ($119k) is reasonable based on typical stale-listing flexibility.
- 2 sale attempts with the ask held roughly flat each time — persistent listings suggest the price (not the market) is what's stuck; bring a comps-based counter.
Risks & watch-outs
- Watch-outs: HOA is 26% of rent.
Questions for the listing agent
- It's been on market 239 days. Have you received any prior offers? Is the seller open to a 12% concession, seller financing, or rate buy-down credit?
- What does the HOA fee cover, when was the last increase, and are there any pending special assessments or reserve-fund shortfalls?
- Why hasn't it sold? Are there any deal-killer items the seller is aware of (foundation, flood, title, zoning, code violations)?
- Is there a deadline driving the sale (1031 exchange, divorce, estate, relocation)? That informs how much negotiation room exists.
- Schools are A-rated — typically a magnet for longer-tenancy family renters. What's the average tenant stay here, and is there a school-zone premium baked into asking?
- What's the average days-on-market for RENTAL listings here right now (not sales)? A rising rental-DOM trend means longer vacancies and softer asking-rent achievability than the comps imply.
- What's the recent tenant-quality profile in this submarket — average credit score on applications, eviction rate, late-payment / NSF rate, and stable-employment percentage? A property-management company in the area should have these aggregated.
- How much new for-sale + rental construction is in the pipeline within 1–3 miles? Heavy new supply typically softens prices + rents 12–24 months out; constrained supply supports both.
Investment metrics
- 1% rule
- 1.71% ✓
- Cap rate
- 8.88%
- Cash-on-cash
- 9.25%
- DSCR
- 1.41
- GRM
- 4.9
CMA / ARV
- ARV (median comp)
- $138,517
- List price
- $135,000
- Delta
- -2.54%
- Verdict
- FAIR
- Comps
- 20 within 1.0 mi
Show comp detail 12 sales within ~0.75 mi
| Address | Dist | Beds/Ba | Sqft | Sold | Price | $/sf | Match |
|---|---|---|---|---|---|---|---|
| 435 High St #30 | 0.00mi | 2/2.0 | 840 (0%) | 0mo | $128,000 | $152 | 100 |
| 435 High St #31 | 0.03mi | 2/2.0 | 840 (0%) | 5mo | $130,000 | $155 | 94 |
| 435 High St #28 | 0.07mi | 2/2.0 | 840 (0%) | 9mo | $130,000 | $155 | 89 |
| 435 High St Lot 12 | 0.07mi | 2/2.0 | 924 (+10%) | 1mo | $150,000 | $162 | 80 |
| 435 High St #40 | 0.07mi | 2/2.0 | 924 (+10%) | 3mo | $130,000 | $141 | 78 |
| 435 High St #58 | 0.07mi | 2/2.0 | 924 (+10%) | 5mo | $150,000 | $162 | 76 |
| 435 High St #26 | 0.07mi | 2/2.0 | 924 (+10%) | 6mo | $130,000 | $141 | 75 |
| 435 High St Lot 4 | 0.07mi | 2/2.0 | 924 (+10%) | 7mo | $148,000 | $160 | 74 |
| 435 High St Lot 10 | 0.07mi | 2/2.0 | 924 (+10%) | 10mo | $90,000 | $97 | 71 |
| 214 Pequot Ave | 0.09mi | 2/1.0 | 768 (-9%) | 10mo | $331,000 | $431 | 69 |
| 435 High St #22 | 0.07mi | 2/2.0 | 924 (+10%) | 16mo | $122,000 | $132 | 66 |
| 62 W Main St | 0.60mi | 1/2.0 (-1) | 934 (+11%) | 0mo | $650,000 | $696 | 48 |
Match score weights: distance 35% · size 25% · config 20% · recency 20%. Top-matched comps best support the ARV.
Projected returns pro-forma
-3.0% appreciation · 3.0% rent growth · sell at horizon
- IRR
- -2.0%
- Equity multiple
- 0.92×
- Total profit
- $-2,918
- Equity at exit
- $20,129
- IRR
- 7.9%
- Equity multiple
- 1.61×
- Total profit
- $22,989
- Equity at exit
- $11,672
Cash invested: $37,800 (down + closing). Projections, not guarantees.
Landlord ↔ Tenant lean methodology
- Overall (STATE)
- 27 Tenant-Leaning
- State Connecticut
- 27 Tenant-Leaning · D+7
- County
- — inherits STATE
- City
- — inherits STATE
ZIP-level market 06335
- Home prices YoY
- -22.0%
- Active inventory
- 29
- Price-to-rent
- 4.9×
Monthly cashflow live
- Estimated rent
- $2,309 high interval (Pro) →
- Mortgage (P&I)
- −$708
- Tax est. 1.5%
- −$169 /mo · $2,025/yr
- Insurance
- −$56
- HOA
- −$600
- Vacancy / Maint / Mgmt
- −$485
- Net cashflow
- $291
Break-even live
Sensitivity live
| Price | -10% $385 | -5% $338 | +0% $291 | +5% $245 | +10% $198 |
|---|---|---|---|---|---|
| Rent | -10% $109 | -5% $200 | +0% $291 | +5% $383 | +10% $474 |
| Rate | -1.0pp $359 | -0.5pp $326 | base $291 | +0.5pp $256 | +1.0pp $221 |
UW: 25.0% down · 7.5% · 30yr · 1.5% tax · 5.0% vac · 8.0% maint · 8.0% mgmt
Financing live
Cash to close
- Down payment
- $33,750
- Closing costs
- $4,050
- Reserves months
- —
- Total cash needed
- —
Loan-product check · same deal, 3 products live
Conventional
25% down · 7.5% · 30yr
- Down + closing
- —
- Monthly P&I
- —
- Monthly cashflow
- —
- DSCR
- —
- Eligible?
- —
Personal DTI + credit; lowest rate.
DSCR
20% down · 8.5% · 30yr
- Down + closing
- —
- Monthly P&I
- —
- Monthly cashflow
- —
- DSCR
- —
- Eligible?
- —
No personal income docs; deal must DSCR.
Hard money
10% down · 12.0% · 12mo
- Down + closing
- —
- Monthly P&I
- —
- Monthly cashflow
- —
- DSCR
- —
- Eligible?
- —
Short-term bridge; refi at stabilization.
Rent comps 8 comps
| Address | Beds | Baths | Sqft | Rent | $/sqft | DOM | Units | Dist |
|---|---|---|---|---|---|---|---|---|
| 45 W Main St Unit 2 Mystic, CT | 2.0 | 1.0 | 900 | $2,295 | $2.55 | 15d | 1 | 0.62mi |
| 75 Steamboat Wharf Bldg Res-38 Mystic, CT | 1.0 | 1.0 | 775 | $1,890 | $2.44 | 15d | 1 | 0.65mi |
| 12 Water St Mystic, CT | 1.0–2.0 | 1.0–2.0 | 912 | $2,800 | $3.07 | 15d | 3 | 0.67mi |
| 12 Water St Unit 311 Mystic, CT | 1.0 | 1.0 | 750 | $2,500 | $3.33 | 15d | 1 | 0.67mi |
| 12 Water St Unit 408 Mystic, CT | 2.0 | 1.0 | 1075 | $2,800 | $2.60 | 23d | 1 | 0.69mi |
| 6 School St #20 Mystic, CT | 1.0 | 1.5 | 706 | $2,600 | $3.68 | 23d | 1 | 0.82mi |
| 2 Lincoln Ave Apt 3 Mystic, CT | 2.0 | 1.0 | 900 | $1,875 | $2.08 | 23d | 1 | 1.04mi |
| 454 Cow Hill Rd Unit 2 Mystic, CT | 2.0 | 1.0 | 900 | $1,250 | $1.39 | 46d | 1 | 1.26mi |
HOA detail
- Monthly dues
- $600 · $7,200/yr
Listing history 4 events
-
2026-05-13status Under Contract 153-char remark
Show marketing remark (153 chars)
New 2025 manufactured home in a mobile home community. Back patio to enjoy! Minutes from I95 and Downtown Mystic. Military/EB/Pfizer discounts available!
-
2026-04-02status Active 153-char remark
Show marketing remark (153 chars)
New 2025 manufactured home in a mobile home community. Back patio to enjoy! Minutes from I95 and Downtown Mystic. Military/EB/Pfizer discounts available!
-
2026-03-02status Under Contract 153-char remark
Show marketing remark (153 chars)
New 2025 manufactured home in a mobile home community. Back patio to enjoy! Minutes from I95 and Downtown Mystic. Military/EB/Pfizer discounts available!
-
2025-08-15$135,000 Active 153-char remark
Show marketing remark (153 chars)
New 2025 manufactured home in a mobile home community. Back patio to enjoy! Minutes from I95 and Downtown Mystic. Military/EB/Pfizer discounts available!
ⓘ Source: listings_history table (triggers on properties + properties_extension) + one-shot
backfill from property_details.listing_events for pre-trigger history.
Nearby sold comps map
Loading sold comps map…
Walkable amenities ~0.75 mi
Loading nearby amenities…
Taxation est. · year 1
- Rental income
- $27,710
- − Mortgage interest
- −$7,562
- − Property taxes
- −$2,025
- − Insurance
- −$675
- − Repairs & maintenance
- −$2,217
- − Management
- −$2,217
- − HOA
- −$7,200
- − Depreciation
- −$3,927
- Taxable income
- $1,887
- Est. tax owed @ 24.0%
- −$453
- After-tax cash flow
- $3,043/yr
For passive investors: Depreciation is non-cash, so a rental often shows a tax loss while cash-flowing — sheltering income. Rental losses are passive: they offset passive income freely, and up to $25,000/yr can offset ordinary (W-2) income if you actively participate and your MAGI is under $100k (phasing out to $0 by $150k); unused losses carry forward. On sale, claimed depreciation is recaptured at up to 25%, and gains may owe capital-gains tax (a 1031 exchange can defer both). Figures are a year-1 estimate at your 24.0% rate — not tax advice; consult a CPA.
Condition & rehab AI · 13 photos
This 2025 manufactured home in a mobile home community is in good condition with recent updates, making it a good investment opportunity.
Value-add opportunities
- Both Landscaping and curb appeal — Aesthetic improvements can enhance both resale and rental value
- Both Add a small deck or patio — Can increase living space and appeal to potential buyers/renters
Renovation cost estimate screening
Value-add ROI direction
- Both Landscaping and curb appeal — Aesthetic improvements can enhance both resale and rental value ↑
- Both Add a small deck or patio — Can increase living space and appeal to potential buyers/renters ↑
ⓘ Cost ranges are severity-bucket heuristics (US national rule-of-thumb). Get contractor quotes + a written scope before underwriting a rehab budget.
Schools (NCES district)
- District
- Groton School District
- NCES district ID
- 0901770
- Math proficiency
- 32% ▼ -16.00%
- Reading proficiency
- 50% ▼ -10.00%
- Median HH income
- $60,709
- Composite
- 36.28/100
- National rank
- #4702
- State rank
- #96 of 153 in CT
Livability — Mystic
- Score
- 82/100
- State rank
- #11
- US rank
- #1266
Category grades
Schools grade is shown separately in the Schools card above.
Census & demographics
- Population (ZIP)
- 6,100
Population outlook (Southeastern Connecticut County) Hauer SSP2
- By 2040
- 293,442
Race, ethnicity, and origin ACS 2023
- Neighborhood character
- Predominantly White (75%)
- Race & ethnicity
- White 75% Two or more races 11% Hispanic / Latino 8% Black 4% Asian 3%
- Hispanic origin (detail)
- Puerto Rican 4%
- Common ancestry
- Romanian 9% Lithuanian 7% Serbian 4%
- Foreign-born
- 5% · Canada, China, Jamaica
- Languages at home
- 94% English-only · Spanish 3% Chinese 1% French/Haitian/Cajun 1%
Political lean MEDSL · Southeastern Connecticut
- 2024 margin
- D (+13.0) · D 55.6% · R 42.6% · Other 1.8%
- All cycles
- 2024: D+13.0
Not yet ingested
- Civics
- —
Market trends
- HPI YoY
- ▼ -67.79%
- Current HPI
- 240.7698
- Rent YoY
- —
- Metro
- —
- State GDP YoY
- ▲ 1.06%
- F500 in state
- 38
Industry mix (Fortune 500 HQ in CT)
| Industry | F500 HQs | Revenue |
|---|---|---|
| Industrial Machinery | 4 | $38B |
|
||
| Insurance | 3 | $71B |
|
||
| Financial Services | 2 | $25B |
|
||
| Transportation / Logistics | 2 | $18B |
|
||
| Healthcare | 1 | $247B |
|
||
| Telecommunications | 1 | $55B |
|
||
Price history
4 events — show timeline
- 2026-05-13 Pending — Smart MLS
- 2026-04-02 Relisted — Smart MLS
- 2026-03-02 Pending — Smart MLS
- 2025-08-15 Listed $135,000 Smart MLS
Cash-flow waterfall
monthlySold comps — $/sqft
last 12 mo · ≤1 miLoading sold comps…