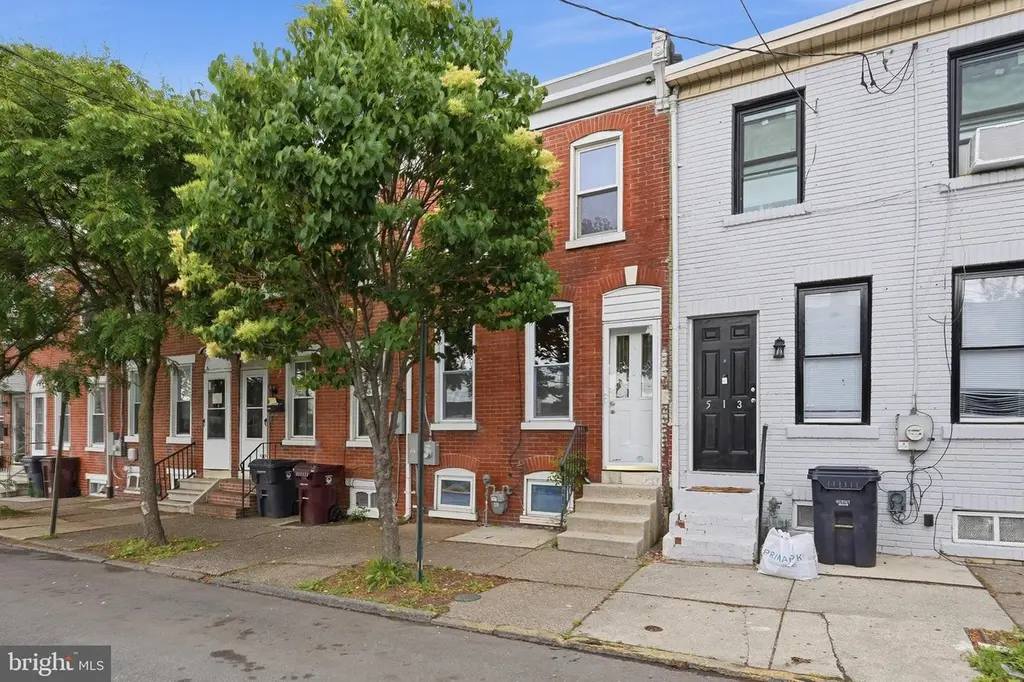
515 S Jackson St · Wilmington, DE
Flood risk 1/10 · Minimal
- FEMA flood zone
- X (unshaded)
- Chance of flooding over 30 yrs
- 0.0%
- Est. flood insurance / yr
- $473 – $860
Fire risk 1/10 · Minimal
- Est. fire insurance / yr
- $476 – $884
Heat risk 8/10 · Major
- Hot days now (above 103°F)
- 7 days/yr
- Hot days in 30 yrs
- 16 days/yr
Wind risk 6/10 · Moderate
- Chance of severe wind over 30 yrs
- 27.0%
Air-quality risk 3/10 · Minor
- Unhealthy air days now
- 3 days/yr
- Unhealthy air days in 30 yrs
- 4 days/yr
Risk factors via First Street. Map © Google.
Why this score? — see what drove the C grade
The composite is a weighted blend of 9 inputs, each scored 0–100. Each bar is that input's sub-score; the figure is the points it added to the 100-point composite (weight × sub-score).
- Cash flow +21.3/30.0
- ARV discount +15.0/15.0
- DSCR +6.8/10.0
- 1% rule +4.5/10.0
- Rent growth +4.1/5.0
- Livability +3.2/5.0
- Schools +2.5/10.0
- Condition / age +2.5/5.0
- Appreciation +0.0/10.0
$200,000
🖨 Deal sheet 📄 Offer letter ✓ Due diligence
Listing remarks
Welcome to this charming 3 bed, 1 bath interior row home nestled in the heart of Wilmington! Perfectly positioned for convenience, this home is just steps away from public transportation and offers quick access to I-95, making your daily commute a breeze. What truly sets this property apart is its unbeatable location—right across the street from the bustling Wilmington Riverfront. Imagine having some of the city's best shopping, dining, and entertainment options practically at your doorstep! Whether you're enjoying a stroll along the river, catching a show, or dining out, this home puts you in the center of it all. Affordable, accessible, and full of potential—this home is ready
Key facts
- Heart of wilmington
- Unbeatable location
- Quick access to i-95
Tags
Property features AI
Finance
- Other: Assessor lists year built and finished area; Above-grade finished area reported as 1,300
Exterior
- Parking: On-street parking
- Utilities: Public water; Public sewer; Electric cooling; Natural gas heating and hot water
- Home design: Interior townhouse/rowhouse; Fee simple ownership
- Construction: Brick construction; Brick/mortar foundation; Above-grade and below-grade structures
- Exterior features: Lot dimensions approximately 14 x 100; Property located within city limits; No tidal water
Interior
- Bedrooms: Three bedrooms on the first upper level
- Flooring: Hardwood
- Bathrooms: One full bathroom
- Heating & cooling: 90% forced air heating (natural gas); Central air conditioning (electric); Natural gas hot water
- Interior features: Hardwood floors throughout; Full basement
Neighborhood map
What this means for you Summary
Snapshot
- This is a 3-bed/1.0-bath townhouse listed at $200k.
Deal economics
- At list price, monthly cash flow is $291 ($3k/yr) — positive.
- The deal already cash-flows at list — no discount required.
- To meet the 1% rule (rent ≥ 1% of price), the offer needs to be $189k (5.3% below list).
- Recommended offer: $189k (5.3% below list) — sets the bar for 1% rule.
- Cap rate 8.0% vs local median 5.6% in Wilmington — top-decile yield for the area; either an underpriced asset or a hidden risk that comps aren't pricing in. Stress-test before assuming the spread holds.
Location & tenants
- Location reads 64/100 on livability (#52 in DE) — a middle-class / working-renter tenant base. Strengths: cost of living A+, housing A; Watch: employment D+, schools D, commute D.
- Christina School District (suburban): math 22% / reading 33% proficiency, ranked #18 of 26 in DE (top 69%) — low school quality limits family demand, transient renter base, plan for 1-2y turnover.
- Market conditions: Rents rising fast (+6.3%/yr); 167 active listings in the ZIP; 40 comparable units currently listed for rent nearby; rentals at typical pace (median 25d on market — plan ~3-4 weeks tenant-placement turnaround); 1,367 units permitted in New Castle County in 2024 (201 in 5+ unit buildings).
- This rent runs 38% of the median local income ($60k/yr) — at the standard rent-burdened threshold; future hikes will face affordability resistance.
Forward outlook
- Local home prices are declining (-3.0%/yr); year-one equity from $1k of loan paydown is wiped out by about $6k of value loss. Plan a longer hold.
- New Castle County population projected at +9% by 2050 — modest demand growth; plan on rents tracking national, not racing it.
- At projected returns (-3.0% appreciation + 6.3% rent growth), your $56k cash investment doubles in ~10 years — after that, you're playing with house money.
Negotiation context
- It's been on market 27 days — a 2% lower offer ($197k) is reasonable based on typical stale-listing flexibility.
Risks & watch-outs
- Watch-outs: built in 1900 — expect roof / HVAC / electrical / plumbing capex.
- Climate carrying-cost: major wind risk, 27% chance of damaging wind over 30y; extreme-heat days projected 7→16/yr by 2055 (HVAC capex compounding) — expect insurance premiums to compound above CPI over the hold.
Questions for the listing agent
- Built in 1900 — when were the roof, HVAC, electrical panel, plumbing, and water heater last replaced?
- Is there a deadline driving the sale (1031 exchange, divorce, estate, relocation)? That informs how much negotiation room exists.
- Schools are D-rated, which usually means shorter tenancies and higher turnover. Who's the typical renter profile here, and what's been the actual vacancy rate?
- Crime grade is F in this area — have there been break-ins, vandalism, or insurance claims at this property in the last 3 years? What carrier currently insures it and at what premium?
- What's the average days-on-market for RENTAL listings here right now (not sales)? A rising rental-DOM trend means longer vacancies and softer asking-rent achievability than the comps imply.
- What's the recent tenant-quality profile in this submarket — average credit score on applications, eviction rate, late-payment / NSF rate, and stable-employment percentage? A property-management company in the area should have these aggregated.
- How much new for-sale + rental construction is in the pipeline within 1–3 miles? Heavy new supply typically softens prices + rents 12–24 months out; constrained supply supports both.
Investment metrics
- 1% rule
- 0.95% ✗
- Cap rate
- 8.04%
- Cash-on-cash
- 6.24%
- DSCR
- 1.28
- GRM
- 8.8
CMA / ARV
- ARV (on-the-fly)
- $247,000
- Comps found
- 12
Show comp detail 12 sales within ~0.75 mi
| Address | Dist | Beds/Ba | Sqft | Sold | Price | $/sf | Match |
|---|---|---|---|---|---|---|---|
| 1210 Elm St | 0.19mi | 3/2.0 | 1,300 (0%) | 1mo | $200,000 | $154 | 86 |
| 519 S Jackson St | 0.00mi | 3/1.0 | 1,200 (-8%) | 1mo | $186,000 | $155 | 86 |
| 25 6th Ave | 0.36mi | 3/1.0 | 1,325 (+2%) | 1mo | $115,000 | $87 | 79 |
| 1204 Brown St | 0.42mi | 2/2.0 (-1) | 1,300 (0%) | 0mo | $268,000 | $206 | 71 |
| 1213 W 3rd St | 0.43mi | 3/1.5 | 1,250 (-4%) | 1mo | $215,000 | $172 | 70 |
| 302 S Franklin St | 0.22mi | 3/1.0 | 1,150 (-12%) | 1mo | $117,000 | $102 | 70 |
| 1715 Sycamore St | 0.55mi | 3/1.0 | 1,260 (-3%) | 1mo | $241,000 | $191 | 68 |
| 519 Lafayette Blvd | 0.48mi | 2/1.5 (-1) | 1,250 (-4%) | 0mo | $235,000 | $188 | 64 |
| 1301 Lancaster Ave | 0.34mi | 4/2.0 (+1) | 1,200 (-8%) | 1mo | $250,000 | $208 | 62 |
| 105-UNIT Christina Landing Dr #1108 | 0.60mi | 2/2.0 (-1) | 1,356 (+4%) | 1mo | $305,000 | $225 | 55 |
| 1016 Clayton Rd | 0.53mi | 3/1.0 | 1,150 (-12%) | 1mo | $219,000 | $190 | 55 |
| 105-UNIT Christina Landing Dr #406 | 0.60mi | 2/2.0 (-1) | 1,125 (-14%) | 1mo | $325,000 | $289 | 40 |
Match score weights: distance 35% · size 25% · config 20% · recency 20%. Top-matched comps best support the ARV.
Projected returns pro-forma
-3.0% appreciation · 6.35% rent growth · sell at horizon
- IRR
- -3.4%
- Equity multiple
- 0.87×
- Total profit
- $-7,355
- Equity at exit
- $29,821
- IRR
- 9.4%
- Equity multiple
- 1.82×
- Total profit
- $46,136
- Equity at exit
- $17,292
Cash invested: $56,000 (down + closing). Projections, not guarantees.
Landlord ↔ Tenant lean methodology
- Overall (STATE)
- 70 Landlord-Friendly
- State Delaware
- 70 Landlord-Friendly · D+7
- County
- — inherits STATE
- City
- — inherits STATE
ZIP-level market 19805
- Rents YoY
- 6.3%
- Active inventory
- 167
- Price-to-rent
- 8.8×
Monthly cashflow live
- Estimated rent
- $1,893 high interval (Pro) →
- Mortgage (P&I)
- −$1,049
- Tax from tax record
- −$72 /mo · $870/yr
- Insurance
- −$83
- HOA
- −$0
- Vacancy / Maint / Mgmt
- −$398
- Net cashflow
- $291
Break-even live
UW: 25.0% down · 7.5% · 30yr · 1.5% tax · 5.0% vac · 8.0% maint · 8.0% mgmt
Financing live
Cash to close
- Down payment
- $50,000
- Closing costs
- $6,000
- Reserves months
- —
- Total cash needed
- —
Loan-product check · same deal, 3 products live
Conventional
25% down · 7.5% · 30yr
- Down + closing
- —
- Monthly P&I
- —
- Monthly cashflow
- —
- DSCR
- —
- Eligible?
- —
Personal DTI + credit; lowest rate.
DSCR
20% down · 8.5% · 30yr
- Down + closing
- —
- Monthly P&I
- —
- Monthly cashflow
- —
- DSCR
- —
- Eligible?
- —
No personal income docs; deal must DSCR.
Hard money
10% down · 12.0% · 12mo
- Down + closing
- —
- Monthly P&I
- —
- Monthly cashflow
- —
- DSCR
- —
- Eligible?
- —
Short-term bridge; refi at stabilization.
Rent comps 40 comps
| Address | Beds | Baths | Sqft | Rent | $/sqft | DOM | Units | Dist |
|---|---|---|---|---|---|---|---|---|
| 1110 Maple St Wilmington, DE | 3.0 | 1.0 | 1525 | $1,600 | $1.05 | 44d | 1 | 0.07mi |
| 205 Porter St Wilmington, DE | 2.0 | 1.5 | 1200 | $1,700 | $1.42 | 15d | 1 | 0.14mi |
| 414 S Franklin St Wilmington, DE | 3.0 | 2.0 | 1195 | $1,895 | $1.59 | 44d | 1 | 0.16mi |
| 1227 Linden St Wilmington, DE | 3.0 | 2.0 | 950 | $1,850 | $1.95 | 4d | 1 | 0.17mi |
| 1110 Read St Wilmington, DE | 2.0 | 1.0 | 1100 | $1,250 | $1.14 | 20d | 1 | 0.21mi |
| 21 Stroud St Unit 1 Wilmington, DE | 3.0 | 1.5 | 1875 | $1,900 | $1.01 | 44d | 1 | 0.22mi |
| 25 Stroud St Wilmington, DE | 3.0 | 1.0 | 1200 | $1,795 | $1.50 | 4d | 1 | 0.22mi |
| 1029 Lancaster Ave Wilmington, DE | 4.0 | 1.5 | 1375 | $1,900 | $1.38 | 24d | 1 | 0.25mi |
| 331 Justison St Wilmington, DE | 1.0–2.0 | 1.0–2.0 | 859 | $2,205 | $2.57 | 1d | 9 | 0.30mi |
| 1301 Lancaster Ave Wilmington, DE | 4.0 | 2.0 | 1200 | $1,800 | $1.50 | 11d | 1 | 0.31mi |
| 530 Harlan Blvd #519 Wilmington, DE | 2.0 | 2.0 | 1192 | $2,250 | $1.89 | 24d | 1 | 0.35mi |
| 7 6th Ave Wilmington, DE | 3.0 | 2.0 | 1325 | $1,800 | $1.36 | 44d | 1 | 0.37mi |
| 232 N Franklin St Wilmington, DE | 3.0 | 2.0 | 1150 | $1,795 | $1.56 | 44d | 1 | 0.39mi |
| 231 5th Ave Wilmington, DE | 2.0 | 1.0 | 1050 | $1,350 | $1.29 | 44d | 1 | 0.40mi |
| 1525 Beech St Wilmington, DE | 3.0 | 2.5 | 1850 | $2,400 | $1.30 | 5d | 1 | 0.40mi |
| 1508 Maryland Ave Wilmington, DE | 3.0 | 1.5 | 1450 | $1,975 | $1.36 | 15d | 1 | 0.49mi |
| 115 N Clayton St Unit 115 Wilmington, DE | 3.0 | 1.5 | 1200 | $1,725 | $1.44 | 11d | 1 | 0.50mi |
| 1016 Clayton Rd Wilmington, DE | 3.0 | 1.0 | 1150 | $1,850 | $1.61 | 5d | 1 | 0.52mi |
| 307 N Rodney St Wilmington, DE | 3.0 | 1.5 | 1425 | $2,000 | $1.40 | 44d | 1 | 0.53mi |
| 507 W 4th St Wilmington, DE | 3.0 | 1.5 | 1075 | $1,800 | $1.67 | 13d | 1 | 0.55mi |
| 521 N Franklin St Wilmington, DE | 3.0 | 2.0 | 1500 | $1,850 | $1.23 | 4d | 1 | 0.55mi |
| 1601 E Latimer Pl Wilmington, DE | 4.0 | 1.0 | 1450 | $2,195 | $1.51 | 18d | 1 | 0.58mi |
| 1802 Maple St Wilmington, DE | 3.0 | 1.5 | 1250 | $2,500 | $2.00 | 24d | 1 | 0.58mi |
| 820 W 7th St Wilmington, DE | 3.0 | 1.0 | 1000 | $1,650 | $1.65 | 44d | 1 | 0.61mi |
| 1815 Maple St Wilmington, DE | 3.0 | 1.5 | 1100 | $1,995 | $1.81 | 18d | 1 | 0.61mi |
| 617 W 6th St Unit 617 B Wilmington, DE | 3.0 | 1.0 | 1000 | $1,600 | $1.60 | 5d | 1 | 0.61mi |
| 105 Christina Landing Dr #1105 Wilmington, DE | 2.0 | 2.0 | 1150 | $2,500 | $2.17 | 44d | 1 | 0.62mi |
| 105 Christina Landing Dr #1503 Wilmington, DE | 2.0 | 2.0 | 1025 | $2,500 | $2.44 | 17d | 1 | 0.62mi |
| 105 Christina Landing Dr Wilmington, DE | 2.0 | 2.0 | 1025 | $2,400 | $2.34 | 10d | 1 | 0.62mi |
| 1122 Coyne Pl Wilmington, DE | 3.0 | 1.0 | 1350 | $1,950 | $1.44 | 44d | 1 | 0.63mi |
| 1000 W 8th St Unit 3 Wilmington, DE | 2.0 | 1.0 | 1050 | $1,695 | $1.61 | 24d | 1 | 0.65mi |
| 115 Christina Landing Dr Wilmington, DE | 1.0–2.0 | 1.0–2.0 | 1195 | $2,796 | $2.34 | 1d | 13 | 0.65mi |
| 225 W 4th St Unit 2 Wilmington, DE | 2.0 | 1.0 | 1000 | $1,599 | $1.60 | 44d | 1 | 0.65mi |
| 709 Windsor St Unit 3 Wilmington, DE | 2.0 | 1.0 | 980 | $1,500 | $1.53 | 44d | 1 | 0.68mi |
| 711 Windsor St Wilmington, DE | 2.0 | 1.0 | 980 | $1,460 | $1.49 | 44d | 1 | 0.69mi |
| 1522 W 7th St Unit 1 Wilmington, DE | 2.0 | 1.0 | 900 | $1,800 | $2.00 | 4d | 1 | 0.71mi |
| 1601 Bonwood Rd Wilmington, DE | 3.0 | 1.5 | 1500 | $1,850 | $1.23 | 24d | 1 | 0.75mi |
| 703 Orange St Wilmington, DE | 1.0–2.0 | 1.0 | 800 | $1,475 | $1.84 | 44d | 1 | 0.80mi |
| 618 N Scott St Wilmington, DE | 3.0 | 1.5 | 1400 | $1,850 | $1.32 | 44d | 1 | 0.81mi |
| 1600 Bonwood Rd Wilmington, DE | 2.0 | 2.0 | 970 | $1,614 | $1.66 | 15d | 1 | 0.83mi |
Listing history 15 events
-
2026-06-18days on market $200,000 Active 27 DOM
-
2026-06-17days on market $200,000 Active 26 DOM
-
2026-06-16days on market $200,000 Active 25 DOM
-
2026-06-15days on market $200,000 Active 24 DOM
-
2026-06-13days on market $200,000 Active 22 DOM
-
2026-06-13days on market $200,000 Active 21 DOM
-
2026-06-09days on market $200,000 Active 18 DOM
-
2026-06-08days on market $200,000 Active 17 DOM
-
2026-06-07days on market $200,000 Active 16 DOM
-
2026-06-04days on market $200,000 Active 13 DOM
-
2026-06-03days on market $200,000 Active 12 DOM
-
2026-06-02days on market $200,000 Active 11 DOM
-
2026-06-01days on market $200,000 Active 10 DOM
-
2026-05-31days on market $200,000 Active 9 DOM
-
2026-05-22$200,000 Active
ⓘ Source: listings_history table (triggers on properties + properties_extension) + one-shot
backfill from property_details.listing_events for pre-trigger history.
Tax reassessment forecast DE · Partial reset (capped growth)
- Current annual tax
- $870 · $72/mo
- Projected year-2 tax
- $1,015 · $85/mo
- Expected delta
- +$145/yr (+$12/mo · 16.7%)
ⓘ Screening estimate from a state-policy table — verify with the county assessor before closing.
Climate risk First Street
- Flood 1/10 Low FEMA zone X (unshaded) · 0% chance over 30 yrs
- Wildfire 1/10 Low
- Heat 8/10 Severe 7 d/yr ≥103°F today · 16 d/yr by 30 yrs out
- Wind 6/10 Major 27% chance of damaging wind over 30 yrs
- Air quality 3/10 Moderate 3 unhealthy d/yr today · 4 by 30 yrs out
Nearby sold comps map
Loading sold comps map…
Walkable amenities ~0.75 mi
Loading nearby amenities…
Taxation est. · year 1
- Rental income
- $22,720
- − Mortgage interest
- −$11,203
- − Property taxes
- −$870
- − Insurance
- −$1,000
- − Repairs & maintenance
- −$1,818
- − Management
- −$1,818
- − Depreciation
- −$5,818
- Taxable income
- $193
- Est. tax owed @ 24.0%
- −$46
- After-tax cash flow
- $3,446/yr
For passive investors: Depreciation is non-cash, so a rental often shows a tax loss while cash-flowing — sheltering income. Rental losses are passive: they offset passive income freely, and up to $25,000/yr can offset ordinary (W-2) income if you actively participate and your MAGI is under $100k (phasing out to $0 by $150k); unused losses carry forward. On sale, claimed depreciation is recaptured at up to 25%, and gains may owe capital-gains tax (a 1031 exchange can defer both). Figures are a year-1 estimate at your 24.0% rate — not tax advice; consult a CPA.
Schools (NCES district)
- District
- Christina School District
- NCES district ID
- 1000200
- Math proficiency
- 22% ▼ -12.00%
- Reading proficiency
- 33% ▼ -5.00%
- Median HH income
- $58,838
- Composite
- 24.93/100
- National rank
- #7567
- State rank
- #18 of 26 in DE
Livability — Wilmington
- Score
- 64/100
- State rank
- #52
- US rank
- #14251
Category grades
Schools grade is shown separately in the Schools card above.
Census & demographics
- Census place
- Wilmington, DE
- County
- New Castle County · 483,412 people
- City population
- 173,480
- Metro
- Philadelphia-Camden-Wilmington, PA-NJ-DE-MD
- Population (ZIP)
- 41,402
- Household income
- $60,221
- Rent vs Own
- Severe rent burden
- 1730.0
Population outlook (New Castle County) Hauer SSP2
- Today (2025)
- 594,686 people
- By 2030
- 609,164 · +2.4%
- By 2040
- 632,154 · +6.3%
- By 2050
- 649,068 · +9.1%
- By 2075
- 687,771 · +15.7%
- By 2100
- 694,961 · +16.9%
Race, ethnicity, and origin ACS 2023
- Neighborhood character
- Diverse neighborhood (Simpson 0.70)
- Race & ethnicity
- White 37% Black 32% Hispanic / Latino 25% Two or more races 10%
- Hispanic origin (detail)
- Mexican 10% Puerto Rican 10% Dominican 2%
- Common ancestry
- Romanian 4% Slovak 1% Italian 1%
- Foreign-born
- 9% · Canada
- Languages at home
- 79% English-only · Spanish 18% French/Haitian/Cajun 1% Arabic 1%
Political lean MEDSL · New Castle
- 2024 margin
- Solid D (+32.6) · D 65.5% · R 32.9% · Other 1.6%
- 2008→2024 swing
- -8.1pp toward R · 2008: 40.6pp · 2024: 32.6pp
- All cycles
- 2024: D+32.6 2020: D+37.1 2016: D+29.6 2012: D+34.1 2008: D+40.6
Not yet ingested
- Civics
- —
Market trends
- HPI YoY
- ▼ -291.16%
- Current HPI
- 259.1455
- Rent YoY
- ▲ 6.35%
- Metro
- Philadelphia-Camden-Wilmington, PA-NJ-DE-MD
- State GDP YoY
- —
- F500 in state
- 0
Price history
1 event — show timeline
- 2026-05-22 Listed $200,000 BRIGHT MLS
Property tax history
+8.7%/yrLatest (2024): $870 · +84.0% YoY. Source: county tax records.
Cash-flow waterfall
monthlySold comps — $/sqft
last 12 mo · ≤1 miLoading sold comps…