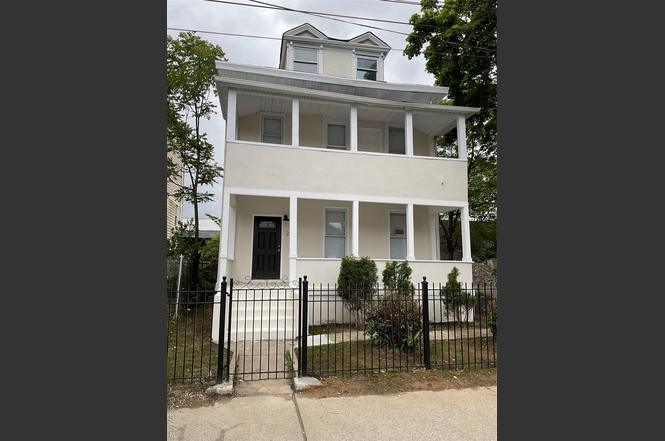
 Triplex
234 S 3rd Ave · Mount Vernon, NY
Flood risk 1/10 · Minimal
- FEMA flood zone
- X (unshaded)
- Chance of flooding over 30 yrs
- 0.0%
- Est. flood insurance / yr
- $507 – $1,088
Fire risk 1/10 · Minimal
- Est. fire insurance / yr
- $691 – $1,283
Heat risk 6/10 · Moderate
- Hot days now (above 98°F)
- 7 days/yr
- Hot days in 30 yrs
- 15 days/yr
Wind risk 6/10 · Moderate
- Chance of severe wind over 30 yrs
- 27.0%
Air-quality risk 5/10 · Moderate
- Unhealthy air days now
- 6 days/yr
- Unhealthy air days in 30 yrs
- 8 days/yr
Risk factors via First Street. Map © Google.
Why this score? — see what drove the D grade
The composite is a weighted blend of 9 inputs, each scored 0–100. Each bar is that input's sub-score; the figure is the points it added to the 100-point composite (weight × sub-score).
- Cash flow +14.2/30.0
- ARV discount +7.5/15.0
- 1% rule +4.8/10.0
- DSCR +4.3/10.0
- Schools +3.7/10.0
- Livability +3.6/5.0
- Rent growth +3.3/5.0
- Condition / age +2.5/5.0
- Appreciation +0.0/10.0
$819,000
🖨 Deal sheet (PDF) 📄 Offer letter ✓ Due diligence
Multi-family units
County records classify this as Multi-Family (2-4 Unit). Listing-text estimate: 3 units. confirmed
Listing remarks
Fully Renovated Triplex located in the heart of the city of Mount Vernon. This Fully Renovated with verified electrical, building amd plumbing permits. This 2 Unit, with 3 Unit Feature has 7.5 Beds and 4 Baths. All Kitchens are featured with Quartz Countertops, Stainless Steel Appliances, Top of line slam proof Cabinets, Exclusive decors and tiles. On the first floor, you’ll find 3 beds, 2 Full Baths, Kitchen, Living room, 4 Closets, and 3 Entrances-Front-Side-Rear-with a back Wooden Deck. As you make your way to the 2nd Floor, you’ll enter the living room, and find 2.5 Bedrooms, 1 Bath, Upgraded Kitchen, Balcony, and a side Entrance from the Driveway. As you make your way to th
Key facts
- Quartz countertops
- Upgraded kitchen
- Top of line cabinets
Tags
Property features AI
Exterior
- Parking: Carport with space for 4 vehicles; One covered garage space; Driveway access; Garage with automatic door opener; Total parking for 5 vehicles
- Security: Video cameras
- Utilities: Public sewer; Electricity available
- Home design: Duplex property sub-type; Updated/remodeled condition
- Exterior features: Stone and stucco exterior; Chain-link front yard fencing; Detached garages/garage structures; Video camera security; Not waterfront
Interior
- Bedrooms: Two 2-bedroom units and one 3-bedroom unit
- Flooring: Other flooring
- Bathrooms: Four full bathrooms
- Heating & cooling: Baseboard heating; No central cooling
- Interior features: Open floor plan; Finished basement; Deck, porch and terrace
Neighborhood map
What this means for you Summary
Snapshot
- This is a 3 × 2-bed/1.3-bath units multifamily listed at $819k.
Deal economics
- At list price, monthly cash flow is $130 ($2k/yr) — positive. Per door: $43/mo.
- The deal already cash-flows at list — no discount required.
- To meet the 1% rule (rent ≥ 1% of price), the offer needs to be $799k (2.5% below list).
- Recommended offer: $721k (12.0% below list) — sets the bar for market timing.
- Cap rate 6.5% vs local median 5.2% in Mount Vernon — meaningfully above typical; check what's discounted (condition, days-on-market, listing class) to confirm the premium yield is real.
Location & tenants
- Location reads 71/100 on livability (#397 in NY) — a middle-class / working-renter tenant base. Strengths: commute A+, health & safety A, employment B; Watch: crime D-, cost of living F.
- Mount Vernon School District (suburban): math 35% / reading 50% proficiency, ranked #485 of 590 in NY (top 82%) — families likely to look elsewhere, expect single-tenant / working-renter base with shorter leases; 62% free/reduced lunch — lower-income household profile, screen leases tightly.
- Zoned schools: Edward Williams School (math 22% / reading 32%, grade F, #1,786 of 2,108 statewide, top 86%, 473 students, 85% FRL); Benjamin Turner Middle School (math 8% / reading 32%, grade F, #678 of 729 statewide, top 94%, 196 students, 71% FRL); Mount Vernon High School (math 54% / reading 75%, grade B-, #776 of 1,100 statewide, top 73%, 1,094 students, 76% FRL) — zoned schools average 77% FRL vs 62% district-wide (15 pts higher); higher-poverty schools than district average — tighter screening recommended.
- Market conditions: Rents rising (+3.4%/yr); 130 active listings in the ZIP; 6 comparable units currently listed for rent nearby; rentals at typical pace (median 26d on market — plan ~3-4 weeks tenant-placement turnaround); 954 units permitted in Westchester County in 2024 (649 in 5+ unit buildings).
- At $7,987/mo this rent would consume 158% of the median local household income ($61k/yr) (locally 2963% of renters already pay >50% of income on rent) — very limited rent-growth headroom before tenants either downsize or default.
Forward outlook
- Local home prices are declining (-3.0%/yr); year-one equity from $6k of loan paydown is wiped out by about $25k of value loss. Plan a longer hold.
- Westchester County population projected at +10% by 2050 — modest demand growth; plan on rents tracking national, not racing it.
Negotiation context
- It's been on market 357 days — a 12% lower offer ($721k) is reasonable based on typical stale-listing flexibility.
- 15 sale attempts since 27y ago; this cycle's ask is 23300% above the opening price — seller raised mid-cycle; expect resistance to lowballs.
- Current owner paid $350k; list at $819k implies a 134% gain — meaningful room to come down on a strong offer.
Risks & watch-outs
- Watch-outs: built in 1896 — expect roof / HVAC / electrical / plumbing capex.
- Climate carrying-cost: major wind risk, 27% chance of damaging wind over 30y; extreme-heat days projected 7→15/yr by 2055 (HVAC capex compounding) — expect insurance premiums to compound above CPI over the hold.
Questions for the listing agent
- It's been on market 357 days. Have you received any prior offers? Is the seller open to a 12% concession, seller financing, or rate buy-down credit?
- Can we see the unit-by-unit rent roll, current vacancy, and any below-market leases? What's the average tenancy length?
- What capital expenditures (roof, boiler, parking lot, exteriors) have been made in the last 5 years, and what's planned in the next 2?
- Built in 1896 — when were the roof, HVAC, electrical panel, plumbing, and water heater last replaced?
- Why hasn't it sold? Are there any deal-killer items the seller is aware of (foundation, flood, title, zoning, code violations)?
- Is there a deadline driving the sale (1031 exchange, divorce, estate, relocation)? That informs how much negotiation room exists.
- Crime grade is D in this area — have there been break-ins, vandalism, or insurance claims at this property in the last 3 years? What carrier currently insures it and at what premium?
- The area grade is low — what's the realistic commute time and amenity access for the typical tenant pool here? Any planned neighborhood developments (good or bad) we should know about?
- What's the average days-on-market for RENTAL listings here right now (not sales)? A rising rental-DOM trend means longer vacancies and softer asking-rent achievability than the comps imply.
- What's the recent tenant-quality profile in this submarket — average credit score on applications, eviction rate, late-payment / NSF rate, and stable-employment percentage? A property-management company in the area should have these aggregated.
- How much new apartment / multifamily construction is in the pipeline within 1–3 miles? Heavy new supply (>2% of stock underway) typically softens rents 12–24 months out; light construction supports rent growth.
Investment metrics
- 1% rule
- 0.98% ✗
- Cap rate
- 6.48%
- Cash-on-cash
- 0.68%
- DSCR
- 1.03
- GRM
- 8.5
CMA / ARV
No comps found within radius.
Show comp detail 12 sales within ~0.75 mi
| Address | Dist | Beds/Ba | Sqft | Sold | Price | $/sf | Match |
|---|---|---|---|---|---|---|---|
| 132 East 4th St | 0.27mi | 6/2.0 | 2,800 | 0mo | $700,000 | $250 | 67 |
| 128 E 4th St | 0.26mi | 6/2.0 | — | 2mo | $770,000 | — | 66 |
| 112 S 7th Ave | 0.30mi | 5/3.0 (-1) | 2,200 | 1mo | $445,000 | $202 | 64 |
| 4423 Mundy Ln | 0.47mi | 7/3.0 (+1) | — | 1mo | $880,000 | — | 56 |
| 450-452 Franklin Ave | 0.43mi | 7/3.0 (+1) | — | 5mo | $740,000 | — | 55 |
| 639 S 5th Ave | 0.71mi | 6/— | — | 0mo | $510,000 | — | 54 |
| 111 S Fulton Ave | 0.43mi | 5/2.0 (-1) | — | 1mo | $415,000 | — | 54 |
| 247 Nuber Ave | 0.58mi | 6/2.0 | — | 1mo | $885,000 | — | 52 |
| 435 S Columbus Ave | 0.71mi | 6/3.0 | — | 3mo | $780,000 | — | 48 |
| 605 S 6th Ave | 0.64mi | 5/2.0 (-1) | — | 0mo | $990,000 | — | 45 |
| 557 S 5th Ave | 0.59mi | 5/2.0 (-1) | 1,975 | 4mo | $450,000 | $228 | 44 |
| 4331 Wilder Ave | 0.75mi | 5/2.0 (-1) | 1,574 | 2mo | $803,000 | $510 | 39 |
Match score weights: distance 35% · size 25% · config 20% · recency 20%. Top-matched comps best support the ARV.
Projected returns pro-forma
-3.0% appreciation · 3.37% rent growth · sell at horizon
- IRR
- -14.7%
- Equity multiple
- 0.47×
- Total profit
- $-121,010
- Equity at exit
- $122,116
- IRR
- -5.3%
- Equity multiple
- 0.65×
- Total profit
- $-80,587
- Equity at exit
- $70,812
Cash invested: $229,320 (down + closing). Projections, not guarantees.
Landlord ↔ Tenant lean methodology
- Overall (STATE)
- 15 Strongly Tenant-Friendly
- State New York
- 15 Strongly Tenant-Friendly · D+10
- County
- — inherits STATE
- City
- — inherits STATE
ZIP-level market 10550
- Rents YoY
- 3.4%
- Active inventory
- 130
- Price-to-rent
- 25.6×
Monthly cashflow live
- Estimated rent
- $7,987 high interval (Pro) →
- Mortgage (P&I)
- −$4,295
- Tax from tax record
- −$1,544 /mo · $18,523/yr
- Insurance
- −$341
- HOA
- −$0
- Vacancy / Maint / Mgmt
- −$1,677
- Net cashflow
- $130
Break-even live
Sensitivity live
| Price | -10% $594 | -5% $362 | +0% $130 | +5% $-102 | +10% $-334 |
|---|---|---|---|---|---|
| Rent | -10% $-501 | -5% $-186 | +0% $130 | +5% $445 | +10% $761 |
| Rate | -1.0pp $542 | -0.5pp $338 | base $130 | +0.5pp $-82 | +1.0pp $-298 |
3-unit breakdown (identical units grouped — click to expand)
| Units | Beds | Baths | Est. rent |
|---|---|---|---|
| 3× units | 2 | 1.3 | $7,986 |
| #1 | 2 | 1.3 | $2,662 |
| #2 | 2 | 1.3 | $2,662 |
| #3 | 2 | 1.3 | $2,662 |
| Total (3 units) | $7,987 | ||
UW: 25.0% down · 7.5% · 30yr · 1.5% tax · 5.0% vac · 8.0% maint · 8.0% mgmt
Financing live
Cash to close
- Down payment
- $204,750
- Closing costs
- $24,570
- Reserves months
- —
- Total cash needed
- —
Loan-product check · same deal, 3 products live
Conventional
25% down · 7.5% · 30yr
- Down + closing
- —
- Monthly P&I
- —
- Monthly cashflow
- —
- DSCR
- —
- Eligible?
- —
Personal DTI + credit; lowest rate.
DSCR
20% down · 8.5% · 30yr
- Down + closing
- —
- Monthly P&I
- —
- Monthly cashflow
- —
- DSCR
- —
- Eligible?
- —
No personal income docs; deal must DSCR.
Hard money
10% down · 12.0% · 12mo
- Down + closing
- —
- Monthly P&I
- —
- Monthly cashflow
- —
- DSCR
- —
- Eligible?
- —
Short-term bridge; refi at stabilization.
Rent comps 6 comps
| Address | Beds | Baths | Sqft | Rent | $/sqft | DOM | Units | Dist |
|---|---|---|---|---|---|---|---|---|
| 310 S 7th Ave Mount Vernon, NY | 5.0 | 2.0 | 1000 | $4,800 | $4.80 | 26d | 1 | 0.25mi |
| 33 Union Ln Mount Vernon, NY | 5.0 | 1.0 | 1200 | $4,200 | $3.50 | 26d | 1 | 0.34mi |
| 33 Union Ln Unit 2 Mt Vernon, NY | 5.0 | 1.0 | — | $4,000 | — | 26d | 1 | 0.34mi |
| 142 W 5th St Mount Vernon, NY | 6.0 | 2.0 | 1250 | $3,756 | $3.00 | 20d | 1 | 0.47mi |
| 641 S 5th Ave Unit 2nd/3rd Floor Mt Vernon, NY | 5.0 | 2.0 | 1800 | $3,900 | $2.17 | 6d | 1 | 0.74mi |
| 222 Primrose Ave Unit 2 Mt Vernon, NY | 5.0 | 2.0 | 1900 | $5,250 | $2.76 | 20d | 1 | 1.08mi |
Listing history 50 events
-
2026-06-21days on market $819,000 Active 357 DOM
-
2026-06-18days on market $819,000 Active 354 DOM
-
2026-06-17days on market $819,000 Active 353 DOM
-
2026-06-16days on market $819,000 Active 352 DOM
-
2026-06-15days on market $819,000 Active 351 DOM
-
2026-06-13days on market $819,000 Active 349 DOM
-
2026-06-09pricedays on market $819,000 Active 345 DOM
-
2026-06-08days on market $849,000 Active 344 DOM
-
2026-06-07days on market $849,000 Active 343 DOM
-
2026-06-04days on market $849,000 Active 340 DOM
-
2026-06-03days on market $849,000 Active 339 DOM
-
2026-06-02days on market $849,000 Active 338 DOM
-
2026-06-01days on market $849,000 Active 337 DOM
-
2026-05-31days on market $849,000 Active 336 DOM
-
2026-03-12status Active
-
2026-03-03historical
-
2026-02-20status Active
-
2026-02-01historical
-
2026-01-07status Active
-
2026-01-01historical
-
2025-10-25price $849,000
-
2025-10-04status Active
-
2025-10-01historical
-
2025-08-18price $899,000
-
2025-07-22historical $3,500
-
2025-06-20$3,500
-
2025-06-19price $995,000
-
2025-05-30historical $3,500
-
2025-05-22$1,100,000 Active
-
2025-05-01$3,500
-
2025-01-16soldstatus $350,000
-
2024-09-12$399,999 Active
-
2022-04-29historical
-
2022-04-25$269,990 Active
-
2014-04-08price $99,900
-
2014-03-15price $110,000
-
2011-04-07soldstatus $110,000 Sold
-
2011-01-05historical Pending
-
2010-12-16price $99,900
-
2010-08-12price $115,900
-
2010-07-15price $124,900
-
2010-05-24$134,900 Active
-
2010-05-20historical
-
2010-04-12price
-
2010-02-23price
-
2010-01-11price
-
2009-12-22price
-
2009-12-07price
-
2009-11-03price
-
2009-10-20price
ⓘ Source: listings_history table (triggers on properties + properties_extension) + one-shot
backfill from property_details.listing_events for pre-trigger history.
Tax reassessment forecast NY · Partial reset (capped growth)
- Current annual tax
- $18,523 · $1,544/mo
- Projected year-2 tax
- $18,523 · $1,544/mo
- Expected delta
- $0/yr ($0/mo · 0.0%)
ⓘ Screening estimate from a state-policy table — verify with the county assessor before closing.
Climate risk First Street
- Flood 1/10 Low FEMA zone X (unshaded) · 0% chance over 30 yrs
- Wildfire 1/10 Low
- Heat 6/10 Major 7 d/yr ≥98°F today · 15 d/yr by 30 yrs out
- Wind 6/10 Major 27% chance of damaging wind over 30 yrs
- Air quality 5/10 Major 6 unhealthy d/yr today · 8 by 30 yrs out
Nearby sold comps map
Loading sold comps map…
Walkable amenities ~0.75 mi
Loading nearby amenities…
Taxation est. · year 1
- Rental income
- $95,844
- − Mortgage interest
- −$45,877
- − Property taxes
- −$18,523
- − Insurance
- −$4,095
- − Repairs & maintenance
- −$7,668
- − Management
- −$7,668
- − Depreciation
- −$23,825
- Taxable loss
- −$11,811
- Est. tax savings @ 24.0%
- +$2,835
- After-tax cash flow
- $4,394/yr
For passive investors: Depreciation is non-cash, so a rental often shows a tax loss while cash-flowing — sheltering income. Rental losses are passive: they offset passive income freely, and up to $25,000/yr can offset ordinary (W-2) income if you actively participate and your MAGI is under $100k (phasing out to $0 by $150k); unused losses carry forward. On sale, claimed depreciation is recaptured at up to 25%, and gains may owe capital-gains tax (a 1031 exchange can defer both). Figures are a year-1 estimate at your 24.0% rate — not tax advice; consult a CPA.
Schools (NCES district)
- District
- Mount Vernon School District
- NCES district ID
- 3620100
- Math proficiency
- 35% ▼ -3.00%
- Reading proficiency
- 50% ▲ 6.00%
- Median HH income
- $50,890
- Composite
- 36.59/100
- National rank
- #4631
- State rank
- #485 of 590 in NY
Livability — Mount Vernon
- Score
- 71/100
- State rank
- #397
- US rank
- #6876
Category grades
Schools grade is shown separately in the Schools card above.
Census & demographics
- Census place
- Mount Vernon, NY
- County
- Westchester County · 709,332 people
- City population
- 61,313
- Metro
- New York-Newark-Jersey City, NY-NJ-PA
- Population (ZIP)
- 38,972
- Household income
- $60,701
- Rent vs Own
- Severe rent burden
- 2963.0
Population outlook (Westchester County) Hauer SSP2
- Today (2025)
- 1,028,035 people
- By 2030
- 1,051,636 · +2.3%
- By 2040
- 1,098,520 · +6.9%
- By 2050
- 1,136,044 · +10.5%
- By 2075
- 1,196,925 · +16.4%
- By 2100
- 1,175,147 · +14.3%
Race, ethnicity, and origin ACS 2023
- Neighborhood character
- Predominantly Black (66%)
- Race & ethnicity
- Black 66% Hispanic / Latino 20% Two or more races 12% White 7% Asian 1%
- Hispanic origin (detail)
- Mexican 3% Puerto Rican 5% Dominican 4%
- Common ancestry
- Estonian 2% Hispanic 1% Russian 1%
- Foreign-born
- 34% · Canada, China, Jamaica
- Languages at home
- 73% English-only · Spanish 16% Other Indo-European 4% French/Haitian/Cajun 2%
Political lean MEDSL · Westchester
- 2024 margin
- Strong D (+26.3) · D 63.1% · R 36.9%
- 2008→2024 swing
- -1.3pp toward R · 2008: 27.6pp · 2024: 26.3pp
- All cycles
- 2024: D+26.3 2020: D+36.3 2016: D+32.8 2012: D+22.2 2008: D+27.6
Not yet ingested
- Civics
- —
Market trends
- HPI YoY
- ▼ -140.69%
- Current HPI
- 191.5235
- Rent YoY
- ▲ 3.37%
- Metro
- New York-Newark-Jersey City, NY-NJ-PA
- State GDP YoY
- ▲ 2.60%
- F500 in state
- 92
Industry mix (Fortune 500 HQ in NY)
| Industry | F500 HQs | Revenue |
|---|---|---|
| Financial Services | 10 | $950B |
|
||
| Consumer Goods | 9 | $162B |
|
||
| Insurance | 4 | $225B |
|
||
| Telecommunications | 2 | $144B |
|
||
| Pharmaceuticals | 2 | $112B |
|
||
| Media / Entertainment | 2 | $69B |
|
||
Price history
+793.7% since first listed49 events — show timeline
- 2026-03-12 Relisted — OneKey® MLS as Distributed by MLS Grid
- 2026-03-03 Listing Removed — OneKey® MLS as Distributed by MLS Grid
- 2026-02-20 Relisted — OneKey® MLS as Distributed by MLS Grid
- 2026-02-01 Listing Removed — OneKey® MLS as Distributed by MLS Grid
- 2026-01-07 Relisted — OneKey® MLS as Distributed by MLS Grid
- 2026-01-01 Listing Removed — OneKey® MLS as Distributed by MLS Grid
- 2025-10-25 Price Changed $849,000 OneKey® MLS as Distributed by MLS Grid
- 2025-10-04 Relisted — OneKey® MLS as Distributed by MLS Grid
- 2025-10-01 Listing Removed — OneKey® MLS as Distributed by MLS Grid
- 2025-08-18 Price Changed $899,000 OneKey® MLS as Distributed by MLS Grid
- 2025-07-22 Rental Removed $3,500 TURBOTENANT
- 2025-06-20 Listed for Rent $3,500 TURBOTENANT
- 2025-06-19 Price Changed $995,000 OneKey® MLS as Distributed by MLS Grid
- 2025-05-30 Rental Removed $3,500 TURBOTENANT
- 2025-05-22 Listed $1,100,000 OneKey® MLS as Distributed by MLS Grid
- 2025-05-01 Listed for Rent $3,500 TURBOTENANT
- 2025-01-16 Sold (Public Records) $350,000 Public Records
- 2024-09-12 Listed $399,999 OneKey® MLS as Distributed by MLS Grid
- 2022-04-29 Listing Removed — OneKey® MLS as Distributed by MLS Grid
- 2022-04-25 Listed $269,990 OneKey® MLS as Distributed by MLS Grid
- 2014-04-08 Price Changed $99,900 HGMLS
- 2014-03-15 Price Changed $110,000 HGMLS
- 2011-04-07 Sold (MLS) $110,000 HGMLS
- 2011-01-05 Contingent — HGMLS
- 2010-12-16 Price Changed $99,900 HGMLS
- 2010-08-12 Price Changed $115,900 HGMLS
- 2010-07-15 Price Changed $124,900 HGMLS
- 2010-05-24 Listed $134,900 HGMLS
- 2010-05-20 Delisted — HGMLS
- 2010-04-12 Price Changed — HGMLS
- 2010-02-23 Price Changed — HGMLS
- 2010-01-11 Price Changed — HGMLS
- 2009-12-22 Price Changed — HGMLS
- 2009-12-07 Price Changed — HGMLS
- 2009-11-03 Price Changed — HGMLS
- 2009-10-20 Price Changed — HGMLS
- 2009-09-30 Listed — HGMLS
- 2008-07-24 Delisted — HGMLS
- 2007-09-19 Listed — HGMLS
- 2007-02-13 Delisted — HGMLS
- 2005-11-01 Listed — HGMLS
- 2003-06-26 Delisted — HGMLS
- 2003-06-19 Listed — HGMLS
- 2000-05-15 Sold (Public Records) $202,000 Public Records
- 2000-05-15 Sold (Public Records) $293,000 Public Records
- 1999-11-23 Price Changed $145,000 HGMLS
- 1999-11-23 Sold (MLS) $127,000 HGMLS
- 1999-08-27 Listed $127,000 HGMLS
- 1996-07-31 Sold (Public Records) $95,000 Public Records
Property tax history
+2.2%/yrLatest (2025): $18,523 · +2.1% YoY. Source: county tax records.
Cash-flow waterfall
monthlySold comps — $/sqft
last 12 mo · ≤1 miLoading sold comps…