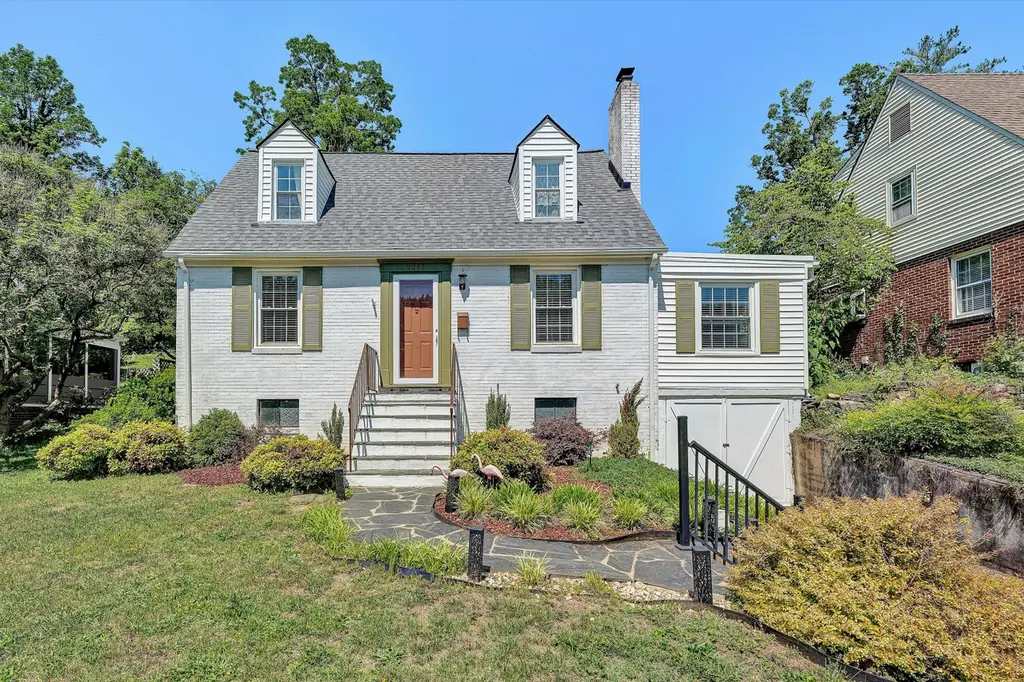
2217 Ross Ln SW · Roanoke, VA
Flood risk 1/10 · Minimal
- FEMA flood zone
- X (unshaded)
- Chance of flooding over 30 yrs
- 0.0%
- Est. flood insurance / yr
- $473 – $860
Fire risk 1/10 · Minimal
- Est. fire insurance / yr
- $666 – $1,236
Heat risk 5/10 · Moderate
- Hot days now (above 100°F)
- 7 days/yr
- Hot days in 30 yrs
- 19 days/yr
Wind risk 2/10 · Minimal
- Chance of severe wind over 30 yrs
- 1.0%
Air-quality risk 1/10 · Minimal
- Unhealthy air days now
- 0 days/yr
- Unhealthy air days in 30 yrs
- 0 days/yr
Risk factors via First Street. Map © Google.
Why this score? — see what drove the F grade
The composite is a weighted blend of 9 inputs, each scored 0–100. Each bar is that input's sub-score; the figure is the points it added to the 100-point composite (weight × sub-score).
- ARV discount +11.9/15.0
- Cash flow +4.8/30.0
- Rent growth +4.1/5.0
- Schools +4.1/10.0
- Livability +3.7/5.0
- Condition / age +2.5/5.0
- 1% rule +0.1/10.0
- DSCR +0.0/10.0
- Appreciation +0.0/10.0
$289,950
🖨 Deal sheet 📄 Offer letter ✓ Due diligence
Listing remarks MLS
Equal Opportunity Housing. Licensed in Virginia.
Key facts
- Brick patio
- New roof
- Garden space
Tags
Property features AI
Finance
- HOA & community: Public transport access nearby; Nearby restaurants
Exterior
- Parking: 1 covered parking space
- Utilities: Has heating; Has cooling
- Home design: Residential property; Built in 1947
- Exterior features: Front porch; Rear porch; 0.19 acre lot
Interior
- Bedrooms: 3 bedrooms total; 1 bedroom on the main level
- Flooring: Tile flooring; Wood flooring
- Bathrooms: 1 full bathroom; 1 half bathroom
- Heating & cooling: Gas radiator heating; Cooling system present
- Interior features: 10 total rooms; Fiberglass and insulated doors; Insulated, tilt-in windows; Tile and wood flooring; One fireplace
Neighborhood map
What this means for you Summary
Snapshot
- This is a 2-bed/2.0-bath single-family listed at $290k.
Deal economics
- At list price, monthly cash flow is $-706 ($-8k/yr) — negative.
- To cash-flow at today's rent, offer at most $165k (43.0% below list).
- To meet the 1% rule (rent ≥ 1% of price), the offer needs to be $148k (48.9% below list).
- Recommended offer: $148k (48.9% below list) — sets the bar for 1% rule.
- Cap rate 3.4% vs local median 4.2% in Roanoke — below-typical yield; the buyer is paying a premium for something (appreciation thesis, condition, location) that the cap rate doesn't capture.
Location & tenants
- Location reads 73/100 on livability (#163 in VA) — a middle-class / working-renter tenant base. Strengths: cost of living A+, health & safety A+, housing A; Watch: amenities C-, employment D, crime F.
- Roanoke City Public School District (urban): math 40% / reading 58% proficiency, ranked #102 of 131 in VA (top 78%) — families likely to look elsewhere, expect single-tenant / working-renter base with shorter leases; 67% free/reduced lunch — lower-income household profile, screen leases tightly.
- Zoned schools: Fishburn Park Elementary (math 47% / reading 67%, grade C+, #597 of 1,108 statewide, top 57%, 292 students, 104% FRL); James Madison Middle (math 41% / reading 68%, grade B-, #194 of 342 statewide, top 60%, 580 students, 96% FRL); Patrick Henry High (math 57% / reading 77%, grade B, #185 of 319 statewide, top 61%, 2,005 students, 95% FRL) — zoned schools average 98% FRL vs 67% district-wide (32 pts higher); higher-poverty schools than district average — tighter screening recommended.
- Market conditions: Rents rising fast (+6.4%/yr); 120 active listings in the ZIP; 30 comparable units currently listed for rent nearby; rentals lingering (median 44d on market — plan ~5-8 weeks vacancy on turnover, expect pricing pressure); 60% of comp listings sitting > 30 days — soft ceiling on asking rent; 113 units permitted in Roanoke city in 2024 (0 in 5+ unit buildings).
Forward outlook
- Local home prices are declining (-3.0%/yr); year-one equity from $2k of loan paydown is wiped out by about $9k of value loss. Plan a longer hold.
- Roanoke County population projected at +11% by 2050 — modest demand growth; plan on rents tracking national, not racing it.
Negotiation context
- Only 4 days on market — expect competitive offers; lowballing is unlikely to land.
- 7 sale attempts since 26y ago with the ask held roughly flat each time — persistent listings suggest the price (not the market) is what's stuck; bring a comps-based counter.
- Current owner paid $188k; list at $290k implies a 54% gain — meaningful room to come down on a strong offer.
Risks & watch-outs
- Watch-outs: built in 1947 — expect roof / HVAC / electrical / plumbing capex.
- Climate carrying-cost: extreme-heat days projected 7→19/yr by 2055 (HVAC capex compounding) — expect insurance premiums to compound above CPI over the hold.
Questions for the listing agent
- What do current leases actually rent for vs. the listed asking? Can we see a recent rent roll and the last 12 months of T-12 income?
- Built in 1947 — when were the roof, HVAC, electrical panel, plumbing, and water heater last replaced?
- Is there a deadline driving the sale (1031 exchange, divorce, estate, relocation)? That informs how much negotiation room exists.
- Schools are A-rated — typically a magnet for longer-tenancy family renters. What's the average tenant stay here, and is there a school-zone premium baked into asking?
- Crime grade is F in this area — have there been break-ins, vandalism, or insurance claims at this property in the last 3 years? What carrier currently insures it and at what premium?
- The area grade is low — what's the realistic commute time and amenity access for the typical tenant pool here? Any planned neighborhood developments (good or bad) we should know about?
- What's the average days-on-market for RENTAL listings here right now (not sales)? A rising rental-DOM trend means longer vacancies and softer asking-rent achievability than the comps imply.
- What's the recent tenant-quality profile in this submarket — average credit score on applications, eviction rate, late-payment / NSF rate, and stable-employment percentage? A property-management company in the area should have these aggregated.
- How much new for-sale + rental construction is in the pipeline within 1–3 miles? Heavy new supply typically softens prices + rents 12–24 months out; constrained supply supports both.
Investment metrics
- 1% rule
- 0.51% ✗
- Cap rate
- 3.37%
- Cash-on-cash
- -10.44%
- DSCR
- 0.54
- GRM
- 16.3
CMA / ARV
- ARV (on-the-fly)
- $321,334
- Comps found
- 6
Show comp detail 6 sales within ~0.75 mi
| Address | Dist | Beds/Ba | Sqft | Sold | Price | $/sf | Match |
|---|---|---|---|---|---|---|---|
| 1027 Windsor Ave SW | 0.66mi | 3/2.5 (+1) | 1,443 (-1%) | 10mo | $348,000 | $241 | 53 |
| 2807 Bluefield Blvd SW | 0.57mi | 3/2.0 (+1) | 1,404 (-3%) | 14mo | $310,000 | $221 | 51 |
| 2440 Guilford Ave SW | 0.62mi | 3/1.5 (+1) | 1,412 (-3%) | 16mo | $269,000 | $191 | 46 |
| 2523 Brambleton Ave SW | 0.65mi | 2/1.0 | 1,337 (-8%) | 8mo | $270,000 | $202 | 46 |
| 1921 Sheffield Rd SW | 0.44mi | 3/2.5 (+1) | 1,624 (+12%) | 18mo | $375,000 | $231 | 38 |
| 2708 Guilford Ave SW | 0.56mi | 3/2.0 (+1) | 1,631 (+12%) | 21mo | $350,000 | $215 | 32 |
Match score weights: distance 35% · size 25% · config 20% · recency 20%. Top-matched comps best support the ARV.
Projected returns pro-forma
-3.0% appreciation · 6.39% rent growth · sell at horizon
- IRR
- -31.9%
- Equity multiple
- -0.07×
- Total profit
- $-86,794
- Equity at exit
- $43,232
- IRR
- -24.7%
- Equity multiple
- -0.36×
- Total profit
- $-110,735
- Equity at exit
- $25,070
Cash invested: $81,186 (down + closing). Projections, not guarantees.
Landlord ↔ Tenant lean methodology
- Overall (STATE)
- 55 Moderately Landlord-Leaning
- State Virginia
- 55 Moderately Landlord-Leaning · D+2
- County
- — inherits STATE
- City
- — inherits STATE
ZIP-level market 24015
- Rents YoY
- 6.4%
- Active inventory
- 120
- Price-to-rent
- 16.3×
Monthly cashflow live
- Estimated rent
- $1,481 high interval (Pro) →
- Mortgage (P&I)
- −$1,521
- Tax from tax record
- −$235 /mo · $2,821/yr
- Insurance
- −$121
- HOA
- −$0
- Vacancy / Maint / Mgmt
- −$311
- Net cashflow
- $-706
Break-even live
UW: 25.0% down · 7.5% · 30yr · 1.5% tax · 5.0% vac · 8.0% maint · 8.0% mgmt
Financing live
Cash to close
- Down payment
- $72,488
- Closing costs
- $8,698
- Reserves months
- —
- Total cash needed
- —
Loan-product check · same deal, 3 products live
Conventional
25% down · 7.5% · 30yr
- Down + closing
- —
- Monthly P&I
- —
- Monthly cashflow
- —
- DSCR
- —
- Eligible?
- —
Personal DTI + credit; lowest rate.
DSCR
20% down · 8.5% · 30yr
- Down + closing
- —
- Monthly P&I
- —
- Monthly cashflow
- —
- DSCR
- —
- Eligible?
- —
No personal income docs; deal must DSCR.
Hard money
10% down · 12.0% · 12mo
- Down + closing
- —
- Monthly P&I
- —
- Monthly cashflow
- —
- DSCR
- —
- Eligible?
- —
Short-term bridge; refi at stabilization.
Rent comps 30 comps
| Address | Beds | Baths | Sqft | Rent | $/sqft | DOM | Units | Dist |
|---|---|---|---|---|---|---|---|---|
| 1668 Brandon Ave SW Roanoke, VA | 3.0 | 1.0 | 1552 | $1,849 | $1.19 | 43d | 1 | 0.18mi |
| 1520 Sherwood Ave SW Roanoke, VA | 2.0 | 1.0 | 900 | $1,500 | $1.67 | 13d | 1 | 0.37mi |
| 1709 Sherwood Ave SW Roanoke, VA | 2.0 | 1.0 | 1271 | $1,650 | $1.30 | 43d | 1 | 0.43mi |
| 1716 Grandin Rd SW Unit 7 Roanoke, VA | 2.0 | 1.0 | 1000 | $1,025 | $1.02 | 43d | 1 | 0.51mi |
| 1933 Windsor Ave SW Unit 4 Roanoke, VA | 1.0 | 1.0 | 1000 | $1,800 | $1.80 | 43d | 1 | 0.57mi |
| 1924 Arden Rd SW Roanoke, VA | 2.0 | 1.0 | 1008 | $1,550 | $1.54 | 43d | 1 | 0.65mi |
| 1701 Westover Ave SW Roanoke, VA | 1.0–2.0 | 1.0 | 876 | $1,045 | $1.19 | 43d | 4 | 0.79mi |
| 2432 Brandon Ave SW Roanoke, VA | 2.0 | 1.0 | 1015 | $1,275 | $1.26 | 43d | 1 | 0.88mi |
| 2610 Colonial Ave SW Roanoke, VA | 3.0 | 1.0 | 1104 | $1,500 | $1.36 | 43d | 1 | 0.89mi |
| 2216 Memorial Ave SW Unit 2218 Roanoke, VA | 2.0 | 1.0 | 1000 | $1,200 | $1.20 | 43d | 1 | 0.92mi |
| 1602 Memorial Ave SW Roanoke, VA | 1.0 | 1.0 | 1250 | $1,800 | $1.44 | 43d | 1 | 0.93mi |
| 743 Suburban Ave SW Unit Suburban 745 Roanoke, VA | 2.0 | 1.0 | 1134 | $1,100 | $0.97 | 13d | 1 | 0.96mi |
| 2615 Laburnum Ave SW Roanoke, VA | 2.0 | 1.5 | 1323 | $1,800 | $1.36 | 43d | 1 | 0.99mi |
| 2615 Laburnum Ave SW Roanoke, VA | 2.0 | 1.5 | 1323 | $1,825 | $1.38 | 20d | 1 | 0.99mi |
| 2307 Memorial Ave SW Roanoke, VA | 2.0 | 1.5 | 1100 | $1,035 | $0.94 | 13d | 1 | 1.01mi |
| 2325 Memorial Avenue SW Roanoke, VA | 1.0–2.0 | 1.0 | 925 | $1,225 | $1.32 | 13d | 3 | 1.04mi |
| 711 Suburban Ave SW Roanoke, VA | 2.0 | 1.5 | 910 | $1,050 | $1.15 | 20d | 1 | 1.04mi |
| 2325 Memorial Ave SW Unit 6 Roanoke, VA | 2.0 | 1.0 | 1050 | $1,125 | $1.07 | 20d | 1 | 1.04mi |
| 1331 Main St SW Roanoke, VA | 2.0 | 1.0 | 877 | $1,023 | $1.17 | 20d | 1 | 1.10mi |
| 2679 Beverly Blvd SW Roanoke, VA | 3.0 | 1.0 | 1000 | $1,623 | $1.62 | 13d | 1 | 1.12mi |
| 737 Townside Rd SW Unit 39 Roanoke, VA | 2.0 | 1.0 | 900 | $900 | $1.00 | 43d | 1 | 1.15mi |
| 711 Townside Rd SW Unit 7 Roanoke, VA | 3.0 | 1.0 | 881 | $1,100 | $1.25 | 44d | 1 | 1.18mi |
| 3602 Colonial Green Cir SW Roanoke, VA | 3.0 | 2.5 | 1670 | $2,622 | $1.57 | 13d | 1 | 1.20mi |
| 708 Townside Rd SW Roanoke, VA | 3.0 | 1.0 | 881 | $1,100 | $1.25 | 43d | 1 | 1.21mi |
| 2601 Westover Ave SW Unit 1 Roanoke, VA | 1.0 | 1.0 | 1275 | $970 | $0.76 | 43d | 1 | 1.26mi |
| 2429 Avenham Ave SW Unit 7 Roanoke, VA | 3.0 | 2.5 | 1536 | $2,000 | $1.30 | 20d | 1 | 1.35mi |
| 1630 Patterson Ave SW Unit B Roanoke, VA | 3.0 | 1.0 | 1200 | $1,395 | $1.16 | 43d | 1 | 1.40mi |
| 3345 Circle Brook Dr Cave Spring, VA | 1.0–3.0 | 1.0–2.0 | 997 | $1,540 | $1.54 | 13d | 11 | 1.43mi |
| 1825 Patterson Ave SW Unit B Roanoke, VA | 2.0 | 1.0 | 1000 | $850 | $0.85 | 43d | 1 | 1.44mi |
| 2202 Broadway Ave SW Unit C Roanoke, VA | 1.0 | 1.0 | 1000 | $1,200 | $1.20 | 43d | 1 | 1.49mi |
Listing history 20 events
-
2026-05-20$289,950 Active
-
2020-10-23soldstatus $188,500
-
2020-10-20soldstatus $188,500 48-char remark
Show marketing remark (48 chars)
Equal Opportunity Housing. Licensed in Virginia.
-
2020-08-25$185,000 48-char remark
Show marketing remark (48 chars)
Equal Opportunity Housing. Licensed in Virginia.
-
2019-06-12soldstatus $169,400 263-char remark
Show marketing remark (263 chars)
This well maintained little gem just needs a little polish to make it really stand out again. Hardwood floors, gas log fireplace, fenced yard and a dry basement! 3 bedrooms, 1-1/2 baths and a Florida room too in a beautiful, established, SW Roanoke neighborhood.
-
2019-06-12soldstatus $169,400
Show marketing remark (263 chars)
This well maintained little gem just needs a little polish to make it really stand out again. Hardwood floors, gas log fireplace, fenced yard and a dry basement! 3 bedrooms, 1-1/2 baths and a Florida room too in a beautiful, established, SW Roanoke neighborhood.
-
2019-04-24$162,900 263-char remark
Show marketing remark (263 chars)
This well maintained little gem just needs a little polish to make it really stand out again. Hardwood floors, gas log fireplace, fenced yard and a dry basement! 3 bedrooms, 1-1/2 baths and a Florida room too in a beautiful, established, SW Roanoke neighborhood.
-
2007-08-17soldstatus $172,500
-
2007-07-18soldstatus $172,500
-
2007-06-27$172,500
-
2004-07-30soldstatus $148,950
-
2004-07-23soldstatus $148,950
-
2004-07-23soldstatus $148,950
-
2004-06-03$148,950
-
2003-05-29soldstatus $134,950
-
2003-03-30$134,950
-
2000-07-28soldstatus $112,000
-
2000-06-06$112,000
-
1996-07-29soldstatus $92,500
-
1990-12-17soldstatus $80,000
ⓘ Source: listings_history table (triggers on properties + properties_extension) + one-shot
backfill from property_details.listing_events for pre-trigger history.
Tax reassessment forecast VA · Resets to sale price
- Current annual tax
- $2,821 · $235/mo
- Projected year-2 tax
- $2,821 · $235/mo
- Expected delta
- $0/yr ($0/mo · 0.0%)
ⓘ Screening estimate from a state-policy table — verify with the county assessor before closing.
Climate risk First Street
- Flood 1/10 Low FEMA zone X (unshaded) · 0% chance over 30 yrs
- Wildfire 1/10 Low
- Heat 5/10 Major 7 d/yr ≥100°F today · 19 d/yr by 30 yrs out
- Wind 2/10 Low 100% chance of damaging wind over 30 yrs
- Air quality 1/10 Low 0 unhealthy d/yr today · 0 by 30 yrs out
Nearby sold comps map
Loading sold comps map…
Walkable amenities ~0.75 mi
Loading nearby amenities…
Taxation est. · year 1
- Rental income
- $17,776
- − Mortgage interest
- −$16,242
- − Property taxes
- −$2,821
- − Insurance
- −$1,450
- − Repairs & maintenance
- −$1,422
- − Management
- −$1,422
- − Depreciation
- −$8,435
- Taxable loss
- −$14,016
- Est. tax savings @ 24.0%
- +$3,364
- After-tax cash flow
- $-5,111/yr
For passive investors: Depreciation is non-cash, so a rental often shows a tax loss while cash-flowing — sheltering income. Rental losses are passive: they offset passive income freely, and up to $25,000/yr can offset ordinary (W-2) income if you actively participate and your MAGI is under $100k (phasing out to $0 by $150k); unused losses carry forward. On sale, claimed depreciation is recaptured at up to 25%, and gains may owe capital-gains tax (a 1031 exchange can defer both). Figures are a year-1 estimate at your 24.0% rate — not tax advice; consult a CPA.
Schools (NCES district)
- District
- Roanoke City Public School District
- NCES district ID
- 5103300
- Math proficiency
- 40% ▼ -38.00%
- Reading proficiency
- 58% ▼ -12.00%
- Median HH income
- $38,592
- Composite
- 40.8/100
- National rank
- #3639
- State rank
- #102 of 131 in VA
Livability — Roanoke
- Score
- 73/100
- State rank
- #163
- US rank
- #5055
Category grades
Schools grade is shown separately in the Schools card above.
Census & demographics
- Census place
- Roanoke, VA
- County
- Roanoke City · 101,625 people
- City population
- 168,930
- Metro
- Roanoke, VA
- Population (ZIP)
- 15,865
- Household income
- $69,831
- Rent vs Own
- Severe rent burden
- 525.0
Population outlook (Roanoke County) Hauer SSP2
- Today (2025)
- 106,094 people
- By 2030
- 108,927 · +2.7%
- By 2040
- 114,104 · +7.5%
- By 2050
- 118,032 · +11.3%
- By 2075
- 123,363 · +16.3%
- By 2100
- 116,827 · +10.1%
Race, ethnicity, and origin ACS 2023
- Neighborhood character
- Predominantly White (83%)
- Race & ethnicity
- White 83% Two or more races 7% Black 5% Hispanic / Latino 5% Asian 2%
- Common ancestry
- Italian 5% Slovak 3% Serbian 2%
- Foreign-born
- 4% · Canada, Jamaica
- Languages at home
- 95% English-only · Spanish 2% Tagalog/Filipino 1% Other Indo-European 1%
Political lean MEDSL · Roanoke
- 2024 margin
- Strong D (+23.6) · D 61.1% · R 37.5% · Other 1.4%
- 2008→2024 swing
- +0.2pp no change · 2008: 23.4pp · 2024: 23.6pp
- All cycles
- 2024: D+23.6 2020: D+25.8 2016: D+17.6 2012: D+21.5 2008: D+23.4
Not yet ingested
- Civics
- —
Market trends
- HPI YoY
- ▼ -333.83%
- Current HPI
- 192.3108
- Rent YoY
- ▲ 6.39%
- Metro
- Roanoke, VA
- State GDP YoY
- ▲ 2.40%
- F500 in state
- 50
Industry mix (Fortune 500 HQ in VA)
| Industry | F500 HQs | Revenue |
|---|---|---|
| Aerospace / Defense | 4 | $236B |
|
||
| Technology / Defense | 3 | $32B |
|
||
| Financial Services | 2 | $176B |
|
||
| Utilities | 2 | $27B |
|
||
| Insurance | 2 | $25B |
|
||
| Technology | 2 | $15B |
|
||
Price history
+262.4% since first listed20 events — show timeline
- 2026-05-20 Listed $289,950 MLSRV
- 2020-10-23 Sold (Public Records) $188,500 Public Records
- 2020-10-20 Sold (MLS) $188,500 MLSRV
- 2020-08-25 Listed $185,000 MLSRV
- 2019-06-12 Sold (Public Records) $169,400 Public Records
- 2019-06-12 Sold (MLS) $169,400 MLSRV
- 2019-04-24 Listed $162,900 MLSRV
- 2007-08-17 Sold (MLS) $172,500 MLSRV
- 2007-07-18 Sold (Public Records) $172,500 Public Records
- 2007-06-27 Listed $172,500 MLSRV
- 2004-07-30 Sold (MLS) $148,950 MLSRV
- 2004-07-23 Sold (Public Records) $148,950 Public Records
- 2004-07-23 Sold (Public Records) $148,950 Public Records
- 2004-06-03 Listed $148,950 MLSRV
- 2003-05-29 Sold (MLS) $134,950 MLSRV
- 2003-03-30 Listed $134,950 MLSRV
- 2000-07-28 Sold (MLS) $112,000 MLSRV
- 2000-06-06 Listed $112,000 MLSRV
- 1996-07-29 Sold (Public Records) $92,500 Public Records
- 1990-12-17 Sold (Public Records) $80,000 Public Records
Property tax history
+3.6%/yrLatest (2025): $2,821 · +4.0% YoY. Source: county tax records.
Cash-flow waterfall
monthlySold comps — $/sqft
last 12 mo · ≤1 miLoading sold comps…