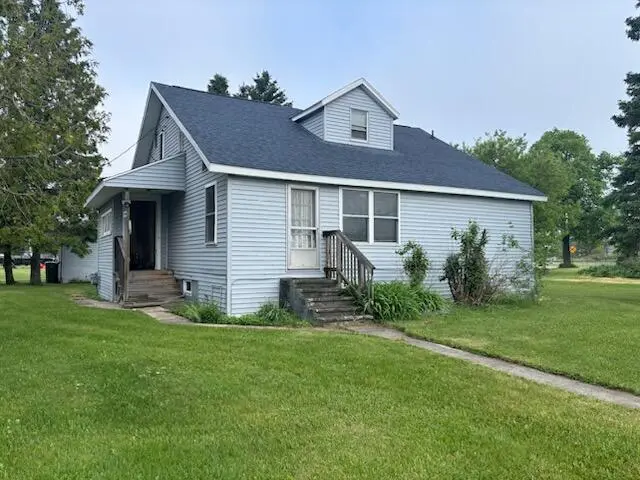
11458 W South St · Rudyard, MI
Flood risk 1/10 · Minimal
- FEMA flood zone
- X (unshaded)
- Chance of flooding over 30 yrs
- 0.0%
- Est. flood insurance / yr
- $473 – $860
Fire risk 3/10 · Minor
- Est. fire insurance / yr
- $784 – $1,456
Heat risk 1/10 · Minimal
- Hot days now (above 88°F)
- 7 days/yr
- Hot days in 30 yrs
- 14 days/yr
Wind risk 1/10 · Minimal
- Chance of severe wind over 30 yrs
- —
Air-quality risk 1/10 · Minimal
- Unhealthy air days now
- 0 days/yr
- Unhealthy air days in 30 yrs
- 0 days/yr
Risk factors via First Street. Map © Google.
Why this score? — see what drove the D grade
The composite is a weighted blend of 9 inputs, each scored 0–100. Each bar is that input's sub-score; the figure is the points it added to the 100-point composite (weight × sub-score).
- Cash flow +10.5/30.0
- Appreciation +8.1/10.0
- ARV discount +7.5/15.0
- Schools +3.2/10.0
- DSCR +3.0/10.0
- Rent growth +2.5/5.0
- Livability +2.5/5.0
- Condition / age +2.5/5.0
- 1% rule +1.8/10.0
$155,000
🖨 Deal sheet 📄 Offer letter ✓ Due diligence
Listing remarks
Welcome to small-town charm! This 3 bedroom, 2 bath home offers comfortable living on a spacious lot in a quiet neighborhood. The large lot is perfect for entertaining, and plenty of room for outdoor activities and gardening. Conveniently located near schools and local shopping, this property combines peaceful living with everyday convenience.
Key facts
- Spacious lot
- Quiet neighborhood
- Built 1950
Tags
Property features AI
Exterior
- Utilities: Public water; Public sewer
- Home design: Single-family residence; Two levels
- Construction: Block foundation
- Exterior features: Corner lot; Asphalt roof
Interior
- Kitchen: Dishwasher; Electric range; Refrigerator
- Bathrooms: 2 full bathrooms
- Heating & cooling: Forced air heating
- Interior features: Dishwasher; Electric range; Refrigerator; No fireplace
- Laundry & utility: Washer and dryer included; Laundry located on the lower level
Neighborhood map
What this means for you Summary
Snapshot
- This is a 3-bed/1.5-bath single-family listed at $155k.
Deal economics
- At list price, monthly cash flow is $-79 ($-946/yr) — negative.
- To cash-flow at today's rent, offer at most $141k (9.0% below list).
- To meet the 1% rule (rent ≥ 1% of price), the offer needs to be $106k (31.8% below list).
- Recommended offer: $106k (31.8% below list) — sets the bar for 1% rule.
Location & tenants
- Location reads: area grade D — affects rentability + tenant quality, not the cash-flow math above.
- Rudyard Area Schools (rural): math 34% / reading 42% proficiency, ranked #245 of 540 in MI (top 45%) — families likely to look elsewhere, expect single-tenant / working-renter base with shorter leases.
- Market conditions: 18 active listings in the ZIP; 92 units permitted in Chippewa County in 2024 (40 in 5+ unit buildings).
Forward outlook
- In year one you build about $11k of equity ($1k loan paydown + $10k appreciation (6.3% local appreciation)).
- Chippewa County population projected at -10% by 2050 — secular population decline; favor cash flow + early exit over multi-decade hold.
- At projected returns (6.3% appreciation + 3.0% rent growth), your $43k cash investment doubles in ~4 years — after that, you're playing with house money.
- By year 4, paydown + projected appreciation supports a ~$37k cash-out refi (75% LTV) — recoverable capital for the next deal without selling this one.
Negotiation context
- Only 8 days on market — expect competitive offers; lowballing is unlikely to land.
Risks & watch-outs
- Watch-outs: built in 1950 — expect roof / HVAC / electrical / plumbing capex.
Questions for the listing agent
- What do current leases actually rent for vs. the listed asking? Can we see a recent rent roll and the last 12 months of T-12 income?
- Built in 1950 — when were the roof, HVAC, electrical panel, plumbing, and water heater last replaced?
- Is there a deadline driving the sale (1031 exchange, divorce, estate, relocation)? That informs how much negotiation room exists.
- The area grade is low — what's the realistic commute time and amenity access for the typical tenant pool here? Any planned neighborhood developments (good or bad) we should know about?
- What's the average days-on-market for RENTAL listings here right now (not sales)? A rising rental-DOM trend means longer vacancies and softer asking-rent achievability than the comps imply.
- What's the recent tenant-quality profile in this submarket — average credit score on applications, eviction rate, late-payment / NSF rate, and stable-employment percentage? A property-management company in the area should have these aggregated.
- How much new for-sale + rental construction is in the pipeline within 1–3 miles? Heavy new supply typically softens prices + rents 12–24 months out; constrained supply supports both.
Investment metrics
- 1% rule
- 0.68% ✗
- Cap rate
- 5.68%
- Cash-on-cash
- -2.18%
- DSCR
- 0.90
- GRM
- 12.2
CMA / ARV
No comps found within radius.
Projected returns pro-forma
6.3% appreciation · 3.0% rent growth · sell at horizon
- IRR
- 14.3%
- Equity multiple
- 1.98×
- Total profit
- $42,392
- Equity at exit
- $100,355
- IRR
- 14.5%
- Equity multiple
- 3.94×
- Total profit
- $127,785
- Equity at exit
- $184,561
Cash invested: $43,400 (down + closing). Projections, not guarantees.
Landlord ↔ Tenant lean methodology
- Overall (STATE)
- 62 Landlord-Friendly
- State Michigan
- 62 Landlord-Friendly · EVEN
- County
- — inherits STATE
- City
- — inherits STATE
ZIP-level market 49780
- Home prices YoY
- 3.4%
- Active inventory
- 18
- Price-to-rent
- 12.2×
Monthly cashflow live
- Estimated rent
- $1,058 medium interval (Pro) →
- Mortgage (P&I)
- −$813
- Tax from tax record
- −$37 /mo · $443/yr
- Insurance
- −$65
- HOA
- −$0
- Vacancy / Maint / Mgmt
- −$222
- Net cashflow
- $-79
Break-even live
UW: 25.0% down · 7.5% · 30yr · 1.5% tax · 5.0% vac · 8.0% maint · 8.0% mgmt
Financing live
Cash to close
- Down payment
- $38,750
- Closing costs
- $4,650
- Reserves months
- —
- Total cash needed
- —
Loan-product check · same deal, 3 products live
Conventional
25% down · 7.5% · 30yr
- Down + closing
- —
- Monthly P&I
- —
- Monthly cashflow
- —
- DSCR
- —
- Eligible?
- —
Personal DTI + credit; lowest rate.
DSCR
20% down · 8.5% · 30yr
- Down + closing
- —
- Monthly P&I
- —
- Monthly cashflow
- —
- DSCR
- —
- Eligible?
- —
No personal income docs; deal must DSCR.
Hard money
10% down · 12.0% · 12mo
- Down + closing
- —
- Monthly P&I
- —
- Monthly cashflow
- —
- DSCR
- —
- Eligible?
- —
Short-term bridge; refi at stabilization.
Listing history 7 events
-
2026-06-18days on market $155,000 Active 8 DOM
-
2026-06-17days on market $155,000 Active 7 DOM
-
2026-06-16days on market $155,000 Active 6 DOM
-
2026-06-15days on market $155,000 Active 5 DOM
-
2026-06-13days on market $155,000 Active 3 DOM
-
2026-06-12remarks 345-char remark
-
2026-06-12$155,000 Active 2 DOM
ⓘ Source: listings_history table (triggers on properties + properties_extension) + one-shot
backfill from property_details.listing_events for pre-trigger history.
Tax reassessment forecast MI · Partial reset (capped growth)
- Current annual tax
- $443 · $37/mo
- Projected year-2 tax
- $1,415 · $118/mo
- Expected delta
- +$972/yr (+$81/mo · 219.3%)
ⓘ Screening estimate from a state-policy table — verify with the county assessor before closing.
Climate risk First Street
- Flood 1/10 Low FEMA zone X (unshaded) · 0% chance over 30 yrs
- Wildfire 3/10 Moderate
- Heat 1/10 Low 7 d/yr ≥88°F today · 14 d/yr by 30 yrs out
- Wind 1/10 Low
- Air quality 1/10 Low 0 unhealthy d/yr today · 0 by 30 yrs out
Nearby sold comps map
Loading sold comps map…
Walkable amenities ~0.75 mi
Loading nearby amenities…
Taxation est. · year 1
- Rental income
- $12,691
- − Mortgage interest
- −$8,682
- − Property taxes
- −$443
- − Insurance
- −$775
- − Repairs & maintenance
- −$1,015
- − Management
- −$1,015
- − Depreciation
- −$4,509
- Taxable loss
- −$3,749
- Est. tax savings @ 24.0%
- +$900
- After-tax cash flow
- $-46/yr
For passive investors: Depreciation is non-cash, so a rental often shows a tax loss while cash-flowing — sheltering income. Rental losses are passive: they offset passive income freely, and up to $25,000/yr can offset ordinary (W-2) income if you actively participate and your MAGI is under $100k (phasing out to $0 by $150k); unused losses carry forward. On sale, claimed depreciation is recaptured at up to 25%, and gains may owe capital-gains tax (a 1031 exchange can defer both). Figures are a year-1 estimate at your 24.0% rate — not tax advice; consult a CPA.
Schools (NCES district)
- District
- Rudyard Area Schools
- NCES district ID
- 2630360
- Math proficiency
- 34% ▼ -11.00%
- Reading proficiency
- 42% ▲ 2.00%
- Median HH income
- $40,299
- Composite
- 31.88/100
- National rank
- #5865
- State rank
- #245 of 540 in MI
Livability — Rudyard
No livability data for this city. (Only ~50 U.S. cities are tracked.)
Census & demographics
- Population (ZIP)
- 1,606
Population outlook (Chippewa County) Hauer SSP2
- Today (2025)
- 37,043 people
- By 2030
- 36,431 · -1.7%
- By 2040
- 34,911 · -5.8%
- By 2050
- 33,350 · -10.0%
- By 2075
- 29,789 · -19.6%
- By 2100
- 24,171 · -34.7%
Race, ethnicity, and origin ACS 2023
- Neighborhood character
- Predominantly White (83%)
- Race & ethnicity
- White 83% Native American 7% Two or more races 6% Hispanic / Latino 2% Black 1% Asian 1%
- Common ancestry
- Iranian 12% Slovak 7% Italian 4%
- Foreign-born
- 2%
- Languages at home
- 97% English-only · Other Indo-European 1% German/W. Germanic 1% Other Asian/Pacific 1%
Political lean MEDSL · Chippewa
- 2024 margin
- Strong R (+24.2) · D 37.0% · R 61.3% · Other 1.7%
- 2008→2024 swing
- -23.8pp toward R · 2008: -0.5pp · 2024: -24.2pp
- All cycles
- 2024: R+24.2 2020: R+22.9 2016: R+24.2 2012: R+7.6 2008: R+0.5
Not yet ingested
- Civics
- —
Market trends
- HPI YoY
- ▲ 6.30%
- Current HPI
- 193.2272
- Rent YoY
- —
- Metro
- —
- State GDP YoY
- ▲ 1.37%
- F500 in state
- 28
Industry mix (Fortune 500 HQ in MI)
| Industry | F500 HQs | Revenue |
|---|---|---|
| Automotive Parts | 3 | $48B |
|
||
| Automotive | 2 | $372B |
|
||
| Chemicals | 1 | $45B |
|
||
| Automotive Retail | 1 | $29B |
|
||
| Healthcare / Medical Devices | 1 | $23B |
|
||
| Automotive Technology | 1 | $20B |
|
||
Price history
1 event — show timeline
- 2026-06-09 Listed $155,000 EUPBR
Property tax history
-5.9%/yrLatest (2024): $443 · -39.2% YoY. Source: county tax records.
Cash-flow waterfall
monthlySold comps — $/sqft
last 12 mo · ≤1 miLoading sold comps…