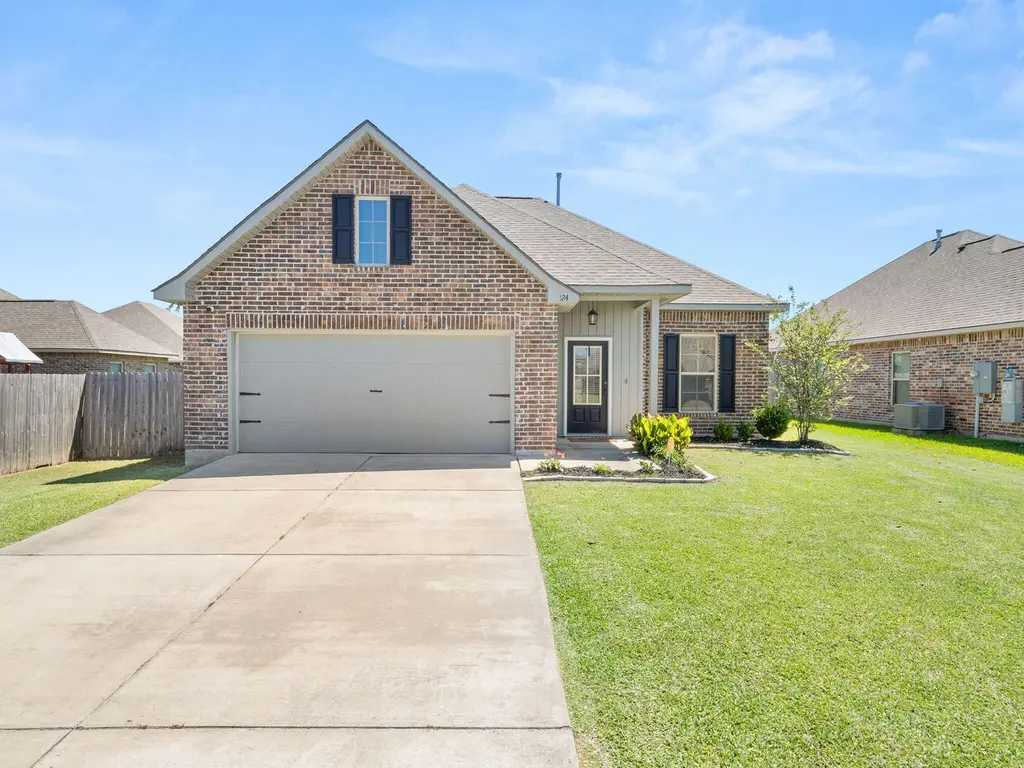
124 Haygood · Sulphur, LA
Flood risk No data
- FEMA flood zone
- —
- Chance of flooding over 30 yrs
- —
- Est. flood insurance / yr
- —
Fire risk No data
- Est. fire insurance / yr
- —
Heat risk No data
- Hot days now (above threshold)
- —
- Hot days in 30 yrs
- —
Wind risk No data
- Chance of severe wind over 30 yrs
- —
Air-quality risk No data
- Unhealthy air days now
- —
- Unhealthy air days in 30 yrs
- —
Risk factors via First Street. Map © Google.
Why this score? — see what drove the B grade
The composite is a weighted blend of 9 inputs, each scored 0–100. Each bar is that input's sub-score; the figure is the points it added to the 100-point composite (weight × sub-score).
- Cash flow +30.0/30.0
- DSCR +10.0/10.0
- ARV discount +10.0/15.0
- 1% rule +8.2/10.0
- Condition / age +4.0/5.0
- Livability +3.6/5.0
- Schools +3.1/10.0
- Rent growth +2.5/5.0
- Appreciation +0.0/10.0
$228,000
🖨 Deal sheet 📄 Offer letter ✓ Due diligence
Listing remarks MLS
This spacious 3 bedroom, 2 bath in Sulphur is a must see! From the charming exterior to the functional layout inside, it's easy to feel right at home. The living space is comfortable and inviting, with a layout that works for both everyday living and entertaining. The garage features a finished, heated and cooled flex space ideal for a home office, game room, or private retreat. Step out back and you'll find a great outdoor setup featuring a covered bar area, perfect for hosting friends, watching the game, or just relaxing after a long day. The fenced yard offers privacy and space to enjoy. You don't want to miss this one!
Key facts
- Finished flex space
- Fenced yard
- Covered bar area
Tags
Neighborhood map
What this means for you Summary
Snapshot
- This is a 3-bed/2.0-bath single-family listed at $228k. Condition is rated good.
Deal economics
- At list price, monthly cash flow is $910 ($11k/yr) — positive.
- The deal already cash-flows at list — no discount required.
- Meets the 1% rule at list price ($3k rent vs $228k).
- Recommended offer: $214k (6.0% below list) — sets the bar for market timing.
- Cap rate 11.1% vs local median 8.8% in Sulphur — meaningfully above typical; check what's discounted (condition, days-on-market, listing class) to confirm the premium yield is real.
Location & tenants
- Location reads 71/100 on livability (#48 in LA) — a middle-class / working-renter tenant base. Strengths: cost of living A+, housing A+, schools A; Watch: crime D-, amenities F, commute F.
- Calcasieu Parish (other): math 30% / reading 44% proficiency, ranked #29 of 98 in LA (top 30%) — families likely to look elsewhere, expect single-tenant / working-renter base with shorter leases.
- Market conditions: 236 active listings in the ZIP; 4 comparable units currently listed for rent nearby; rentals lingering (median 44d on market — plan ~5-8 weeks vacancy on turnover, expect pricing pressure); 75% of comp listings sitting > 30 days — soft ceiling on asking rent; 1,298 units permitted in Calcasieu Parish in 2024 (526 in 5+ unit buildings).
Forward outlook
- Local home prices are declining (-3.0%/yr); year-one equity from $2k of loan paydown is wiped out by about $7k of value loss. Plan a longer hold.
- Calcasieu County population projected at +11% by 2050 — modest demand growth; plan on rents tracking national, not racing it.
- At projected returns (-3.0% appreciation + 3.0% rent growth), your $64k cash investment doubles in ~8 years — after that, you're playing with house money.
Negotiation context
- It's been on market 67 days — a 6% lower offer ($214k) is reasonable based on typical stale-listing flexibility.
Questions for the listing agent
- It's been on market 67 days. Have you received any prior offers? Is the seller open to a 6% concession, seller financing, or rate buy-down credit?
- Why hasn't it sold? Are there any deal-killer items the seller is aware of (foundation, flood, title, zoning, code violations)?
- Is there a deadline driving the sale (1031 exchange, divorce, estate, relocation)? That informs how much negotiation room exists.
- Schools are A-rated — typically a magnet for longer-tenancy family renters. What's the average tenant stay here, and is there a school-zone premium baked into asking?
- Crime grade is D in this area — have there been break-ins, vandalism, or insurance claims at this property in the last 3 years? What carrier currently insures it and at what premium?
- What's the average days-on-market for RENTAL listings here right now (not sales)? A rising rental-DOM trend means longer vacancies and softer asking-rent achievability than the comps imply.
- What's the recent tenant-quality profile in this submarket — average credit score on applications, eviction rate, late-payment / NSF rate, and stable-employment percentage? A property-management company in the area should have these aggregated.
- How much new for-sale + rental construction is in the pipeline within 1–3 miles? Heavy new supply typically softens prices + rents 12–24 months out; constrained supply supports both.
Investment metrics
- 1% rule
- 1.32% ✓
- Cap rate
- 11.08%
- Cash-on-cash
- 17.11%
- DSCR
- 1.76
- GRM
- 6.3
CMA / ARV
- ARV (median comp)
- $241,468
- List price
- $228,000
- Delta
- -5.58%
- Verdict
- FAIR
- Comps
- 20 within 1.0 mi
Show comp detail 12 sales within ~0.75 mi
| Address | Dist | Beds/Ba | Sqft | Sold | Price | $/sf | Match |
|---|---|---|---|---|---|---|---|
| 277 Paisley Pkwy | 0.35mi | 3/2.0 | 1,616 (-1%) | 2mo | $214,000 | $132 | 81 |
| 305 Paisley Pkwy | 0.32mi | 3/2.0 | 1,618 (-1%) | 4mo | $217,000 | $134 | 80 |
| 148 Orchard Ln | 0.13mi | 3/2.0 | 1,514 (-7%) | 7mo | $207,000 | $137 | 77 |
| 216 Pipers Ln | 0.22mi | 3/2.0 | 1,738 (+6%) | 3mo | $240,000 | $138 | 76 |
| 248 Long Hill Dr Dr | 0.24mi | 3/2.0 | 1,698 (+4%) | 7mo | $205,000 | $121 | 76 |
| 109 Briar Ct | 0.39mi | 3/2.0 | 1,642 (+1%) | 7mo | $212,500 | $129 | 75 |
| 235 Aston Ln | 0.27mi | 3/2.0 | 1,563 (-4%) | 10mo | $214,000 | $137 | 72 |
| 308 Paisley Pkwy | 0.28mi | 3/2.0 | 1,755 (+8%) | 3mo | $233,000 | $133 | 72 |
| 337 Madison Xing | 0.09mi | 3/2.0 | 1,452 (-11%) | 8mo | $208,000 | $143 | 71 |
| 329 Paisley Pkwy | 0.31mi | 3/2.0 | 1,826 (+12%) | 2mo | $221,000 | $121 | 64 |
| 213 Pipers Ln | 0.22mi | 4/2.0 (+1) | 1,817 (+11%) | 4mo | $248,000 | $136 | 63 |
| 544 Patton St | 0.66mi | 3/2.0 | 1,400 (-14%) | 1mo | $115,000 | $82 | 45 |
Match score weights: distance 35% · size 25% · config 20% · recency 20%. Top-matched comps best support the ARV.
Projected returns pro-forma
-3.0% appreciation · 3.0% rent growth · sell at horizon
- IRR
- 8.4%
- Equity multiple
- 1.33×
- Total profit
- $21,002
- Equity at exit
- $33,996
- IRR
- 17.6%
- Equity multiple
- 2.45×
- Total profit
- $92,838
- Equity at exit
- $19,713
Cash invested: $63,840 (down + closing). Projections, not guarantees.
Landlord ↔ Tenant lean methodology
- Overall (STATE)
- 90 Strongly Landlord-Friendly
- State Louisiana
- 90 Strongly Landlord-Friendly · R+12
- County
- — inherits STATE
- City
- — inherits STATE
ZIP-level market 70665
- Active inventory
- 236
- Price-to-rent
- 6.3×
Monthly cashflow live
- Estimated rent
- $3,002 medium interval (Pro) →
- Mortgage (P&I)
- −$1,196
- Tax from tax record
- −$171 /mo · $2,053/yr
- Insurance
- −$95
- HOA
- −$0
- Vacancy / Maint / Mgmt
- −$631
- Net cashflow
- $910
Break-even live
UW: 25.0% down · 7.5% · 30yr · 1.5% tax · 5.0% vac · 8.0% maint · 8.0% mgmt
Financing live
Cash to close
- Down payment
- $57,000
- Closing costs
- $6,840
- Reserves months
- —
- Total cash needed
- —
Loan-product check · same deal, 3 products live
Conventional
25% down · 7.5% · 30yr
- Down + closing
- —
- Monthly P&I
- —
- Monthly cashflow
- —
- DSCR
- —
- Eligible?
- —
Personal DTI + credit; lowest rate.
DSCR
20% down · 8.5% · 30yr
- Down + closing
- —
- Monthly P&I
- —
- Monthly cashflow
- —
- DSCR
- —
- Eligible?
- —
No personal income docs; deal must DSCR.
Hard money
10% down · 12.0% · 12mo
- Down + closing
- —
- Monthly P&I
- —
- Monthly cashflow
- —
- DSCR
- —
- Eligible?
- —
Short-term bridge; refi at stabilization.
Rent comps 4 comps
| Address | Beds | Baths | Sqft | Rent | $/sqft | DOM | Units | Dist |
|---|---|---|---|---|---|---|---|---|
| 1000 E Carlyss Blvd Sulphur, LA | 1.0–3.0 | 1.0–2.0 | 966 | $2,296 | $2.38 | 13d | 10 | 0.29mi |
| 293 Sawyer Dr Sulphur, LA | 4.0 | 2.0 | 2079 | $4,400 | $2.12 | 43d | 1 | 0.40mi |
| 1141 Mosswood Dr Sulphur, LA | 2.0–3.0 | 2.0–3.5 | 1332 | $2,195 | $1.65 | 43d | 1 | 1.07mi |
| 1917 Linda Ave Sulphur, LA | 3.0 | 2.0 | 1288 | $1,890 | $1.47 | 43d | 1 | 1.39mi |
Listing history 17 events
-
2026-06-19days on market $228,000 Active 67 DOM
-
2026-06-18days on market $228,000 Active 66 DOM
-
2026-06-17days on market $228,000 Active 65 DOM
-
2026-06-16days on market $228,000 Active 64 DOM
-
2026-06-15days on market $228,000 Active 63 DOM
-
2026-06-14days on market $228,000 Active 61 DOM
-
2026-06-13days on market $228,000 Active 60 DOM
-
2026-06-10days on market $228,000 Active 58 DOM
-
2026-06-09days on market $228,000 Active 57 DOM
-
2026-06-08days on market $228,000 Active 56 DOM
-
2026-06-07days on market $228,000 Active 55 DOM
-
2026-06-05days on market $228,000 Active 52 DOM
-
2026-06-02days on market $228,000 Active 50 DOM
-
2026-06-01days on market $228,000 Active 49 DOM
-
2026-05-31days on market $228,000 Active 48 DOM
-
2026-05-30days on market $228,000 Active 47 DOM
-
2026-04-13$228,000 Active 631-char remark
Show marketing remark (631 chars)
This spacious 3 bedroom, 2 bath in Sulphur is a must see! From the charming exterior to the functional layout inside, it's easy to feel right at home. The living space is comfortable and inviting, with a layout that works for both everyday living and entertaining. The garage features a finished, heated and cooled flex space ideal for a home office, game room, or private retreat. Step out back and you'll find a great outdoor setup featuring a covered bar area, perfect for hosting friends, watching the game, or just relaxing after a long day. The fenced yard offers privacy and space to enjoy. You don't want to miss this one!
ⓘ Source: listings_history table (triggers on properties + properties_extension) + one-shot
backfill from property_details.listing_events for pre-trigger history.
Tax reassessment forecast LA · Resets to sale price
- Current annual tax
- $2,053 · $171/mo
- Projected year-2 tax
- $2,053 · $171/mo
- Expected delta
- $0/yr ($0/mo · 0.0%)
ⓘ Screening estimate from a state-policy table — verify with the county assessor before closing.
Nearby sold comps map
Loading sold comps map…
Walkable amenities ~0.75 mi
Loading nearby amenities…
Taxation est. · year 1
- Rental income
- $36,030
- − Mortgage interest
- −$12,772
- − Property taxes
- −$2,053
- − Insurance
- −$1,140
- − Repairs & maintenance
- −$2,882
- − Management
- −$2,882
- − Depreciation
- −$6,633
- Taxable income
- $7,668
- Est. tax owed @ 24.0%
- −$1,840
- After-tax cash flow
- $9,082/yr
For passive investors: Depreciation is non-cash, so a rental often shows a tax loss while cash-flowing — sheltering income. Rental losses are passive: they offset passive income freely, and up to $25,000/yr can offset ordinary (W-2) income if you actively participate and your MAGI is under $100k (phasing out to $0 by $150k); unused losses carry forward. On sale, claimed depreciation is recaptured at up to 25%, and gains may owe capital-gains tax (a 1031 exchange can defer both). Figures are a year-1 estimate at your 24.0% rate — not tax advice; consult a CPA.
Condition & rehab AI · 13 photos
This well-maintained single-family home in Sulphur is in good condition with a good condition score of 80. It has a good roof, exterior, and interior walls/paint. The kitchen and bathrooms are updated, and the flooring is hardwood. The home is move-in ready with minor cosmetic repairs needed.
Value-add opportunities
- Resale paint exterior — Fresh paint can make a home look more appealing
- Resale update landscaping — Well-maintained landscaping can enhance curb appeal
- Both install smart home devices — Smart home devices can increase both resale and rental value
Renovation cost estimate screening
Value-add ROI direction
- Resale paint exterior — Fresh paint can make a home look more appealing ↑
- Resale update landscaping — Well-maintained landscaping can enhance curb appeal ↑
- Both install smart home devices — Smart home devices can increase both resale and rental value ↑
ⓘ Cost ranges are severity-bucket heuristics (US national rule-of-thumb). Get contractor quotes + a written scope before underwriting a rehab budget.
Schools (NCES district)
- District
- Calcasieu Parish
- NCES district ID
- 2200330
- Math proficiency
- 30% ▼ -39.00%
- Reading proficiency
- 44% ▼ -33.00%
- Median HH income
- $44,700
- Composite
- 31.45/100
- National rank
- #5979
- State rank
- #29 of 98 in LA
Livability — Sulphur
- Score
- 71/100
- State rank
- #48
- US rank
- #7164
Category grades
Schools grade is shown separately in the Schools card above.
Census & demographics
- Census place
- Sulphur, LA
- City population
- 27,799
- Population (ZIP)
- 12,891
Population outlook (Calcasieu County) Hauer SSP2
- Today (2025)
- 212,179 people
- By 2030
- 218,199 · +2.8%
- By 2040
- 228,486 · +7.7%
- By 2050
- 236,208 · +11.3%
- By 2075
- 251,696 · +18.6%
- By 2100
- 247,848 · +16.8%
Race, ethnicity, and origin ACS 2023
- Neighborhood character
- Predominantly White (87%)
- Race & ethnicity
- White 87% Hispanic / Latino 6% Two or more races 4% Black 3%
- Hispanic origin (detail)
- Mexican 4%
- Common ancestry
- Lithuanian 8% Italian 3% Slovak 2%
- Foreign-born
- 3% · Canada
- Languages at home
- 92% English-only · Spanish 6% French/Haitian/Cajun 1% Other Indo-European 1%
Political lean MEDSL · Calcasieu
- 2024 margin
- Solid R (+39.6) · D 29.5% · R 69.0% · Other 1.5%
- 2008→2024 swing
- -15.0pp toward R · 2008: -24.6pp · 2024: -39.6pp
- All cycles
- 2024: R+39.6 2020: R+35.2 2016: R+33.3 2012: R+28.7 2008: R+24.6
Not yet ingested
- Civics
- —
Market trends
- HPI YoY
- ▼ -91.65%
- Current HPI
- 99.2379
- Rent YoY
- —
- Metro
- —
- State GDP YoY
- ▲ 3.29%
- F500 in state
- 10
Industry mix (Fortune 500 HQ in LA)
| Industry | F500 HQs | Revenue |
|---|---|---|
| Telecommunications | 2 | $23B |
|
||
| Utilities | 1 | $12B |
|
||
| Wholesale / Distribution | 1 | $5B |
|
||
| Advertising | 1 | $2B |
|
||
Price history
1 event — show timeline
- 2026-04-13 Listed $228,000 GFPAR
Property tax history
+48.7%/yrLatest (2025): $2,053 · +0.8% YoY. Source: county tax records.
Cash-flow waterfall
monthlySold comps — $/sqft
last 12 mo · ≤1 miLoading sold comps…