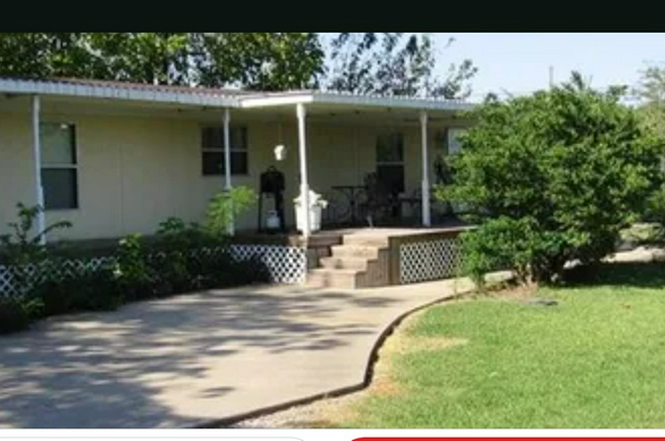
200 Cobb Ave · Van Alstyne, TX
Flood risk 1/10 · Minimal
- FEMA flood zone
- X (unshaded)
- Chance of flooding over 30 yrs
- 0.0%
- Est. flood insurance / yr
- $507 – $1,088
Fire risk 6/10 · Moderate
- Est. fire insurance / yr
- $1,222 – $2,270
Heat risk 7/10 · Major
- Hot days now (above 110°F)
- 7 days/yr
- Hot days in 30 yrs
- 22 days/yr
Wind risk 5/10 · Moderate
- Chance of severe wind over 30 yrs
- 26.0%
Air-quality risk 3/10 · Minor
- Unhealthy air days now
- 2 days/yr
- Unhealthy air days in 30 yrs
- 3 days/yr
Risk factors via First Street. Map © Google.
Why this score? — see what drove the C grade
The composite is a weighted blend of 9 inputs, each scored 0–100. Each bar is that input's sub-score; the figure is the points it added to the 100-point composite (weight × sub-score).
- Cash flow +26.8/30.0
- DSCR +9.2/10.0
- 1% rule +6.2/10.0
- Schools +5.3/10.0
- Livability +3.8/5.0
- Rent growth +2.5/5.0
- Condition / age +2.5/5.0
- ARV discount +0.0/15.0
- Appreciation +0.0/10.0
$130,000
🖨 Deal sheet 📄 Offer letter ✓ Due diligence
Listing remarks MLS
Investment property or home. Clean 2 Bedroom 2 bath on . 27 of an acre treed lot. On a no-through traffic street. Close to downtown, elementary school and on school bus routes. Currently rents for $800 a month month to month. Bedrooms are located one on each end of home. Large living. Enjoy the extended covered deck patio and covered carport. Large privacy fence in back of property. Refrigerator included. Mini blinds on windows. On Van Alstyne ISD bus routes and close to elementary school. No survey available.
Key facts
- Primary bath
- Laundry area
- Carport
Tags
Property features AI
Finance
- Other: No additional financial amenities provided
- Financial info: Financial details not provided
- HOA & community: HOA/community details not provided
Exterior
- Parking: Parking details not provided
- Security: Security details not provided
- Utilities: Utility information not provided
- Home design: House
- Construction: 924 square feet of living space; Construction details not provided
- Exterior features: Lot of approximately 0.268 acres
Interior
- Kitchen: Kitchen details not provided
- Bedrooms: Bedroom count not provided
- Flooring: Flooring details not provided
- Bathrooms: Bathroom count not provided
- Heating & cooling: Heating and cooling details not provided
- Interior features: No interior features provided
- Laundry & utility: Laundry/utility details not provided
Neighborhood map
What this means for you Summary
Snapshot
- This is a 2-bed/2.0-bath manufactured listed at $130k.
Deal economics
- At list price, monthly cash flow is $357 ($4k/yr) — positive.
- The deal already cash-flows at list — no discount required.
- Meets the 1% rule at list price ($1k rent vs $130k).
- Cap rate 9.6% vs local median 2.7% in Van Alstyne — top-decile yield for the area; either an underpriced asset or a hidden risk that comps aren't pricing in. Stress-test before assuming the spread holds.
Location & tenants
- Location reads 75/100 on livability (#134 in TX, #3,950 nationally) — a middle-class / working-renter tenant base. Strengths: crime A+, employment A+, cost of living A+; Watch: amenities F, commute F, health & safety F.
- Van Alstyne ISD (rural): math 62% / reading 59% proficiency, ranked #51 of 826 in TX (top 6%) — acceptable for families but not a draw, mixed tenant base, ~2y average lease.
- Market conditions: 624 active listings in the ZIP; 2 comparable units currently listed for rent nearby; high-income renter base; 2,272 units permitted in Grayson County in 2024 (750 in 5+ unit buildings).
- This rent is only 16% of the median local income ($112k/yr) — well below the 30% rent-burden line; pricing power to push rent on renewal without tenant pushback.
Forward outlook
- Local home prices are declining (-3.0%/yr); year-one equity from $899 of loan paydown is wiped out by about $4k of value loss. Plan a longer hold.
- Grayson County population projected at +12% by 2050 — modest demand growth; plan on rents tracking national, not racing it.
- At projected returns (-3.0% appreciation + 3.0% rent growth), your $36k cash investment doubles in ~10 years — after that, you're playing with house money.
Negotiation context
- Only 1 days on market — expect competitive offers; lowballing is unlikely to land.
- 4 sale attempts since 11y ago with the ask held roughly flat each time — persistent listings suggest the price (not the market) is what's stuck; bring a comps-based counter.
Risks & watch-outs
- Climate carrying-cost: moderate wind risk, 26% chance of damaging wind over 30y; major wildfire risk; extreme-heat days projected 7→22/yr by 2055 (HVAC capex compounding) — expect insurance premiums to compound above CPI over the hold.
Questions for the listing agent
- Is there a deadline driving the sale (1031 exchange, divorce, estate, relocation)? That informs how much negotiation room exists.
- Schools are B-rated — typically a magnet for longer-tenancy family renters. What's the average tenant stay here, and is there a school-zone premium baked into asking?
- What's the average days-on-market for RENTAL listings here right now (not sales)? A rising rental-DOM trend means longer vacancies and softer asking-rent achievability than the comps imply.
- What's the recent tenant-quality profile in this submarket — average credit score on applications, eviction rate, late-payment / NSF rate, and stable-employment percentage? A property-management company in the area should have these aggregated.
- How much new for-sale + rental construction is in the pipeline within 1–3 miles? Heavy new supply typically softens prices + rents 12–24 months out; constrained supply supports both.
Investment metrics
- 1% rule
- 1.12% ✓
- Cap rate
- 9.59%
- Cash-on-cash
- 11.78%
- DSCR
- 1.52
- GRM
- 7.5
CMA / ARV
- ARV (on-the-fly)
- $91,476
- Comps found
- 1
Show comp detail 1 sale within ~0.75 mi
| Address | Dist | Beds/Ba | Sqft | Sold | Price | $/sf | Match |
|---|---|---|---|---|---|---|---|
| 242 Cobb Ave | 0.02mi | 2/1.0 | 896 (-3%) | 3mo | $89,000 | $99 | 88 |
Match score weights: distance 35% · size 25% · config 20% · recency 20%. Top-matched comps best support the ARV.
Projected returns pro-forma
-3.0% appreciation · 3.0% rent growth · sell at horizon
- IRR
- 1.2%
- Equity multiple
- 1.05×
- Total profit
- $1,646
- Equity at exit
- $19,383
- IRR
- 10.8%
- Equity multiple
- 1.84×
- Total profit
- $30,554
- Equity at exit
- $11,240
Cash invested: $36,400 (down + closing). Projections, not guarantees.
Landlord ↔ Tenant lean methodology
- Overall (STATE)
- 87 Strongly Landlord-Friendly
- State Texas
- 87 Strongly Landlord-Friendly · R+5
- County
- — inherits STATE
- City
- — inherits STATE
ZIP-level market 75495
- Home prices YoY
- -10.4%
- Active inventory
- 624
- Price-to-rent
- 7.5×
Monthly cashflow live
- Estimated rent
- $1,452 medium interval (Pro) →
- Mortgage (P&I)
- −$682
- Tax from tax record
- −$54 /mo · $645/yr
- Insurance
- −$54
- HOA
- −$0
- Vacancy / Maint / Mgmt
- −$305
- Net cashflow
- $357
Break-even live
UW: 25.0% down · 7.5% · 30yr · 1.5% tax · 5.0% vac · 8.0% maint · 8.0% mgmt
Financing live
Cash to close
- Down payment
- $32,500
- Closing costs
- $3,900
- Reserves months
- —
- Total cash needed
- —
Loan-product check · same deal, 3 products live
Conventional
25% down · 7.5% · 30yr
- Down + closing
- —
- Monthly P&I
- —
- Monthly cashflow
- —
- DSCR
- —
- Eligible?
- —
Personal DTI + credit; lowest rate.
DSCR
20% down · 8.5% · 30yr
- Down + closing
- —
- Monthly P&I
- —
- Monthly cashflow
- —
- DSCR
- —
- Eligible?
- —
No personal income docs; deal must DSCR.
Hard money
10% down · 12.0% · 12mo
- Down + closing
- —
- Monthly P&I
- —
- Monthly cashflow
- —
- DSCR
- —
- Eligible?
- —
Short-term bridge; refi at stabilization.
Rent comps 2 comps
| Address | Beds | Baths | Sqft | Rent | $/sqft | DOM | Units | Dist |
|---|---|---|---|---|---|---|---|---|
| 653 N Henry Hynds Expy Van Alstyne, TX | 2.0 | 1.0 | 575 | $999 | $1.74 | 17d | 3 | 1.37mi |
| 15 Henry Hynds Expy Unit 15 Van Alstyne, TX | 2.0 | 1.0 | 750 | $999 | $1.33 | 43d | 1 | 1.48mi |
Listing history 6 events
-
2026-06-18remarks 695-char remark
-
2026-06-18days on market $130,000 Active 1 DOM
-
2026-06-18days on market $130,000 Active 2 DOM
-
2026-06-17remarks 488-char remark
-
2026-06-16remarks 456-char remark
-
2026-06-16$130,000 Active 1 DOM
ⓘ Source: listings_history table (triggers on properties + properties_extension) + one-shot
backfill from property_details.listing_events for pre-trigger history.
Tax reassessment forecast TX · Resets to sale price
- Current annual tax
- $645 · $54/mo
- Projected year-2 tax
- $2,379 · $198/mo
- Expected delta
- +$1,734/yr (+$145/mo · 268.8%)
ⓘ Screening estimate from a state-policy table — verify with the county assessor before closing.
Climate risk First Street
- Flood 1/10 Low FEMA zone X (unshaded) · 0% chance over 30 yrs
- Wildfire 6/10 Major
- Heat 7/10 Severe 7 d/yr ≥110°F today · 22 d/yr by 30 yrs out
- Wind 5/10 Major 26% chance of damaging wind over 30 yrs
- Air quality 3/10 Moderate 2 unhealthy d/yr today · 3 by 30 yrs out
Nearby sold comps map
Loading sold comps map…
Walkable amenities ~0.75 mi
Loading nearby amenities…
Taxation est. · year 1
- Rental income
- $17,422
- − Mortgage interest
- −$7,282
- − Property taxes
- −$645
- − Insurance
- −$650
- − Repairs & maintenance
- −$1,394
- − Management
- −$1,394
- − Depreciation
- −$3,782
- Taxable income
- $2,276
- Est. tax owed @ 24.0%
- −$546
- After-tax cash flow
- $3,741/yr
For passive investors: Depreciation is non-cash, so a rental often shows a tax loss while cash-flowing — sheltering income. Rental losses are passive: they offset passive income freely, and up to $25,000/yr can offset ordinary (W-2) income if you actively participate and your MAGI is under $100k (phasing out to $0 by $150k); unused losses carry forward. On sale, claimed depreciation is recaptured at up to 25%, and gains may owe capital-gains tax (a 1031 exchange can defer both). Figures are a year-1 estimate at your 24.0% rate — not tax advice; consult a CPA.
Schools (NCES district)
- District
- Van Alstyne ISD
- NCES district ID
- 4843890
- Math proficiency
- 62% ▼ -1.00%
- Reading proficiency
- 59% ▼ -2.00%
- Median HH income
- $68,451
- Composite
- 53.28/100
- National rank
- #1491
- State rank
- #51 of 826 in TX
Livability — Van Alstyne
- Score
- 75/100
- State rank
- #134
- US rank
- #3950
Category grades
Schools grade is shown separately in the Schools card above.
Census & demographics
- Census place
- Van Alstyne, TX
- County
- Grayson County · 108,053 people
- City population
- 11,120
- Metro
- Sherman-Denison, TX
- Population (ZIP)
- 11,120
- Household income
- $111,563
- Rent vs Own
- Severe rent burden
- 93.0
Population outlook (Grayson County) Hauer SSP2
- Today (2025)
- 134,540 people
- By 2030
- 138,653 · +3.1%
- By 2040
- 145,958 · +8.5%
- By 2050
- 151,218 · +12.4%
- By 2075
- 161,802 · +20.3%
- By 2100
- 159,036 · +18.2%
Race, ethnicity, and origin ACS 2023
- Neighborhood character
- Predominantly White (70%)
- Race & ethnicity
- White 70% Hispanic / Latino 20% Two or more races 15% Black 4%
- Hispanic origin (detail)
- Mexican 19%
- Common ancestry
- Lithuanian 5% Slovak 3% Italian 2%
- Foreign-born
- 9% · Canada
- Languages at home
- 83% English-only · Spanish 15% Russian/Polish/Slavic 1% Tagalog/Filipino 1%
Political lean MEDSL · Grayson
- 2024 margin
- Solid R (+54.3) · D 22.5% · R 76.7%
- 2008→2024 swing
- -16.4pp toward R · 2008: -37.9pp · 2024: -54.3pp
- All cycles
- 2024: R+54.3 2020: R+49.9 2016: R+53.1 2012: R+48.0 2008: R+37.9
Not yet ingested
- Civics
- —
Market trends
- HPI YoY
- ▼ -32.06%
- Current HPI
- 274.6361
- Rent YoY
- —
- Metro
- Sherman-Denison, TX
- State GDP YoY
- ▲ 3.95%
- F500 in state
- 110
Industry mix (Fortune 500 HQ in TX)
| Industry | F500 HQs | Revenue |
|---|---|---|
| Energy | 16 | $1,198B |
|
||
| Technology | 5 | $198B |
|
||
| Engineering / Construction | 4 | $72B |
|
||
| Energy Services | 3 | $60B |
|
||
| Utilities | 3 | $41B |
|
||
| Healthcare | 2 | $330B |
|
||
Price history
+160.0% since first listed11 events — show timeline
- 2026-06-16 Listed $130,000 ForSaleByOwner.com
- 2017-02-16 Sold (MLS) — NTREIS
- 2017-02-14 Pending — NTREIS
- 2017-02-12 Contingent — NTREIS
- 2017-01-30 Listed $58,750 NTREIS
- 2015-12-22 Sold (MLS) — NTREIS
- 2015-12-09 Contingent — NTREIS
- 2015-11-19 Relisted — NTREIS
- 2015-11-07 Contingent — NTREIS
- 2015-10-29 Price Changed $41,000 NTREIS
- 2015-09-15 Listed $50,000 NTREIS
Property tax history
+28.9%/yrLatest (2018): $645 · -12.0% YoY. Source: county tax records.
Cash-flow waterfall
monthlySold comps — $/sqft
last 12 mo · ≤1 miLoading sold comps…