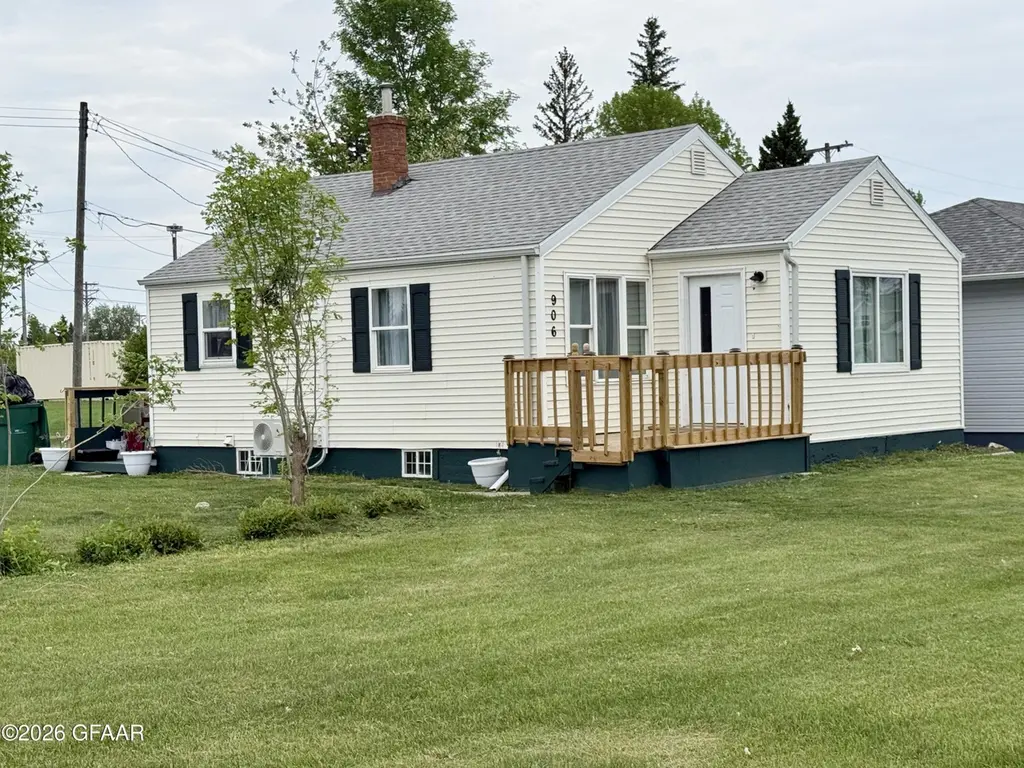
906 9th ST St · Langdon, ND
Flood risk 1/10 · Minimal
- FEMA flood zone
- X (unshaded)
- Chance of flooding over 30 yrs
- 0.0%
- Est. flood insurance / yr
- $473 – $860
Fire risk 1/10 · Minimal
- Est. fire insurance / yr
- $1,289 – $2,393
Heat risk 1/10 · Minimal
- Hot days now (above 91°F)
- 7 days/yr
- Hot days in 30 yrs
- 12 days/yr
Wind risk 1/10 · Minimal
- Chance of severe wind over 30 yrs
- —
Air-quality risk 4/10 · Minor
- Unhealthy air days now
- 5 days/yr
- Unhealthy air days in 30 yrs
- 5 days/yr
Risk factors via First Street. Map © Google.
Why this score? — see what drove the D grade
The composite is a weighted blend of 9 inputs, each scored 0–100. Each bar is that input's sub-score; the figure is the points it added to the 100-point composite (weight × sub-score).
- Cash flow +15.2/30.0
- ARV discount +7.5/15.0
- DSCR +4.7/10.0
- 1% rule +4.2/10.0
- Schools +4.1/10.0
- Livability +3.6/5.0
- Rent growth +2.5/5.0
- Condition / age +2.5/5.0
- Appreciation +0.0/10.0
$87,900
🖨 Deal sheet (PDF) 📄 Offer letter ✓ Due diligence
Key facts
- Remodeled main floor
- Large corner lot
- Floating vanity
Tags
Property features AI
Exterior
- Utilities: Public water; Natural gas available
- Home design: Single-family residence; One story
- Construction: Vinyl siding
- Exterior features: Deck
Interior
- Bathrooms: 1 full bathroom
- Heating & cooling: Forced air heating (natural gas); Has cooling
- Interior features: Crawl space basement; Total of 5 rooms
Neighborhood map
What this means for you Summary
Snapshot
- This is a 2-bed/1.0-bath single-family listed at $88k.
Deal economics
- At list price, monthly cash flow is $31 ($371/yr) — positive.
- The deal already cash-flows at list — no discount required.
- To meet the 1% rule (rent ≥ 1% of price), the offer needs to be $81k (7.6% below list).
- Recommended offer: $81k (7.6% below list) — sets the bar for 1% rule.
Location & tenants
- Location reads 72/100 on livability (#42 in ND) — a middle-class / working-renter tenant base. Strengths: crime A+, cost of living A+, housing A+; Watch: health & safety D+, amenities F, commute F.
- Langdon Area 23 (rural): math 38% / reading 51% proficiency, ranked #83 of 169 in ND (top 49%) — families likely to look elsewhere, expect single-tenant / working-renter base with shorter leases.
- Zoned schools: Langdon Area Elementary School (math 52% / reading 57%, grade C, #39 of 236 statewide, top 21%, 239 students, 23% FRL); Langdon Area High School (math 27% / reading 47%, grade F, #71 of 144 statewide, top 52%, 176 students, 19% FRL) — zoned schools at 21% FRL track the district average.
- Market conditions: 15 active listings in the ZIP; 2 units permitted in Cavalier County in 2024 (0 in 5+ unit buildings).
Forward outlook
- Local home prices are declining (-3.0%/yr); year-one equity from $608 of loan paydown is wiped out by about $3k of value loss. Plan a longer hold.
Negotiation context
- It's been on market 73 days — a 6% lower offer ($83k) is reasonable based on typical stale-listing flexibility.
- Current owner paid $76k; 16% above their basis — modest negotiation headroom, anchor on the comps not their cost.
Risks & watch-outs
- Watch-outs: built in 1920 — expect roof / HVAC / electrical / plumbing capex.
Questions for the listing agent
- It's been on market 73 days. Have you received any prior offers? Is the seller open to a 8% concession, seller financing, or rate buy-down credit?
- Built in 1920 — when were the roof, HVAC, electrical panel, plumbing, and water heater last replaced?
- Why hasn't it sold? Are there any deal-killer items the seller is aware of (foundation, flood, title, zoning, code violations)?
- Is there a deadline driving the sale (1031 exchange, divorce, estate, relocation)? That informs how much negotiation room exists.
- The area grade is low — what's the realistic commute time and amenity access for the typical tenant pool here? Any planned neighborhood developments (good or bad) we should know about?
- What's the average days-on-market for RENTAL listings here right now (not sales)? A rising rental-DOM trend means longer vacancies and softer asking-rent achievability than the comps imply.
- What's the recent tenant-quality profile in this submarket — average credit score on applications, eviction rate, late-payment / NSF rate, and stable-employment percentage? A property-management company in the area should have these aggregated.
- How much new for-sale + rental construction is in the pipeline within 1–3 miles? Heavy new supply typically softens prices + rents 12–24 months out; constrained supply supports both.
Investment metrics
- 1% rule
- 0.92% ✗
- Cap rate
- 6.72%
- Cash-on-cash
- 1.51%
- DSCR
- 1.07
- GRM
- 9.0
CMA / ARV
No comps found within radius.
Projected returns pro-forma
-3.0% appreciation · 3.0% rent growth · sell at horizon
- IRR
- -13.9%
- Equity multiple
- 0.50×
- Total profit
- $-12,260
- Equity at exit
- $13,106
- IRR
- -5.0%
- Equity multiple
- 0.67×
- Total profit
- $-8,083
- Equity at exit
- $7,600
Cash invested: $24,612 (down + closing). Projections, not guarantees.
Landlord ↔ Tenant lean methodology
- Overall (STATE)
- 82 Strongly Landlord-Friendly
- State North Dakota
- 82 Strongly Landlord-Friendly · R+20
- County
- — inherits STATE
- City
- — inherits STATE
ZIP-level market 58249
- Active inventory
- 15
- Price-to-rent
- 9.0×
Monthly cashflow live
- Estimated rent
- $812 medium interval (Pro) →
- Mortgage (P&I)
- −$461
- Tax from tax record
- −$113 /mo · $1,354/yr
- Insurance
- −$37
- HOA
- −$0
- Vacancy / Maint / Mgmt
- −$170
- Net cashflow
- $31
Break-even live
Sensitivity live
| Price | -10% $81 | -5% $56 | +0% $31 | +5% $6 | +10% $-19 |
|---|---|---|---|---|---|
| Rent | -10% $-33 | -5% $-1 | +0% $31 | +5% $63 | +10% $95 |
| Rate | -1.0pp $75 | -0.5pp $53 | base $31 | +0.5pp $8 | +1.0pp $-15 |
UW: 25.0% down · 7.5% · 30yr · 1.5% tax · 5.0% vac · 8.0% maint · 8.0% mgmt
Financing live
Cash to close
- Down payment
- $21,975
- Closing costs
- $2,637
- Reserves months
- —
- Total cash needed
- —
Loan-product check · same deal, 3 products live
Conventional
25% down · 7.5% · 30yr
- Down + closing
- —
- Monthly P&I
- —
- Monthly cashflow
- —
- DSCR
- —
- Eligible?
- —
Personal DTI + credit; lowest rate.
DSCR
20% down · 8.5% · 30yr
- Down + closing
- —
- Monthly P&I
- —
- Monthly cashflow
- —
- DSCR
- —
- Eligible?
- —
No personal income docs; deal must DSCR.
Hard money
10% down · 12.0% · 12mo
- Down + closing
- —
- Monthly P&I
- —
- Monthly cashflow
- —
- DSCR
- —
- Eligible?
- —
Short-term bridge; refi at stabilization.
Listing history 21 events
-
2026-06-22statusdays on market $87,900 Active Under Contract 73 DOM
-
2026-06-21days on market $87,900 Active 72 DOM
-
2026-06-21days on market $87,900 Active 71 DOM
-
2026-06-18days on market $87,900 Active 69 DOM
-
2026-06-17days on market $87,900 Active 68 DOM
-
2026-06-16days on market $87,900 Active 67 DOM
-
2026-06-15days on market $87,900 Active 66 DOM
-
2026-06-13days on market $87,900 Active 64 DOM
-
2026-06-12pricedays on market $87,900 Active 63 DOM
-
2026-06-09days on market $89,900 Active 60 DOM
-
2026-06-08days on market $89,900 Active 59 DOM
-
2026-06-07days on market $89,900 Active 58 DOM
-
2026-06-05days on market $89,900 Active 56 DOM
-
2026-06-04days on market $89,900 Active 54 DOM
-
2026-06-02days on market $89,900 Active 53 DOM
-
2026-06-01days on market $89,900 Active 52 DOM
-
2026-05-31days on market $89,900 Active 51 DOM
-
2026-04-27price $89,900
-
2026-04-10$99,900 Active
-
2025-08-19soldstatus $76,000
-
2015-08-28soldstatus $85,000
ⓘ Source: listings_history table (triggers on properties + properties_extension) + one-shot
backfill from property_details.listing_events for pre-trigger history.
Tax reassessment forecast ND · Resets to sale price
- Current annual tax
- $1,354 · $113/mo
- Projected year-2 tax
- $1,354 · $113/mo
- Expected delta
- $0/yr ($0/mo · 0.0%)
ⓘ Screening estimate from a state-policy table — verify with the county assessor before closing.
Climate risk First Street
- Flood 1/10 Low FEMA zone X (unshaded) · 0% chance over 30 yrs
- Wildfire 1/10 Low
- Heat 1/10 Low 7 d/yr ≥91°F today · 12 d/yr by 30 yrs out
- Wind 1/10 Low
- Air quality 4/10 Moderate 5 unhealthy d/yr today · 5 by 30 yrs out
Nearby sold comps map
Loading sold comps map…
Walkable amenities ~0.75 mi
Loading nearby amenities…
Taxation est. · year 1
- Rental income
- $9,741
- − Mortgage interest
- −$4,924
- − Property taxes
- −$1,354
- − Insurance
- −$440
- − Repairs & maintenance
- −$779
- − Management
- −$779
- − Depreciation
- −$2,557
- Taxable loss
- −$1,091
- Est. tax savings @ 24.0%
- +$262
- After-tax cash flow
- $633/yr
For passive investors: Depreciation is non-cash, so a rental often shows a tax loss while cash-flowing — sheltering income. Rental losses are passive: they offset passive income freely, and up to $25,000/yr can offset ordinary (W-2) income if you actively participate and your MAGI is under $100k (phasing out to $0 by $150k); unused losses carry forward. On sale, claimed depreciation is recaptured at up to 25%, and gains may owe capital-gains tax (a 1031 exchange can defer both). Figures are a year-1 estimate at your 24.0% rate — not tax advice; consult a CPA.
Schools (NCES district)
- District
- Langdon Area 23
- NCES district ID
- 3810810
- Math proficiency
- 38% ▲ 1.00%
- Reading proficiency
- 51% ▲ 8.00%
- Median HH income
- $57,184
- Composite
- 41.13/100
- National rank
- #7427
- State rank
- #83 of 169 in ND
Livability — Langdon
- Score
- 72/100
- State rank
- #42
- US rank
- #5786
Category grades
Schools grade is shown separately in the Schools card above.
Census & demographics
- Census place
- Langdon, ND
- Population (ZIP)
- 2,363
Population outlook (Cavalier County) Hauer SSP2
- Today (2025)
- 3,638 people
- By 2030
- 3,566 · -2.0%
- By 2040
- 3,500 · -3.8%
- By 2050
- 3,532 · -2.9%
- By 2075
- 3,954 · +8.7%
- By 2100
- 4,178 · +14.8%
Race, ethnicity, and origin ACS 2023
- Neighborhood character
- Predominantly White (93%)
- Race & ethnicity
- White 93% Hispanic / Latino 3% Native American 1% Two or more races 1%
- Common ancestry
- Portuguese 18% Lithuanian 4% Italian 2%
- Foreign-born
- 0%
- Languages at home
- 97% English-only · Spanish 2%
Political lean MEDSL · Cavalier
- 2024 margin
- Solid R (+49.1) · D 24.8% · R 73.9% · Other 1.3%
- 2008→2024 swing
- -39.8pp toward R · 2008: -9.3pp · 2024: -49.1pp
- All cycles
- 2024: R+49.1 2020: R+50.7 2016: R+44.7 2012: R+18.2 2008: R+9.3
Not yet ingested
- Civics
- —
Market trends
- HPI YoY
- ▼ -81.91%
- Current HPI
- 116.1776
- Rent YoY
- —
- Metro
- —
- State GDP YoY
- ▲ 2.09%
- F500 in state
- 2
Industry mix (Fortune 500 HQ in ND)
| Industry | F500 HQs | Revenue |
|---|---|---|
| Utilities / Construction | 1 | $6B |
|
||
Price history
+5.8% since first listed4 events — show timeline
- 2026-04-27 Price Changed $89,900 GFAAR
- 2026-04-10 Listed $99,900 GFAAR
- 2025-08-19 Sold (Public Records) $76,000 Public Records
- 2015-08-28 Sold (Public Records) $85,000 Public Records
Property tax history
+14.5%/yrLatest (2025): $1,354 · +70.9% YoY. Source: county tax records.
Cash-flow waterfall
monthlySold comps — $/sqft
last 12 mo · ≤1 miLoading sold comps…