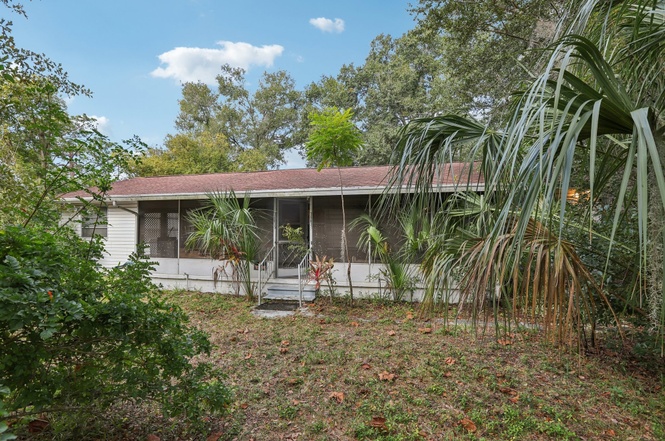
38025 13th Ave · Zephyrhills, FL
Flood risk 1/10 · Minimal
- FEMA flood zone
- X (unshaded)
- Chance of flooding over 30 yrs
- 0.0%
- Est. flood insurance / yr
- $507 – $1,088
Fire risk 1/10 · Minimal
- Est. fire insurance / yr
- $947 – $1,759
Heat risk 9/10 · Severe
- Hot days now (above 108°F)
- 7 days/yr
- Hot days in 30 yrs
- 24 days/yr
Wind risk 9/10 · Severe
- Chance of severe wind over 30 yrs
- 99.0%
Air-quality risk 2/10 · Minimal
- Unhealthy air days now
- 1 days/yr
- Unhealthy air days in 30 yrs
- 2 days/yr
Risk factors via First Street. Map © Google.
Why this score? — see what drove the C grade
The composite is a weighted blend of 9 inputs, each scored 0–100. Each bar is that input's sub-score; the figure is the points it added to the 100-point composite (weight × sub-score).
- Cash flow +20.3/30.0
- ARV discount +15.0/15.0
- DSCR +6.4/10.0
- 1% rule +4.3/10.0
- Schools +4.3/10.0
- Livability +3.6/5.0
- Condition / age +2.5/5.0
- Rent growth +1.6/5.0
- Appreciation +0.0/10.0
$200,000
🖨 Deal sheet (PDF) 📄 Offer letter ✓ Due diligence
Listing remarks
Set on a corner lot, this unique property offers two separate 2-bedroom, 1-bath living spaces connected by an interior door, creating a versatile setup suitable for a variety of needs. A welcoming front farmer’s porch overlooks mature landscaping, with established trees that provide shade and a peaceful outdoor setting. The spacious front yard and one-car carport add to the functionality, while two exterior A/C units, one dedicated to each side of the home, offer independent climate control. With no HOA restrictions, cash-only purchase, and close proximity to West Zephyrhills Elementary School and local conveniences, this property presents a compelling opportunity with room to make it
Key facts
- Spacious front yard
- Front farmer's porch
- Mature landscaping
Tags
Property features AI
Finance
- Other: Homestead exempt; Zoned R3
- HOA & community: No HOA association indicated; Pets allowed
Exterior
- Parking: Driveway; Carport (1 space)
- Utilities: Public water; Public sewer; Electricity connected; Water connected; Sewer connected
- Home design: Single family residence; Residential property; One story; Faces northeast
- Construction: Shingle roof; Other construction materials; Built on crawlspace
- Exterior features: Private mailbox; Paved road access
Interior
- Kitchen: Dishwasher; Microwave; Range; Refrigerator
- Bedrooms: 4 bedrooms
- Flooring: Carpet; Vinyl; Wood; Crawlspace foundation
- Bathrooms: 2 full bathrooms
- Heating & cooling: Central heating; Central air
- Interior features: Ceiling fans
- Laundry & utility: Washer; Dryer; Indoor laundry
Neighborhood map
What this means for you Summary
Snapshot
- This is a 3-bed/1.0-bath single-family listed at $200k.
Deal economics
- At list price, monthly cash flow is $255 ($3k/yr) — positive.
- The deal already cash-flows at list — no discount required.
- To meet the 1% rule (rent ≥ 1% of price), the offer needs to be $186k (6.9% below list).
- Recommended offer: $176k (12.0% below list) — sets the bar for market timing.
- Cap rate 7.8% vs local median 3.7% in Zephyrhills — top-decile yield for the area; either an underpriced asset or a hidden risk that comps aren't pricing in. Stress-test before assuming the spread holds.
Location & tenants
- Location reads 72/100 on livability (#330 in FL) — a middle-class / working-renter tenant base. Strengths: cost of living A+, housing A+, health & safety A; Watch: crime C-, amenities F, commute F.
- Pasco (suburban): math 50% / reading 52% proficiency, ranked #32 of 73 in FL (top 44%) — acceptable for families but not a draw, mixed tenant base, ~2y average lease.
- Zoned schools: West Zephyrhills Elementary School (math 27% / reading 32%, grade F, #1,896 of 2,144 statewide, top 90%, 615 students, 81% FRL); Raymond B. Stewart Middle School (math 33% / reading 30%, grade F, #453 of 571 statewide, top 81%, 988 students, 77% FRL); Zephyrhills High School (math 35% / reading 37%, grade F, #359 of 667 statewide, top 55%, 1,656 students, 70% FRL) — zoned schools average 76% FRL vs 48% district-wide (27 pts higher); higher-poverty schools than district average — tighter screening recommended.
- Zoned-school proficiency averages 32% at this address vs 51% district-wide (-19 pts) — the specific schools serving this property underperform the Pasco average; the district grade overstates school quality for this exact location.
- Market conditions: Rents falling (-3.6%/yr); 297 active listings in the ZIP; 40 comparable units currently listed for rent nearby; rentals at typical pace (median 24d on market — plan ~3-4 weeks tenant-placement turnaround); 6,765 units permitted in Pasco County in 2024 (1,250 in 5+ unit buildings).
- At $1,862/mo this rent would consume 45% of the median local household income ($49k/yr) (locally 831% of renters already pay >50% of income on rent) — very limited rent-growth headroom before tenants either downsize or default.
Forward outlook
- Local home prices are declining (-3.0%/yr); year-one equity from $1k of loan paydown is wiped out by about $6k of value loss. Plan a longer hold.
- Pasco County population projected at +29% by 2050 — long-run rental-demand tailwind backs the buy-and-hold thesis.
Negotiation context
- It's been on market 165 days — a 12% lower offer ($176k) is reasonable based on typical stale-listing flexibility.
Risks & watch-outs
- Watch-outs: built in 1950 — expect roof / HVAC / electrical / plumbing capex.
- Climate carrying-cost: severe wind risk, 99% chance of damaging wind over 30y; extreme-heat days projected 7→24/yr by 2055 (HVAC capex compounding) — expect insurance premiums to compound above CPI over the hold.
Questions for the listing agent
- It's been on market 165 days. Have you received any prior offers? Is the seller open to a 12% concession, seller financing, or rate buy-down credit?
- Built in 1950 — when were the roof, HVAC, electrical panel, plumbing, and water heater last replaced?
- Why hasn't it sold? Are there any deal-killer items the seller is aware of (foundation, flood, title, zoning, code violations)?
- Is there a deadline driving the sale (1031 exchange, divorce, estate, relocation)? That informs how much negotiation room exists.
- What's the average days-on-market for RENTAL listings here right now (not sales)? A rising rental-DOM trend means longer vacancies and softer asking-rent achievability than the comps imply.
- What's the recent tenant-quality profile in this submarket — average credit score on applications, eviction rate, late-payment / NSF rate, and stable-employment percentage? A property-management company in the area should have these aggregated.
- How much new for-sale + rental construction is in the pipeline within 1–3 miles? Heavy new supply typically softens prices + rents 12–24 months out; constrained supply supports both.
Investment metrics
- 1% rule
- 0.93% ✗
- Cap rate
- 7.82%
- Cash-on-cash
- 5.47%
- DSCR
- 1.24
- GRM
- 9.0
CMA / ARV
- ARV (on-the-fly)
- $254,280
- Comps found
- 12
Show comp detail 12 sales within ~0.75 mi
| Address | Dist | Beds/Ba | Sqft | Sold | Price | $/sf | Match |
|---|---|---|---|---|---|---|---|
| 5527 9th St | 0.43mi | 4/2.0 (+1) | 1,674 (+7%) | 5mo | $215,000 | $128 | 55 |
| 38323 11th Ave | 0.30mi | 3/2.0 | 1,360 (-13%) | 8mo | $269,900 | $198 | 54 |
| 37443 Blueberry Ct | 0.61mi | 2/2.0 (-1) | 1,661 (+6%) | 1mo | $270,000 | $163 | 51 |
| 6147 Zephyr Ridge Dr | 0.65mi | 3/2.0 | 1,512 (-3%) | 18mo | $228,000 | $151 | 46 |
| 37340 Derbyshire Dr | 0.69mi | 2/2.0 (-1) | 1,434 (-8%) | 1mo | $275,000 | $192 | 45 |
| 37406 Teaberry Loop | 0.70mi | 2/2.0 (-1) | 1,434 (-8%) | 2mo | $249,900 | $174 | 43 |
| 37347 Derbyshire Dr | 0.66mi | 2/2.0 (-1) | 1,431 (-8%) | 5mo | $228,000 | $159 | 43 |
| 37422 Teaberry Loop | 0.68mi | 2/2.0 (-1) | 1,434 (-8%) | 5mo | $220,000 | $153 | 42 |
| 5909 Yorkshire Dr | 0.63mi | 2/2.0 (-1) | 1,417 (-9%) | 7mo | $224,000 | $158 | 41 |
| 5904 Plaza View Dr | 0.43mi | 3/2.0 | 1,344 (-14%) | 18mo | $195,900 | $146 | 38 |
| 5319 Lantana St | 0.59mi | 3/2.0 | 1,332 (-15%) | 9mo | $305,000 | $229 | 36 |
| 37401 Teaberry Loop | 0.71mi | 2/2.0 (-1) | 1,434 (-8%) | 12mo | $249,500 | $174 | 34 |
Match score weights: distance 35% · size 25% · config 20% · recency 20%. Top-matched comps best support the ARV.
Projected returns pro-forma
-3.0% appreciation · 0.0% rent growth · sell at horizon
- IRR
- -10.9%
- Equity multiple
- 0.61×
- Total profit
- $-21,677
- Equity at exit
- $29,821
- IRR
- -6.1%
- Equity multiple
- 0.65×
- Total profit
- $-19,323
- Equity at exit
- $17,292
Cash invested: $56,000 (down + closing). Projections, not guarantees.
Landlord ↔ Tenant lean methodology
- Overall (STATE)
- 87 Strongly Landlord-Friendly
- State Florida
- 87 Strongly Landlord-Friendly · R+3
- County
- — inherits STATE
- City
- — inherits STATE
ZIP-level market 33542
- Home prices YoY
- -20.6%
- Rents YoY
- -3.6%
- Active inventory
- 297
- Price-to-rent
- 9.0×
Monthly cashflow live
- Estimated rent
- $1,862 high interval (Pro) →
- Mortgage (P&I)
- −$1,049
- Tax from tax record
- −$83 /mo · $999/yr
- Insurance
- −$83
- HOA
- −$0
- Vacancy / Maint / Mgmt
- −$391
- Net cashflow
- $255
Break-even live
Sensitivity live
| Price | -10% $369 | -5% $312 | +0% $255 | +5% $199 | +10% $142 |
|---|---|---|---|---|---|
| Rent | -10% $108 | -5% $182 | +0% $255 | +5% $329 | +10% $402 |
| Rate | -1.0pp $356 | -0.5pp $306 | base $255 | +0.5pp $204 | +1.0pp $151 |
UW: 25.0% down · 7.5% · 30yr · 1.5% tax · 5.0% vac · 8.0% maint · 8.0% mgmt
Financing live
Cash to close
- Down payment
- $50,000
- Closing costs
- $6,000
- Reserves months
- —
- Total cash needed
- —
Loan-product check · same deal, 3 products live
Conventional
25% down · 7.5% · 30yr
- Down + closing
- —
- Monthly P&I
- —
- Monthly cashflow
- —
- DSCR
- —
- Eligible?
- —
Personal DTI + credit; lowest rate.
DSCR
20% down · 8.5% · 30yr
- Down + closing
- —
- Monthly P&I
- —
- Monthly cashflow
- —
- DSCR
- —
- Eligible?
- —
No personal income docs; deal must DSCR.
Hard money
10% down · 12.0% · 12mo
- Down + closing
- —
- Monthly P&I
- —
- Monthly cashflow
- —
- DSCR
- —
- Eligible?
- —
Short-term bridge; refi at stabilization.
Rent comps 40 comps
| Address | Beds | Baths | Sqft | Rent | $/sqft | DOM | Units | Dist |
|---|---|---|---|---|---|---|---|---|
| 6136 Pina Colada St Zephyrhills, FL | 3.0 | 2.5 | 1386 | $2,100 | $1.52 | 14d | 1 | 0.45mi |
| 6195 Daerr Ridge St Zephyrhills, FL | 3.0 | 2.5 | 1386 | $2,000 | $1.44 | 20d | 1 | 0.49mi |
| 5143 1st St Zephyrhills, FL | 3.0 | 2.0 | 1436 | $1,750 | $1.22 | 26d | 1 | 0.52mi |
| 38552 9th Ave Zephyrhills, FL | 4.0 | 2.0 | 1052 | $2,100 | $2.00 | 22d | 1 | 0.53mi |
| 38300 Henry Dr Zephyrhills, FL | 2.0 | 1.0 | 1152 | $1,650 | $1.43 | 7d | 1 | 0.60mi |
| 38719 12th Ave Zephyrhills, FL | 2.0 | 1.5 | 1246 | $1,400 | $1.12 | 26d | 1 | 0.72mi |
| 37661 Aaralyn Rd Zephyrhills, FL | 3.0 | 2.5 | 1363 | $1,800 | $1.32 | 26d | 1 | 0.73mi |
| 6246 Timberly Ln Zephyrhills, FL | 3.0 | 2.5 | 1363 | $1,900 | $1.39 | 26d | 1 | 0.74mi |
| 5812 17th St Zephyrhills, FL | 3.0 | 2.0 | 1320 | $2,100 | $1.59 | 26d | 1 | 0.78mi |
| 5521 Barbara St Zephyrhills, FL | 2.0 | 2.0 | 1056 | $1,800 | $1.70 | 26d | 1 | 0.80mi |
| 6249 Maisai Rd #6 Zephyrhills, FL | 3.0 | 2.5 | 1561 | $1,550 | $0.99 | 5d | 1 | 0.80mi |
| 6262 Maisie Rd Zephyrhills, FL | 3.0 | 2.5 | 1363 | $1,700 | $1.25 | 26d | 1 | 0.80mi |
| 6335 Maisie Rd Zephyrhills, FL | 3.0 | 2.5 | 1363 | $1,650 | $1.21 | 22d | 1 | 0.86mi |
| 37711 Leafside Ln Zephyrhills, FL | 2.0 | 2.5 | 1541 | $1,765 | $1.15 | 17d | 1 | 0.90mi |
| 37726 Leafside Ln Zephyrhills, FL | 3.0 | 2.5 | 1634 | $1,985 | $1.21 | 24d | 1 | 0.92mi |
| 37714 Leafside Ln Zephyrhills, FL | 2.0 | 2.5 | 1541 | $1,855 | $1.20 | 17d | 1 | 0.93mi |
| 37643 Leafside Ln Zephyrhills, FL | 2.0 | 2.5 | 1541 | $1,840 | $1.19 | 24d | 1 | 0.93mi |
| 5028 16th St Zephyrhills, FL | 2.0 | 2.0 | 1092 | $1,545 | $1.41 | 1d | 1 | 0.95mi |
| 4850 Foliage Rd Zephyrhills, FL | 2.0 | 2.5 | 1541 | $1,780 | $1.16 | 24d | 1 | 0.95mi |
| 38350 Ironwood Pl #5 Zephyrhills, FL | 2.0 | 2.0 | 1094 | $1,800 | $1.65 | 26d | 1 | 0.95mi |
| 4940 9th St Zephyrhills, FL | 3.0 | 1.0 | 1404 | $1,895 | $1.35 | 26d | 1 | 0.96mi |
| 6302 Abbott Station Dr Zephyrhills, FL | 3.0 | 1.0–2.5 | 855 | $1,999 | $2.34 | 0d | 141 | 1.01mi |
| 4639 Coral St Zephyrhills, FL | 2.0 | 2.0 | 1056 | $1,250 | $1.18 | 26d | 1 | 1.04mi |
| 37688 Leafside Ln Zephyrhills, FL | 3.0 | 2.5 | 1634 | $1,935 | $1.18 | 26d | 1 | 1.10mi |
| 37741 Leafside Ln Zephyrhills, FL | 2.0 | 2.5 | 1541 | $1,715 | $1.11 | 26d | 1 | 1.10mi |
| 4820 Foliage Rd Zephyrhills, FL | 2.0 | 2.5 | 1541 | $1,780 | $1.16 | 24d | 1 | 1.10mi |
| 37685 Leafside Ln Zephyrhills, FL | 3.0 | 2.5 | 1634 | $1,970 | $1.21 | 7d | 1 | 1.10mi |
| 6788 Basswood Cir Zephyrhills, FL | 2.0 | 2.0 | 1067 | $1,250 | $1.17 | 26d | 1 | 1.12mi |
| 6633 Foxmoor Dr Zephyrhills, FL | 3.0 | 2.0 | 1300 | $2,000 | $1.54 | 26d | 1 | 1.27mi |
| 37472 Sharks Eye Ln Zephyrhills, FL | 3.0 | 2.0 | 1560 | $2,100 | $1.35 | 4d | 1 | 1.27mi |
| 36887 Highland Meadows Ct Zephyrhills, FL | 4.0 | 2.0 | 1828 | $2,250 | $1.23 | 26d | 1 | 1.27mi |
| 39252 Heights Ave Zephyrhills, FL | 3.0 | 2.0 | 1210 | $2,050 | $1.69 | 17d | 1 | 1.29mi |
| 37373 Sharks Eye Ln Zephyrhills, FL | 3.0 | 2.0 | 1560 | $2,200 | $1.41 | 12d | 1 | 1.30mi |
| 37357 Sharks Eye Ln Zephyrhills, FL | 3.0 | 2.5 | 1961 | $2,600 | $1.33 | 26d | 1 | 1.31mi |
| 37814 Daughtery Rd Zephyrhills, FL | 2.0 | 1.0 | 1070 | $1,395 | $1.30 | 7d | 1 | 1.33mi |
| 38028 Fallstone Way Zephyrhills, FL | 3.0 | 2.5 | 1634 | $1,895 | $1.16 | 24d | 1 | 1.33mi |
| 38034 Fallstone Way Zephyrhills, FL | 3.0 | 2.5 | 1634 | $1,895 | $1.16 | 24d | 1 | 1.33mi |
| 38064 Fallstone Way Zephyrhills, FL | 3.0 | 2.5 | 1634 | $1,895 | $1.16 | 20d | 1 | 1.33mi |
| 38078 Fallstone Way Zephyrhills, FL | 2.0 | 2.5 | 1541 | $1,765 | $1.15 | 24d | 1 | 1.33mi |
| 38055 Woodgate Ln Zephyrhills, FL | 3.0 | 2.0 | 1456 | $1,400 | $0.96 | 26d | 1 | 1.34mi |
Listing history 17 events
-
2026-06-21days on market $200,000 Active 165 DOM
-
2026-06-18days on market $200,000 Active 162 DOM
-
2026-06-17days on market $200,000 Active 161 DOM
-
2026-06-16days on market $200,000 Active 160 DOM
-
2026-06-15days on market $200,000 Active 159 DOM
-
2026-06-13days on market $200,000 Active 157 DOM
-
2026-06-09days on market $200,000 Active 153 DOM
-
2026-06-08days on market $200,000 Active 152 DOM
-
2026-06-07days on market $200,000 Active 151 DOM
-
2026-06-04days on market $200,000 Active 148 DOM
-
2026-06-03days on market $200,000 Active 147 DOM
-
2026-06-02days on market $200,000 Active 146 DOM
-
2026-06-01days on market $200,000 Active 145 DOM
-
2026-05-31days on market $200,000 Active 144 DOM
-
2026-04-23price $200,000
-
2026-02-27price $219,900
-
2026-01-07$235,000 Active
ⓘ Source: listings_history table (triggers on properties + properties_extension) + one-shot
backfill from property_details.listing_events for pre-trigger history.
Tax reassessment forecast FL · Resets to sale price
- Current annual tax
- $999 · $83/mo
- Projected year-2 tax
- $1,660 · $138/mo
- Expected delta
- +$661/yr (+$55/mo · 66.1%)
ⓘ Screening estimate from a state-policy table — verify with the county assessor before closing.
Climate risk First Street
- Flood 1/10 Low FEMA zone X (unshaded) · 0% chance over 30 yrs
- Wildfire 1/10 Low
- Heat 9/10 Extreme 7 d/yr ≥108°F today · 24 d/yr by 30 yrs out
- Wind 9/10 Extreme 99% chance of damaging wind over 30 yrs
- Air quality 2/10 Low 1 unhealthy d/yr today · 2 by 30 yrs out
Nearby sold comps map
Loading sold comps map…
Walkable amenities ~0.75 mi
Loading nearby amenities…
Taxation est. · year 1
- Rental income
- $22,340
- − Mortgage interest
- −$11,203
- − Property taxes
- −$999
- − Insurance
- −$1,000
- − Repairs & maintenance
- −$1,787
- − Management
- −$1,787
- − Depreciation
- −$5,818
- Taxable loss
- −$255
- Est. tax savings @ 24.0%
- +$61
- After-tax cash flow
- $3,125/yr
For passive investors: Depreciation is non-cash, so a rental often shows a tax loss while cash-flowing — sheltering income. Rental losses are passive: they offset passive income freely, and up to $25,000/yr can offset ordinary (W-2) income if you actively participate and your MAGI is under $100k (phasing out to $0 by $150k); unused losses carry forward. On sale, claimed depreciation is recaptured at up to 25%, and gains may owe capital-gains tax (a 1031 exchange can defer both). Figures are a year-1 estimate at your 24.0% rate — not tax advice; consult a CPA.
Schools (NCES district)
- District
- Pasco
- NCES district ID
- 1201530
- Math proficiency
- 50% ▼ -10.00%
- Reading proficiency
- 52% ▼ -5.00%
- Median HH income
- $45,039
- Composite
- 43.14/100
- National rank
- #3074
- State rank
- #32 of 73 in FL
Livability — Zephyrhills
- Score
- 72/100
- State rank
- #330
- US rank
- #5760
Category grades
Schools grade is shown separately in the Schools card above.
Census & demographics
- Census place
- Zephyrhills, FL
- County
- Pasco County · 524,098 people
- City population
- 48,266
- Metro
- Tampa-St. Petersburg-Clearwater, FL
- Population (ZIP)
- 23,612
- Household income
- $49,316
- Rent vs Own
- Severe rent burden
- 831.0
Population outlook (Pasco County) Hauer SSP2
- Today (2025)
- 570,045 people
- By 2030
- 605,844 · +6.3%
- By 2040
- 674,806 · +18.4%
- By 2050
- 736,022 · +29.1%
- By 2075
- 862,900 · +51.4%
- By 2100
- 906,364 · +59.0%
Race, ethnicity, and origin ACS 2023
- Neighborhood character
- Predominantly White (76%)
- Race & ethnicity
- White 76% Hispanic / Latino 17% Two or more races 8% Black 4% Asian 1%
- Hispanic origin (detail)
- Mexican 2% Puerto Rican 10%
- Common ancestry
- Lithuanian 3% Romanian 2% Iranian 2%
- Foreign-born
- 5% · Canada, Jamaica
- Languages at home
- 86% English-only · Spanish 12% Other Indo-European 1% Russian/Polish/Slavic 1%
Political lean MEDSL · Pasco
- 2024 margin
- Strong R (+25.2) · D 36.9% · R 62.1% · Other 1.0%
- 2008→2024 swing
- -21.6pp toward R · 2008: -3.6pp · 2024: -25.2pp
- All cycles
- 2024: R+25.2 2020: R+20.1 2016: R+21.6 2012: R+6.7 2008: R+3.6
Not yet ingested
- Civics
- —
Market trends
- HPI YoY
- ▼ -81.25%
- Current HPI
- 313.3993
- Rent YoY
- ▼ -3.56%
- Metro
- Tampa-St. Petersburg-Clearwater, FL
- State GDP YoY
- ▲ 3.28%
- F500 in state
- 36
Industry mix (Fortune 500 HQ in FL)
| Industry | F500 HQs | Revenue |
|---|---|---|
| Industrial Technology | 2 | $29B |
|
||
| Insurance | 2 | $17B |
|
||
| Retail | 1 | $60B |
|
||
| Technology Distribution | 1 | $58B |
|
||
| Homebuilding | 1 | $35B |
|
||
| Technology Manufacturing | 1 | $35B |
|
||
Price history
-14.9% since first listed3 events — show timeline
- 2026-04-23 Price Changed $200,000 Stellar MLS as Distributed by MLS Grid
- 2026-02-27 Price Changed $219,900 Stellar MLS as Distributed by MLS Grid
- 2026-01-07 Listed $235,000 Stellar MLS as Distributed by MLS Grid
Property tax history
+3.2%/yrLatest (2025): $999 · +4.5% YoY. Source: county tax records.
Cash-flow waterfall
monthlySold comps — $/sqft
last 12 mo · ≤1 miLoading sold comps…