9009 Richmond Ave #703 · Houston, TX
Flood risk 7/10 · Major
- FEMA flood zone
- X (unshaded)
- Chance of flooding over 30 yrs
- 0.99%
- Est. flood insurance / yr
- $507 – $1,088
Fire risk 1/10 · Minimal
- Est. fire insurance / yr
- $1,222 – $2,270
Heat risk 9/10 · Severe
- Hot days now (above 110°F)
- 7 days/yr
- Hot days in 30 yrs
- 23 days/yr
Wind risk 9/10 · Severe
- Chance of severe wind over 30 yrs
- 99.0%
Air-quality risk 2/10 · Minimal
- Unhealthy air days now
- 2 days/yr
- Unhealthy air days in 30 yrs
- 2 days/yr
Risk factors via First Street. Map © Google.
Why this score? — see what drove the D grade
The composite is a weighted blend of 9 inputs, each scored 0–100. Each bar is that input's sub-score; the figure is the points it added to the 100-point composite (weight × sub-score).
- ARV discount +15.0/15.0
- 1% rule +10.0/10.0
- Cash flow +8.1/30.0
- Livability +3.7/5.0
- Schools +2.7/10.0
- Condition / age +2.5/5.0
- DSCR +2.1/10.0
- Rent growth +0.9/5.0
- Appreciation +0.0/10.0
$59,900
🖨 Deal sheet (PDF) 📄 Offer letter ✓ Due diligence
Listing remarks MLS
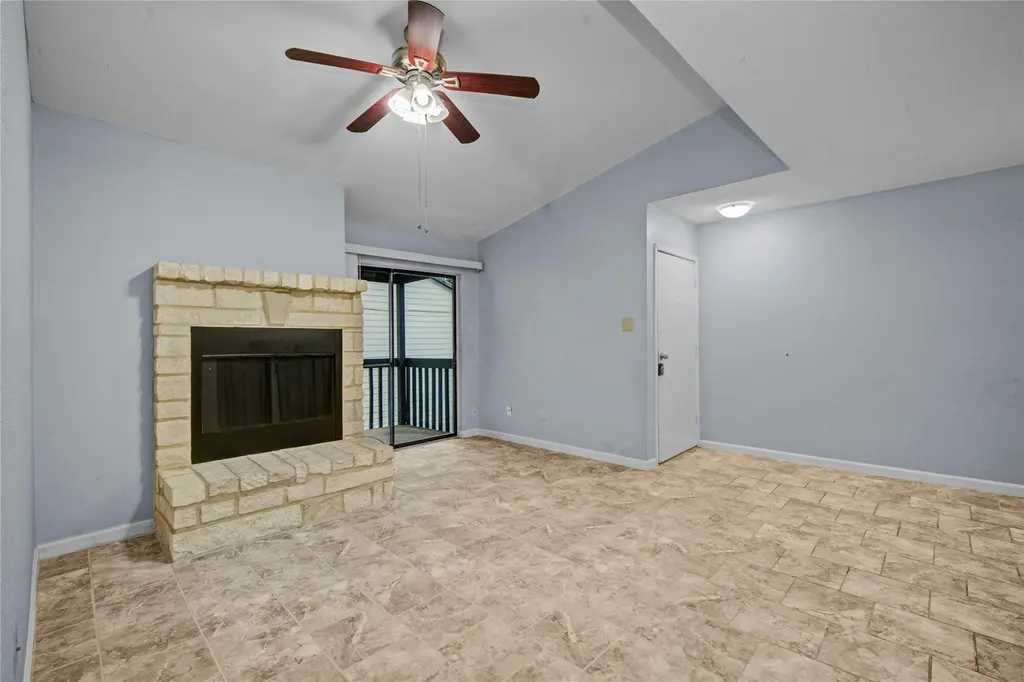
Beautiful 2-bedroom, 1 1/3 bath upstairs condo (2nd floor) located in the heart of Southwest Houston! The bathroom features a shower and dual sinks, with one sink privately connected to the primary bedroom. This home offers high ceilings, a wood burning fireplace, and a bright living area with access to a covered balcony that also includes exterior storage. The unit comes complete with a washer and dryer, plus one assigned covered parking space. Located in a gated community with a swimming pool and convenient access to the Galleria and major freeways. Excellent location and move-in ready—don’t miss this opportunity, schedule your tour today!
Key facts
- Gated community
- Exterior storage
- Covered balcony
Tags
Neighborhood map
What this means for you Summary
Snapshot
- This is a 2-bed/1.0-bath condo listed at $60k.
Deal economics
- At list price, monthly cash flow is $-126 ($-2k/yr) — negative.
- To cash-flow at today's rent, offer at most $38k (37.1% below list).
- Meets the 1% rule at list price ($1k rent vs $60k).
- Recommended offer: $38k (37.1% below list) — sets the bar for cash-flow.
- Cap rate 5.1% vs local median 3.1% in Houston — top-decile yield for the area; either an underpriced asset or a hidden risk that comps aren't pricing in. Stress-test before assuming the spread holds.
Location & tenants
- Location reads 74/100 on livability (#184 in TX, #4,771 nationally) — a middle-class / working-renter tenant base. Strengths: amenities A+, cost of living A+, housing A+; Watch: schools D, crime F.
- Houston ISD (urban): math 27% / reading 35% proficiency, ranked #593 of 826 in TX (top 72%) — families likely to look elsewhere, expect single-tenant / working-renter base with shorter leases; 71% free/reduced lunch — lower-income household profile, screen leases tightly.
- Market conditions: Rents falling (-6.3%/yr); 289 active listings in the ZIP; 40 comparable units currently listed for rent nearby; rentals leasing fast (median 12d on market — plan ~1-2 weeks tenant-placement turnaround); 29,883 units permitted in Harris County in 2024 (8,621 in 5+ unit buildings).
Forward outlook
- Local home prices are declining (-3.0%/yr); year-one equity from $414 of loan paydown is wiped out by about $2k of value loss. Plan a longer hold.
- Harris County population projected at +47% by 2050 — long-run rental-demand tailwind backs the buy-and-hold thesis.
Negotiation context
- It's been on market 118 days — a 9% lower offer ($55k) is reasonable based on typical stale-listing flexibility.
- 2 sale attempts since 6y ago; this cycle's ask has dropped $20k (25%) from the opening price — seller is motivated, your offer sets the floor, not the list.
- Current owner paid $10k; list at $60k implies a 470% gain — meaningful room to come down on a strong offer.
Risks & watch-outs
- Watch-outs: property tax is 3.0% of price; flood insurance adds $66/mo; HOA is 39% of rent.
- Climate carrying-cost: major flood risk; severe wind risk, 99% chance of damaging wind over 30y; extreme-heat days projected 7→23/yr by 2055 (HVAC capex compounding) — expect insurance premiums to compound above CPI over the hold.
Questions for the listing agent
- What do current leases actually rent for vs. the listed asking? Can we see a recent rent roll and the last 12 months of T-12 income?
- It's been on market 118 days. Have you received any prior offers? Is the seller open to a 37% concession, seller financing, or rate buy-down credit?
- Built in 1977 — when were the roof, HVAC, electrical panel, plumbing, and water heater last replaced?
- Property tax is high relative to price — has the assessment been appealed recently, and will the sale trigger a re-assessment?
- What's the actual annual flood-insurance premium (NFIP or private), and is the property in a SFHA with mandatory coverage?
- What does the HOA fee cover, when was the last increase, and are there any pending special assessments or reserve-fund shortfalls?
- Any open or pending special assessments — roof, HVAC, plumbing, elevator, façade? What's the per-unit balance and payoff schedule, and is the seller paying it off at close or rolling it to the buyer?
- Why hasn't it sold? Are there any deal-killer items the seller is aware of (foundation, flood, title, zoning, code violations)?
- Is there a deadline driving the sale (1031 exchange, divorce, estate, relocation)? That informs how much negotiation room exists.
- Schools are D-rated, which usually means shorter tenancies and higher turnover. Who's the typical renter profile here, and what's been the actual vacancy rate?
- Crime grade is F in this area — have there been break-ins, vandalism, or insurance claims at this property in the last 3 years? What carrier currently insures it and at what premium?
- The area grade is low — what's the realistic commute time and amenity access for the typical tenant pool here? Any planned neighborhood developments (good or bad) we should know about?
- What's the average days-on-market for RENTAL listings here right now (not sales)? A rising rental-DOM trend means longer vacancies and softer asking-rent achievability than the comps imply.
- What's the recent tenant-quality profile in this submarket — average credit score on applications, eviction rate, late-payment / NSF rate, and stable-employment percentage? A property-management company in the area should have these aggregated.
- How much new apartment / multifamily construction is in the pipeline within 1–3 miles? Heavy new supply (>2% of stock underway) typically softens rents 12–24 months out; light construction supports rent growth.
Investment metrics
- 1% rule
- 1.81% ✓
- Cap rate
- 5.11%
- Cash-on-cash
- -4.24%
- DSCR
- 0.81
- GRM
- 4.6
CMA / ARV
- ARV (median comp)
- $90,138
- List price
- $59,900
- Delta
- -33.55%
- Verdict
- UNDERPRICED
- Comps
- 20 within 1.0 mi
Projected returns pro-forma
-3.0% appreciation · 0.0% rent growth · sell at horizon
- IRR
- -41.8%
- Equity multiple
- -0.22×
- Total profit
- $-20,520
- Equity at exit
- $8,931
- IRR
- —
- Equity multiple
- -1.32×
- Total profit
- $-38,954
- Equity at exit
- $5,179
Cash invested: $16,772 (down + closing). Projections, not guarantees.
Landlord ↔ Tenant lean methodology
- Overall (STATE)
- 87 Strongly Landlord-Friendly
- State Texas
- 87 Strongly Landlord-Friendly · R+5
- County
- — inherits STATE
- City
- — inherits STATE
ZIP-level market 77063
- Rents YoY
- -6.3%
- Active inventory
- 289
- Price-to-rent
- 4.6×
Monthly cashflow live
- Estimated rent
- $1,082 high interval (Pro) →
- Mortgage (P&I)
- −$314
- Tax from tax record
- −$150 /mo · $1,801/yr
- Insurance
- −$25
- Flood insurance flood zone
- −$66 /mo · $798/yr
- HOA
- −$425
- Vacancy / Maint / Mgmt
- −$227
- Net cashflow
- $-126
Break-even live
Sensitivity live
| Price | -10% $-92 | -5% $-109 | +0% $-126 | +5% $-143 | +10% $-160 |
|---|---|---|---|---|---|
| Rent | -10% $-211 | -5% $-168 | +0% $-126 | +5% $-83 | +10% $-40 |
| Rate | -1.0pp $-96 | -0.5pp $-110 | base $-126 | +0.5pp $-141 | +1.0pp $-157 |
UW: 25.0% down · 7.5% · 30yr · 1.5% tax · 5.0% vac · 8.0% maint · 8.0% mgmt
Financing live
Cash to close
- Down payment
- $14,975
- Closing costs
- $1,797
- Reserves months
- —
- Total cash needed
- —
Loan-product check · same deal, 3 products live
Conventional
25% down · 7.5% · 30yr
- Down + closing
- —
- Monthly P&I
- —
- Monthly cashflow
- —
- DSCR
- —
- Eligible?
- —
Personal DTI + credit; lowest rate.
DSCR
20% down · 8.5% · 30yr
- Down + closing
- —
- Monthly P&I
- —
- Monthly cashflow
- —
- DSCR
- —
- Eligible?
- —
No personal income docs; deal must DSCR.
Hard money
10% down · 12.0% · 12mo
- Down + closing
- —
- Monthly P&I
- —
- Monthly cashflow
- —
- DSCR
- —
- Eligible?
- —
Short-term bridge; refi at stabilization.
Rent comps 40 comps
| Address | Beds | Baths | Sqft | Rent | $/sqft | DOM | Units | Dist |
|---|---|---|---|---|---|---|---|---|
| 9198 Richmond Ave Houston, TX | 1.0 | 1.0 | 753 | $1,225 | $1.63 | 17d | 1 | 0.10mi |
| 8996 Richmond Ave Houston, TX | 1.0 | 1.0 | 660 | $1,005 | $1.52 | 44d | 1 | 0.13mi |
| 8990 Richmond Ave Unit 422 Houston, TX | 2.0 | 2.0 | 857 | $1,140 | $1.33 | 8d | 1 | 0.20mi |
| 8990 Richmond Ave Unit 9011 Houston, TX | 1.0 | 1.0 | 539 | $820 | $1.52 | 0d | 1 | 0.20mi |
| 8990 Richmond Ave Unit 321 Houston, TX | 1.0 | 1.0 | 539 | $785 | $1.46 | 8d | 1 | 0.20mi |
| 8990 Richmond Ave Unit 9047 Houston, TX | 2.0 | 2.0 | 857 | $1,170 | $1.37 | 0d | 1 | 0.20mi |
| 8990 Richmond Ave Unit 2162 Houston, TX | 2.0 | 2.0 | 857 | $1,140 | $1.33 | 5d | 1 | 0.20mi |
| 8990 Richmond Ave Unit 9041 Houston, TX | 1.0 | 1.0 | 539 | $815 | $1.51 | 44d | 1 | 0.20mi |
| 8990 Richmond Ave Unit 9011 Houston, TX | 1.0 | 1.0 | 539 | $820 | $1.52 | 14d | 1 | 0.20mi |
| 8990 Richmond Ave Unit 1162 Houston, TX | 1.0 | 1.0 | 539 | $785 | $1.46 | 6d | 1 | 0.20mi |
| 8990 Richmond Ave Houston, TX | 1.0 | 1.0 | 539 | $774 | $1.44 | 13d | 1 | 0.21mi |
| 8990 Richmond Ave Unit 1047 Houston, TX | 1.0 | 1.0 | 539 | $824 | $1.53 | 4d | 1 | 0.21mi |
| 3401 Ocee St Houston, TX | 2.0 | 1.0 | 825 | $940 | $1.14 | 44d | 1 | 0.26mi |
| 9221 Pagewood Ln Unit 2047 Houston, TX | 2.0 | 2.0 | 804 | $1,045 | $1.30 | 0d | 1 | 0.28mi |
| 9221 Pagewood Ln Unit 2047 Houston, TX | 2.0 | 2.0 | 804 | $1,050 | $1.31 | 12d | 1 | 0.28mi |
| 9221 Pagewood Ln Unit 9272 Houston, TX | 1.0 | 1.0 | 668 | $749 | $1.12 | 13d | 1 | 0.32mi |
| 9221 Pagewood Ln Unit 1162 Houston, TX | 1.0 | 1.0 | 668 | $760 | $1.14 | 8d | 1 | 0.32mi |
| 9221 Pagewood Ln Unit 9295 Houston, TX | 1.0 | 1.0 | 668 | $795 | $1.19 | 0d | 1 | 0.32mi |
| 9221 Pagewood Ln Unit 2162 Houston, TX | 2.0 | 2.0 | 804 | $1,015 | $1.26 | 8d | 1 | 0.32mi |
| 2800 Jeanetta St Houston, TX | 1.0–2.0 | 1.0–2.0 | 746 | $1,300 | $1.74 | 0d | 6 | 0.44mi |
| 2748 Jeanetta St Houston, TX | 2.0 | 2.0 | 1035 | $1,489 | $1.44 | 44d | 1 | 0.53mi |
| 2742 Jeanetta St Houston, TX | 1.0 | 1.0 | 641 | $1,061 | $1.66 | 13d | 1 | 0.53mi |
| 2742 Jeanetta St Apt 321 Houston, TX | 1.0 | 1.0 | 641 | $1,072 | $1.67 | 8d | 1 | 0.56mi |
| 2742 Jeanetta St Unit 2174 Houston, TX | 2.0 | 2.0 | 860 | $1,277 | $1.48 | 13d | 1 | 0.56mi |
| 2742 Jeanetta St Unit 2763 Houston, TX | 1.0 | 1.0 | 641 | $1,093 | $1.71 | 14d | 1 | 0.56mi |
| 2742 Jeanetta St Unit 1162 Houston, TX | 1.0 | 1.0 | 641 | $1,072 | $1.67 | 6d | 1 | 0.56mi |
| 2742 Jeanetta St Unit 1148 Houston, TX | 1.0 | 1.0 | 641 | $1,107 | $1.73 | 0d | 1 | 0.56mi |
| 2742 Jeanetta St Unit 2112 Houston, TX | 2.0 | 2.0 | 860 | $1,272 | $1.48 | 0d | 1 | 0.56mi |
| 2742 Jeanetta St Unit 2799 Houston, TX | 2.0 | 2.0 | 860 | $1,266 | $1.47 | 11d | 1 | 0.56mi |
| 2742 Jeanetta St Unit 1174 Houston, TX | 1.0 | 1.0 | 641 | $1,112 | $1.73 | 11d | 1 | 0.56mi |
| 2742 Jeanetta St Apt 424 Houston, TX | 2.0 | 2.0 | 860 | $1,242 | $1.44 | 6d | 1 | 0.56mi |
| 2742 Jeanetta St Unit 2816 Houston, TX | 1.0 | 1.0 | 641 | $1,111 | $1.73 | 11d | 1 | 0.56mi |
| 2742 Jeanetta St Unit 422 Houston, TX | 2.0 | 2.0 | 860 | $1,242 | $1.44 | 8d | 1 | 0.56mi |
| 2724 Crossview Dr Unit 208 Houston, TX | 1.0 | 1.0 | 767 | $849 | $1.11 | 44d | 1 | 0.56mi |
| 2724 Crossview Dr Unit 205 Houston, TX | 2.0 | 1.0 | 790 | $799 | $1.01 | 44d | 1 | 0.56mi |
| 2724 Crossview Dr Unit 207 Houston, TX | 2.0 | 1.0 | 678 | $699 | $1.03 | 44d | 1 | 0.56mi |
| 3030 Dunvale Rd Houston, TX | 1.0–3.0 | 1.0–2.0 | 1107 | $1,518 | $1.37 | 0d | 24 | 0.63mi |
| 9233 Westheimer Rd Unit 9290 Houston, TX | 2.0 | 2.0 | 1099 | $1,614 | $1.47 | 44d | 1 | 0.63mi |
| 9233 Westheimer Rd Unit 1174 Houston, TX | 1.0 | 1.0 | 753 | $1,210 | $1.61 | 17d | 1 | 0.63mi |
| 9233 Westheimer Rd Unit 174 Houston, TX | 1.0 | 1.0 | 655 | $1,164 | $1.78 | 17d | 1 | 0.63mi |
HOA detail condo
- Monthly dues
- $425 · $5,100/yr
- Likely covers
- poolsecurity
- Assessments
- None detected in remarks — confirm with the listing agent.
Listing history 21 events
-
2026-06-21statusdays on market $59,900 Pending 118 DOM
-
2026-06-18days on market $59,900 Active 115 DOM
-
2026-06-17days on market $59,900 Active 114 DOM
-
2026-06-16days on market $59,900 Active 113 DOM
-
2026-06-15days on market $59,900 Active 112 DOM
-
2026-06-13pricedays on market $59,900 Active 110 DOM
-
2026-06-10days on market $69,900 Active 106 DOM
-
2026-06-08days on market $69,900 Active 105 DOM
-
2026-06-07pricedays on market $69,900 Active 104 DOM
-
2026-06-04days on market $74,900 Active 101 DOM
-
2026-06-01days on market $74,900 Active 98 DOM
-
2026-05-31days on market $74,900 Active 97 DOM
-
2026-05-19price $74,900 661-char remark
Show marketing remark (661 chars)
Beautiful 2-bedroom, 1 1/3 bath upstairs condo (2nd floor) located in the heart of Southwest Houston! The bathroom features a shower and dual sinks, with one sink privately connected to the primary bedroom. This home offers high ceilings, a wood burning fireplace, and a bright living area with access to a covered balcony that also includes exterior storage. The unit comes complete with a washer and dryer, plus one assigned covered parking space. Located in a gated community with a swimming pool and convenient access to the Galleria and major freeways. Excellent location and move-in ready—don’t miss this opportunity, schedule your tour today!
-
2026-02-23$79,900 Active 661-char remark
Show marketing remark (661 chars)
Beautiful 2-bedroom, 1 1/3 bath upstairs condo (2nd floor) located in the heart of Southwest Houston! The bathroom features a shower and dual sinks, with one sink privately connected to the primary bedroom. This home offers high ceilings, a wood burning fireplace, and a bright living area with access to a covered balcony that also includes exterior storage. The unit comes complete with a washer and dryer, plus one assigned covered parking space. Located in a gated community with a swimming pool and convenient access to the Galleria and major freeways. Excellent location and move-in ready—don’t miss this opportunity, schedule your tour today!
-
2025-04-14soldstatus
-
2020-10-09$1,100 Active
-
2020-10-09historical
-
2011-10-21soldstatus
-
2011-01-03soldstatus
-
1990-05-11soldstatus
-
1988-06-01soldstatus $10,500
ⓘ Source: listings_history table (triggers on properties + properties_extension) + one-shot
backfill from property_details.listing_events for pre-trigger history.
Tax reassessment forecast TX · Resets to sale price
- Current annual tax
- $1,801 · $150/mo
- Projected year-2 tax
- $1,801 · $150/mo
- Expected delta
- $0/yr ($0/mo · 0.0%)
ⓘ Screening estimate from a state-policy table — verify with the county assessor before closing.
Climate risk First Street
- Flood 7/10 Severe FEMA zone X (unshaded) · 99% chance over 30 yrs
- Wildfire 1/10 Low
- Heat 9/10 Extreme 7 d/yr ≥110°F today · 23 d/yr by 30 yrs out
- Wind 9/10 Extreme 99% chance of damaging wind over 30 yrs
- Air quality 2/10 Low 2 unhealthy d/yr today · 2 by 30 yrs out
Nearby sold comps map
Loading sold comps map…
Walkable amenities ~0.75 mi
Loading nearby amenities…
Taxation est. · year 1
- Rental income
- $12,985
- − Mortgage interest
- −$3,355
- − Property taxes
- −$1,801
- − Insurance
- −$1,097
- − Repairs & maintenance
- −$1,039
- − Management
- −$1,039
- − HOA
- −$5,100
- − Depreciation
- −$1,743
- Taxable loss
- −$2,188
- Est. tax savings @ 24.0%
- +$525
- After-tax cash flow
- $-984/yr
For passive investors: Depreciation is non-cash, so a rental often shows a tax loss while cash-flowing — sheltering income. Rental losses are passive: they offset passive income freely, and up to $25,000/yr can offset ordinary (W-2) income if you actively participate and your MAGI is under $100k (phasing out to $0 by $150k); unused losses carry forward. On sale, claimed depreciation is recaptured at up to 25%, and gains may owe capital-gains tax (a 1031 exchange can defer both). Figures are a year-1 estimate at your 24.0% rate — not tax advice; consult a CPA.
Schools (NCES district)
- District
- Houston ISD
- NCES district ID
- 4823640
- Math proficiency
- 27% ▼ -18.00%
- Reading proficiency
- 35% ▼ -6.00%
- Median HH income
- $46,054
- Composite
- 26.63/100
- National rank
- #7173
- State rank
- #593 of 826 in TX
Livability — Houston
- Score
- 74/100
- State rank
- #184
- US rank
- #4771
Category grades
Schools grade is shown separately in the Schools card above.
Census & demographics
- Census place
- Houston, TX
- County
- Harris County · 4,702,590 people
- City population
- 3,226,434
- Metro
- Houston-The Woodlands-Sugar Land, TX
- Population (ZIP)
- 42,690
- Household income
- $59,113
- Rent vs Own
- Severe rent burden
- 3541.0
Population outlook (Harris County) Hauer SSP2
- Today (2025)
- 5,571,493 people
- By 2030
- 6,089,821 · +9.3%
- By 2040
- 7,142,806 · +28.2%
- By 2050
- 8,185,864 · +46.9%
- By 2075
- 10,574,329 · +89.8%
- By 2100
- 12,109,958 · +117.4%
Race, ethnicity, and origin ACS 2023
- Neighborhood character
- Highly diverse neighborhood (Simpson 0.75)
- Race & ethnicity
- Hispanic / Latino 33% White 29% Black 21% Two or more races 17% Asian 13%
- Hispanic origin (detail)
- Mexican 13% Cuban 4%
- Common ancestry
- Lithuanian 1% Arab 1% Slovak 1%
- Foreign-born
- 43% · Canada, Jamaica, Vietnam
- Languages at home
- 48% English-only · Spanish 30% Other Indo-European 8% Other Asian/Pacific 3%
Political lean MEDSL · Harris
- 2024 margin
- Lean D (+5.5) · D 52.0% · R 46.4% · Other 1.6%
- 2008→2024 swing
- +3.9pp toward D · 2008: 1.6pp · 2024: 5.5pp
- All cycles
- 2024: D+5.5 2020: D+13.3 2016: D+12.4 2012: D+0.1 2008: D+1.6
Not yet ingested
- Civics
- —
Market trends
- HPI YoY
- ▼ -241.42%
- Current HPI
- 194.3803
- Rent YoY
- ▼ -6.28%
- Metro
- Houston-The Woodlands-Sugar Land, TX
- State GDP YoY
- ▲ 3.95%
- F500 in state
- 110
Industry mix (Fortune 500 HQ in TX)
| Industry | F500 HQs | Revenue |
|---|---|---|
| Energy | 16 | $1,198B |
|
||
| Technology | 5 | $198B |
|
||
| Engineering / Construction | 4 | $72B |
|
||
| Energy Services | 3 | $60B |
|
||
| Utilities | 3 | $41B |
|
||
| Healthcare | 2 | $330B |
|
||
Price history
+613.3% since first listed9 events — show timeline
- 2026-05-19 Price Changed $74,900 HARMLS
- 2026-02-23 Listed $79,900 HARMLS
- 2025-04-14 Sold (Public Records) — Public Records
- 2020-10-09 Listing Removed — HARMLS
- 2020-10-09 Listed $1,100 HARMLS
- 2011-10-21 Sold (Public Records) — Public Records
- 2011-01-03 Sold (Public Records) — Public Records
- 1990-05-11 Sold (Public Records) — Public Records
- 1988-06-01 Sold (Public Records) $10,500 Public Records
Property tax history
+7.7%/yrLatest (2025): $1,801 · +9.1% YoY. Source: county tax records.
Cash-flow waterfall
monthlySold comps — $/sqft
last 12 mo · ≤1 miLoading sold comps…