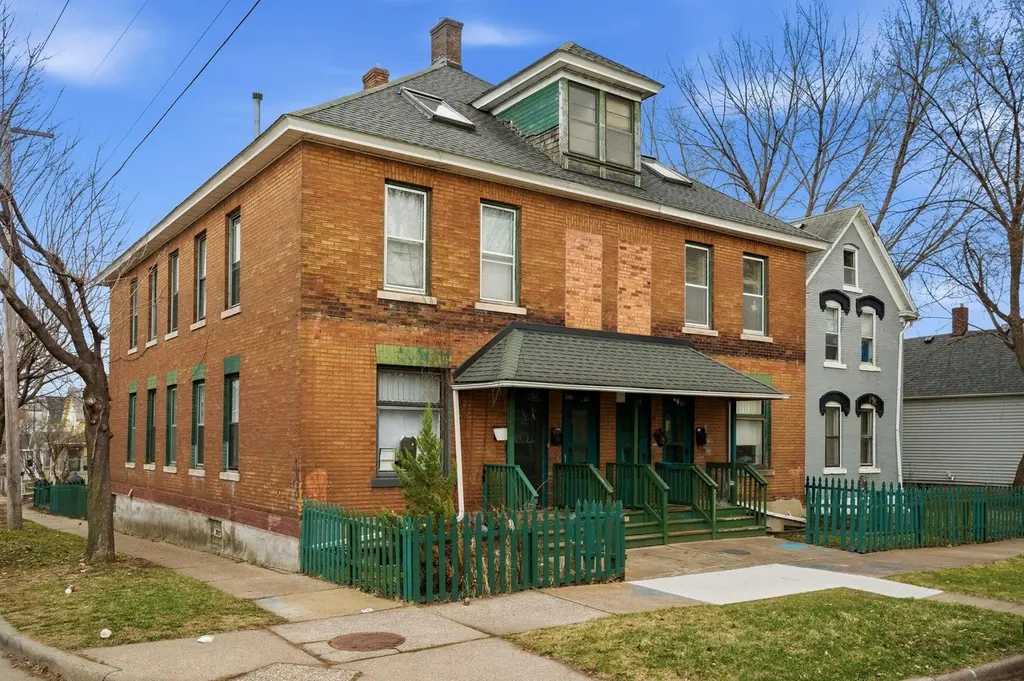
 Fourplex
686 Virginia St · St. Paul, MN
Flood risk 1/10 · Minimal
- FEMA flood zone
- X (unshaded)
- Chance of flooding over 30 yrs
- 0.0%
- Est. flood insurance / yr
- $473 – $860
Fire risk 1/10 · Minimal
- Est. fire insurance / yr
- $888 – $1,650
Heat risk 2/10 · Minimal
- Hot days now (above 99°F)
- 7 days/yr
- Hot days in 30 yrs
- 14 days/yr
Wind risk 2/10 · Minimal
- Chance of severe wind over 30 yrs
- —
Air-quality risk 2/10 · Minimal
- Unhealthy air days now
- 1 days/yr
- Unhealthy air days in 30 yrs
- 1 days/yr
Risk factors via First Street. Map © Google.
Why this score? — see what drove the B- grade
The composite is a weighted blend of 9 inputs, each scored 0–100. Each bar is that input's sub-score; the figure is the points it added to the 100-point composite (weight × sub-score).
- Cash flow +30.0/30.0
- DSCR +10.0/10.0
- 1% rule +9.0/10.0
- ARV discount +7.5/15.0
- Rent growth +3.5/5.0
- Livability +2.5/5.0
- Condition / age +2.5/5.0
- Schools +2.4/10.0
- Appreciation +0.0/10.0
$669,750
🖨 Deal sheet 📄 Offer letter ✓ Due diligence
Multi-family units
County records classify this as Multi-Family (5+ Unit). Listing-text estimate: 4 units. estimate disagrees with records
5+ unit building — per-unit beds/baths from public records are typically unavailable; the breakdown below (if shown) is an estimate from the listing text.
Listing remarks
Large brick fourplex in St Pauls North End neighborhood featuring spacious multi-level units with strong long-term rental appeal. Situated on a fenced corner lot with large shared yard space and front and rear porches for tenant enjoyment. Conveniently located near the State Capitol, Interstate 94, downtown St Paul, public transportation, and University Avenue shopping and dining. Utilities are currently partially owner-paid, with ownership implementing a RUBS utility reimbursement program across the portfolio beginning Q3 2026, creating additional NOI upside potential through utility cost recovery and operational efficiencies.
Key facts
- 5,625 sq ft lot
- 3 parking spots
- Built 1900
Property features AI
Finance
- Other: Property is not owner-occupied
- Financial info: Owner pays electricity, gas, insurance, grounds care, repairs, trash collection and water; Gross annual income reported at $74,784; Rental license: standard; rental license active; Tenants pay electricity, fuel and gas
Exterior
- Parking: Gravel, unassigned parking; Some units list 3 parking spaces
- Utilities: City water connected; City sewer connected; Electric service with circuit breakers; Fuel: electric and natural gas
- Home design: Residential income property; More than two stories; High ground topography
- Construction: Built with block, concrete and frame construction; Block and brick/mortar foundation; Asphalt pitched roof (over 8 years old); Basement: full, finished
- Exterior features: Front, rear and deck porches; Stone and wood exterior elements; Partial fencing; Corner lot with light tree coverage; Within six blocks of public transit; City street with curbs, paved streets and sidewalks; public maintained road
Interior
- Kitchen: Each unit includes range and refrigerator; Gas water heaters serving units
- Bedrooms: Total of 10 bedrooms across the building (various unit bedroom counts included)
- Bathrooms: Multiple full bathrooms (units include full bathrooms)
- Heating & cooling: Forced air heating; Some units include furnace humidifier; No central cooling in units
- Interior features: Finished basement with storage space and egress windows; Accessibility with 36+ inch doors
- Laundry & utility: Washer hookup and gas dryer hookup available; Laundry room and in-basement laundry options
Neighborhood map
What this means for you Summary
Snapshot
- This is a 4 × 2-bed/1.0-bath units multifamily listed at $670k.
Deal economics
- At list price, monthly cash flow is $3k ($33k/yr) — positive. Per door: $697/mo.
- The deal already cash-flows at list — no discount required.
- Meets the 1% rule at list price ($9k rent vs $670k).
- Recommended offer: $650k (3.0% below list) — sets the bar for market timing.
Location & tenants
- Location reads: area grade B — affects rentability + tenant quality, not the cash-flow math above.
- St. Paul Public School District (urban): math 21% / reading 33% proficiency, ranked #270 of 301 in MN (top 90%) — low school quality limits family demand, transient renter base, plan for 1-2y turnover; 64% free/reduced lunch — lower-income household profile, screen leases tightly.
- Market conditions: Rents rising fast (+4.0%/yr); 44 active listings in the ZIP; 1,202 units permitted in Ramsey County in 2024 (880 in 5+ unit buildings).
- At $9,399/mo this rent would consume 233% of the median local household income ($48k/yr) (locally 787% of renters already pay >50% of income on rent) — very limited rent-growth headroom before tenants either downsize or default.
Forward outlook
- Local home prices are declining (-3.0%/yr); year-one equity from $5k of loan paydown is wiped out by about $20k of value loss. Plan a longer hold.
- Ramsey County population projected at +27% by 2050 — long-run rental-demand tailwind backs the buy-and-hold thesis.
- At projected returns (-3.0% appreciation + 4.0% rent growth), your $188k cash investment doubles in ~7 years — after that, you're playing with house money.
Negotiation context
- It's been on market 34 days — a 3% lower offer ($650k) is reasonable based on typical stale-listing flexibility.
- Current owner paid $54k; list at $670k implies a 1140% gain — meaningful room to come down on a strong offer.
Risks & watch-outs
- Watch-outs: built in 1900 — expect roof / HVAC / electrical / plumbing capex.
Questions for the listing agent
- It's been on market 34 days. Have you received any prior offers? Is the seller open to a 3% concession, seller financing, or rate buy-down credit?
- Can we see the unit-by-unit rent roll, current vacancy, and any below-market leases? What's the average tenancy length?
- What capital expenditures (roof, boiler, parking lot, exteriors) have been made in the last 5 years, and what's planned in the next 2?
- Built in 1900 — when were the roof, HVAC, electrical panel, plumbing, and water heater last replaced?
- Is there a deadline driving the sale (1031 exchange, divorce, estate, relocation)? That informs how much negotiation room exists.
- What's the average days-on-market for RENTAL listings here right now (not sales)? A rising rental-DOM trend means longer vacancies and softer asking-rent achievability than the comps imply.
- What's the recent tenant-quality profile in this submarket — average credit score on applications, eviction rate, late-payment / NSF rate, and stable-employment percentage? A property-management company in the area should have these aggregated.
- How much new apartment / multifamily construction is in the pipeline within 1–3 miles? Heavy new supply (>2% of stock underway) typically softens rents 12–24 months out; light construction supports rent growth.
Investment metrics
- 1% rule
- 1.40% ✓
- Cap rate
- 11.29%
- Cash-on-cash
- 17.83%
- DSCR
- 1.79
- GRM
- 5.9
CMA / ARV
No comps found within radius.
Projected returns pro-forma
-3.0% appreciation · 4.05% rent growth · sell at horizon
- IRR
- 10.5%
- Equity multiple
- 1.42×
- Total profit
- $79,163
- Equity at exit
- $99,862
- IRR
- 20.5%
- Equity multiple
- 2.81×
- Total profit
- $340,167
- Equity at exit
- $57,908
Cash invested: $187,530 (down + closing). Projections, not guarantees.
Landlord ↔ Tenant lean methodology
- Overall (STATE)
- 46 Balanced
- State Minnesota
- 46 Balanced · D+2
- County
- — inherits STATE
- City
- — inherits STATE
ZIP-level market 55103
- Home prices YoY
- -9.0%
- Rents YoY
- 4.0%
- Active inventory
- 44
- Price-to-rent
- 23.8×
Monthly cashflow live
- Estimated rent
- $9,399 medium interval (Pro) →
- Mortgage (P&I)
- −$3,512
- Tax from tax record
- −$847 /mo · $10,162/yr
- Insurance
- −$279
- HOA
- −$0
- Vacancy / Maint / Mgmt
- −$1,974
- Net cashflow
- $2,787
Break-even live
4-unit breakdown (identical units grouped — click to expand)
| Units | Beds | Baths | Est. rent |
|---|---|---|---|
| 4× units | 2 | 1 | $9,400 |
| #1 | 2 | 1 | $2,350 |
| #2 | 2 | 1 | $2,350 |
| #3 | 2 | 1 | $2,350 |
| #4 | 2 | 1 | $2,350 |
| Total (4 units) | $9,399 | ||
UW: 25.0% down · 7.5% · 30yr · 1.5% tax · 5.0% vac · 8.0% maint · 8.0% mgmt
Financing live
Cash to close
- Down payment
- $167,438
- Closing costs
- $20,092
- Reserves months
- —
- Total cash needed
- —
Loan-product check · same deal, 3 products live
Conventional
25% down · 7.5% · 30yr
- Down + closing
- —
- Monthly P&I
- —
- Monthly cashflow
- —
- DSCR
- —
- Eligible?
- —
Personal DTI + credit; lowest rate.
DSCR
20% down · 8.5% · 30yr
- Down + closing
- —
- Monthly P&I
- —
- Monthly cashflow
- —
- DSCR
- —
- Eligible?
- —
No personal income docs; deal must DSCR.
Hard money
10% down · 12.0% · 12mo
- Down + closing
- —
- Monthly P&I
- —
- Monthly cashflow
- —
- DSCR
- —
- Eligible?
- —
Short-term bridge; refi at stabilization.
Listing history 16 events
-
2026-06-18days on market $669,750 Active 34 DOM
-
2026-06-17days on market $669,750 Active 33 DOM
-
2026-06-16days on market $669,750 Active 32 DOM
-
2026-06-15days on market $669,750 Active 31 DOM
-
2026-06-13days on market $669,750 Active 29 DOM
-
2026-06-09days on market $669,750 Active 25 DOM
-
2026-06-08days on market $669,750 Active 24 DOM
-
2026-06-07days on market $669,750 Active 23 DOM
-
2026-06-04days on market $669,750 Active 20 DOM
-
2026-06-03days on market $669,750 Active 19 DOM
-
2026-06-02days on market $669,750 Active 18 DOM
-
2026-06-01days on market $669,750 Active 17 DOM
-
2026-05-31days on market $669,750 Active 16 DOM
-
2026-05-16$669,750 Active 635-char remark
-
2026-05-15historical $669,750 635-char remark
-
2012-01-31soldstatus $54,000
ⓘ Source: listings_history table (triggers on properties + properties_extension) + one-shot
backfill from property_details.listing_events for pre-trigger history.
Tax reassessment forecast MN · Partial reset (capped growth)
- Current annual tax
- $10,162 · $847/mo
- Projected year-2 tax
- $10,162 · $847/mo
- Expected delta
- $0/yr ($0/mo · 0.0%)
ⓘ Screening estimate from a state-policy table — verify with the county assessor before closing.
Climate risk First Street
- Flood 1/10 Low FEMA zone X (unshaded) · 0% chance over 30 yrs
- Wildfire 1/10 Low
- Heat 2/10 Low 7 d/yr ≥99°F today · 14 d/yr by 30 yrs out
- Wind 2/10 Low
- Air quality 2/10 Low 1 unhealthy d/yr today · 1 by 30 yrs out
Nearby sold comps map
Loading sold comps map…
Walkable amenities ~0.75 mi
Loading nearby amenities…
Taxation est. · year 1
- Rental income
- $112,788
- − Mortgage interest
- −$37,516
- − Property taxes
- −$10,162
- − Insurance
- −$3,349
- − Repairs & maintenance
- −$9,023
- − Management
- −$9,023
- − Depreciation
- −$19,484
- Taxable income
- $24,231
- Est. tax owed @ 24.0%
- −$5,815
- After-tax cash flow
- $27,629/yr
For passive investors: Depreciation is non-cash, so a rental often shows a tax loss while cash-flowing — sheltering income. Rental losses are passive: they offset passive income freely, and up to $25,000/yr can offset ordinary (W-2) income if you actively participate and your MAGI is under $100k (phasing out to $0 by $150k); unused losses carry forward. On sale, claimed depreciation is recaptured at up to 25%, and gains may owe capital-gains tax (a 1031 exchange can defer both). Figures are a year-1 estimate at your 24.0% rate — not tax advice; consult a CPA.
Schools (NCES district)
- District
- St. Paul Public School District
- NCES district ID
- 2733840
- Math proficiency
- 21% ▼ -11.00%
- Reading proficiency
- 33% ▼ -7.00%
- Median HH income
- $48,316
- Composite
- 23.51/100
- National rank
- #7868
- State rank
- #270 of 301 in MN
Livability — St. Paul
No livability data for this city. (Only ~50 U.S. cities are tracked.)
Census & demographics
- Census place
- St. Paul, MN
- County
- Ramsey County · 542,837 people
- City population
- 280,599
- Metro
- Minneapolis-St. Paul-Bloomington, MN-WI
- Population (ZIP)
- 13,125
- Household income
- $48,390
- Rent vs Own
- Severe rent burden
- 787.0
Population outlook (Ramsey County) Hauer SSP2
- Today (2025)
- 603,431 people
- By 2030
- 636,459 · +5.5%
- By 2040
- 700,596 · +16.1%
- By 2050
- 765,819 · +26.9%
- By 2075
- 929,297 · +54.0%
- By 2100
- 1,053,924 · +74.7%
Race, ethnicity, and origin ACS 2023
- Neighborhood character
- Highly diverse neighborhood (Simpson 0.75)
- Race & ethnicity
- White 34% Black 28% Asian 22% Hispanic / Latino 12% Two or more races 9% Native American 1%
- Hispanic origin (detail)
- Mexican 6% Cuban 4%
- Common ancestry
- Portuguese 6% Lithuanian 2% Romanian 2%
- Foreign-born
- 26% · Vietnam, Canada, Philippines
- Languages at home
- 63% English-only · Other Asian/Pacific 16% Spanish 5% Vietnamese 3%
Political lean MEDSL · Ramsey
- 2024 margin
- Solid D (+43.3) · D 70.5% · R 27.2% · Other 2.3%
- 2008→2024 swing
- +9.4pp toward D · 2008: 33.9pp · 2024: 43.3pp
- All cycles
- 2024: D+43.3 2020: D+45.4 2016: D+39.4 2012: D+35.3 2008: D+33.9
Not yet ingested
- Civics
- —
Market trends
- HPI YoY
- ▼ -32.28%
- Current HPI
- 327.7672
- Rent YoY
- ▲ 4.05%
- Metro
- Minneapolis-St. Paul-Bloomington, MN-WI
- State GDP YoY
- ▲ 2.41%
- F500 in state
- 34
Industry mix (Fortune 500 HQ in MN)
| Industry | F500 HQs | Revenue |
|---|---|---|
| Healthcare | 2 | $407B |
|
||
| Retail | 2 | $150B |
|
||
| Consumer Goods | 2 | $32B |
|
||
| Industrial Machinery | 2 | $6B |
|
||
| Agriculture | 1 | $40B |
|
||
| Healthcare / Medical Devices | 1 | $32B |
|
||
Price history
+1140.3% since first listed3 events — show timeline
- 2026-05-16 Listed $669,750 NORTHSTARMLS as Distributed by MLS Grid
- 2026-05-15 Coming Soon $669,750 NORTHSTARMLS as Distributed by MLS Grid
- 2012-01-31 Sold (Public Records) $54,000 Public Records
Property tax history
+3.2%/yrLatest (2025): $10,162 · -12.3% YoY. Source: county tax records.
Cash-flow waterfall
monthlySold comps — $/sqft
last 12 mo · ≤1 miLoading sold comps…