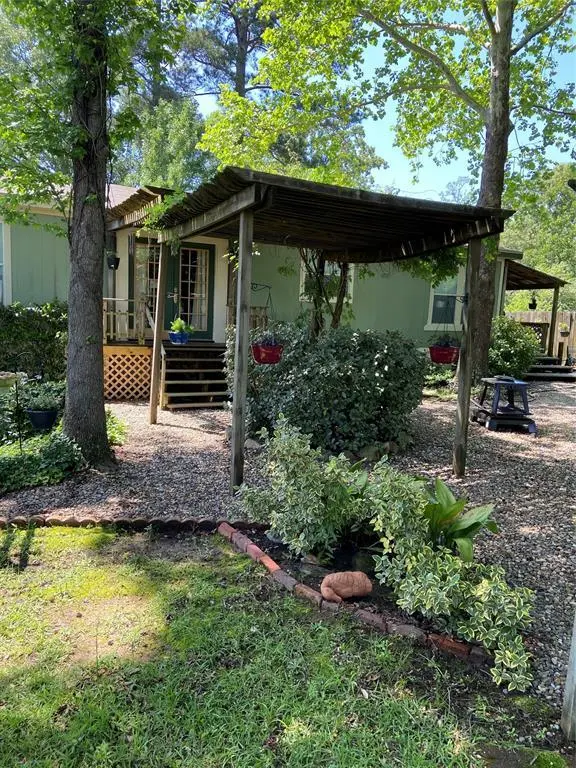
287 Byrd Cir · Scottsville, TX
Flood risk 1/10 · Minimal
- FEMA flood zone
- X (unshaded)
- Chance of flooding over 30 yrs
- 0.0%
- Est. flood insurance / yr
- $507 – $1,088
Fire risk 5/10 · Moderate
- Est. fire insurance / yr
- $1,222 – $2,270
Heat risk 7/10 · Major
- Hot days now (above 110°F)
- 7 days/yr
- Hot days in 30 yrs
- 23 days/yr
Wind risk 6/10 · Moderate
- Chance of severe wind over 30 yrs
- 66.0%
Air-quality risk 2/10 · Minimal
- Unhealthy air days now
- 2 days/yr
- Unhealthy air days in 30 yrs
- 2 days/yr
Risk factors via First Street. Map © Google.
Why this score? — see what drove the C+ grade
The composite is a weighted blend of 9 inputs, each scored 0–100. Each bar is that input's sub-score; the figure is the points it added to the 100-point composite (weight × sub-score).
- Cash flow +24.4/30.0
- DSCR +7.9/10.0
- ARV discount +7.5/15.0
- 1% rule +5.2/10.0
- Appreciation +5.0/10.0
- Schools +3.0/10.0
- Livability +3.0/5.0
- Rent growth +2.5/5.0
- Condition / age +2.5/5.0
$119,900
🖨 Deal sheet (PDF) 📄 Offer letter ✓ Due diligence
Listing remarks
Nestled on nearly an acre in Karnack, this charming 3-bedroom, 2-bath home offers 1,456 square feet of comfortable living space with plenty of room to enjoy the outdoors. Whether you're looking for a peaceful retreat or space to grow, this property combines country charm, privacy, and everyday convenience. All in a beautiful setting.
Key facts
- 0.86 acre lot
- Garage
- Built 1995
Property features AI
Finance
- Other: Listing is active and offered with an exclusive agency agreement; Possession is negotiable
- Financial info: Accepts Cash, Conventional, FHA, and USDA financing; No second mortgage indicated
- HOA & community: No homeowners association
Exterior
- Parking: Attached garage (1 garage space); 1 covered parking space; No carport spaces
- Security: No smart home or security features listed
- Utilities: City water; Aerobic septic; No municipal utility district
- Home design: Single family residence; Residential property; Built in 1995; One story
- Construction: Composition roof; Property not attached to neighboring homes
- Exterior features: Lot in subdivision Rolling Acres; Lot about 0.861 acre; Directions available to property
Interior
- Kitchen: Kitchen on main level (approx. 14 x 15); Dishwasher; Electric oven; Electric range
- Bedrooms: Primary bedroom on main level (approx. 12 x 12); Two additional bedrooms on main level (each approx. 10 x 10) — total 3 bedrooms
- Flooring: No flooring information provided
- Bathrooms: Two full bathrooms (primary bath and one additional bath)
- Heating & cooling: Central heating (electric); Central air conditioning (electric)
- Interior features: One-level home; 8 total rooms; Living area of approximately 1456; Other interior features
- Laundry & utility: No specific laundry details provided
Neighborhood map
What this means for you Summary
Snapshot
- This is a 3-bed/2.0-bath manufactured listed at $120k.
Deal economics
- At list price, monthly cash flow is $244 ($3k/yr) — positive.
- The deal already cash-flows at list — no discount required.
- Meets the 1% rule at list price ($1k rent vs $120k).
Location & tenants
- Location reads 59/100 on livability (#1,109 in TX) — a working-class tenant base; expect higher turnover. Strengths: cost of living A+, housing A+; Watch: crime D, schools F, amenities F.
- Karnack ISD (rural): math 30% / reading 35% proficiency, ranked #960 of 1,141 in TX (top 84%) — families likely to look elsewhere, expect single-tenant / working-renter base with shorter leases; 86% free/reduced lunch — lower-income household profile, screen leases tightly.
- Market conditions: 39 active listings in the ZIP; 85 units permitted in Harrison County in 2024 (15 in 5+ unit buildings).
Forward outlook
- In year one you build about $4k of equity ($829 loan paydown + $4k appreciation (3.0% local appreciation)).
- At projected returns (3.0% appreciation + 3.0% rent growth), your $34k cash investment doubles in ~5 years — after that, you're playing with house money.
- By year 8, paydown + projected appreciation supports a ~$33k cash-out refi (75% LTV) — recoverable capital for the next deal without selling this one.
Negotiation context
- Only 12 days on market — expect competitive offers; lowballing is unlikely to land.
Risks & watch-outs
- Climate carrying-cost: major wind risk, 66% chance of damaging wind over 30y; moderate wildfire risk; extreme-heat days projected 7→23/yr by 2055 (HVAC capex compounding) — expect insurance premiums to compound above CPI over the hold.
Questions for the listing agent
- Is there a deadline driving the sale (1031 exchange, divorce, estate, relocation)? That informs how much negotiation room exists.
- Schools are F-rated, which usually means shorter tenancies and higher turnover. Who's the typical renter profile here, and what's been the actual vacancy rate?
- Crime grade is D in this area — have there been break-ins, vandalism, or insurance claims at this property in the last 3 years? What carrier currently insures it and at what premium?
- What's the average days-on-market for RENTAL listings here right now (not sales)? A rising rental-DOM trend means longer vacancies and softer asking-rent achievability than the comps imply.
- What's the recent tenant-quality profile in this submarket — average credit score on applications, eviction rate, late-payment / NSF rate, and stable-employment percentage? A property-management company in the area should have these aggregated.
- How much new for-sale + rental construction is in the pipeline within 1–3 miles? Heavy new supply typically softens prices + rents 12–24 months out; constrained supply supports both.
Investment metrics
- 1% rule
- 1.02% ✓
- Cap rate
- 8.73%
- Cash-on-cash
- 8.70%
- DSCR
- 1.39
- GRM
- 8.2
CMA / ARV
No comps found within radius.
Projected returns pro-forma
3.0% appreciation · 3.0% rent growth · sell at horizon
- IRR
- 15.6%
- Equity multiple
- 1.89×
- Total profit
- $29,907
- Equity at exit
- $53,912
- IRR
- 17.2%
- Equity multiple
- 3.52×
- Total profit
- $84,686
- Equity at exit
- $83,085
Cash invested: $33,572 (down + closing). Projections, not guarantees.
Landlord ↔ Tenant lean methodology
- Overall (STATE)
- 87 Strongly Landlord-Friendly
- State Texas
- 87 Strongly Landlord-Friendly · R+5
- County
- — inherits STATE
- City
- — inherits STATE
ZIP-level market 75661
- Active inventory
- 39
- Price-to-rent
- 8.2×
Monthly cashflow live
- Estimated rent
- $1,224 medium interval (Pro) →
- Mortgage (P&I)
- −$629
- Tax from tax record
- −$45 /mo · $541/yr
- Insurance
- −$50
- HOA
- −$0
- Vacancy / Maint / Mgmt
- −$257
- Net cashflow
- $244
Break-even live
Sensitivity live
| Price | -10% $311 | -5% $277 | +0% $244 | +5% $210 | +10% $176 |
|---|---|---|---|---|---|
| Rent | -10% $147 | -5% $195 | +0% $244 | +5% $292 | +10% $340 |
| Rate | -1.0pp $304 | -0.5pp $274 | base $244 | +0.5pp $212 | +1.0pp $181 |
UW: 25.0% down · 7.5% · 30yr · 1.5% tax · 5.0% vac · 8.0% maint · 8.0% mgmt
Financing live
Cash to close
- Down payment
- $29,975
- Closing costs
- $3,597
- Reserves months
- —
- Total cash needed
- —
Loan-product check · same deal, 3 products live
Conventional
25% down · 7.5% · 30yr
- Down + closing
- —
- Monthly P&I
- —
- Monthly cashflow
- —
- DSCR
- —
- Eligible?
- —
Personal DTI + credit; lowest rate.
DSCR
20% down · 8.5% · 30yr
- Down + closing
- —
- Monthly P&I
- —
- Monthly cashflow
- —
- DSCR
- —
- Eligible?
- —
No personal income docs; deal must DSCR.
Hard money
10% down · 12.0% · 12mo
- Down + closing
- —
- Monthly P&I
- —
- Monthly cashflow
- —
- DSCR
- —
- Eligible?
- —
Short-term bridge; refi at stabilization.
Listing history 9 events
-
2026-06-21days on market $119,900 Active 12 DOM
-
2026-06-18days on market $119,900 Active 10 DOM
-
2026-06-17days on market $119,900 Active 9 DOM
-
2026-06-16days on market $119,900 Active 8 DOM
-
2026-06-15days on market $119,900 Active 7 DOM
-
2026-06-13days on market $119,900 Active 5 DOM
-
2026-06-12days on market $119,900 Active 4 DOM
-
2026-06-09remarks 335-char remark
-
2026-06-09$119,900 Active 1 DOM
ⓘ Source: listings_history table (triggers on properties + properties_extension) + one-shot
backfill from property_details.listing_events for pre-trigger history.
Tax reassessment forecast TX · Resets to sale price
- Current annual tax
- $541 · $45/mo
- Projected year-2 tax
- $2,194 · $183/mo
- Expected delta
- +$1,653/yr (+$138/mo · 305.3%)
ⓘ Screening estimate from a state-policy table — verify with the county assessor before closing.
Climate risk First Street
- Flood 1/10 Low FEMA zone X (unshaded) · 0% chance over 30 yrs
- Wildfire 5/10 Major
- Heat 7/10 Severe 7 d/yr ≥110°F today · 23 d/yr by 30 yrs out
- Wind 6/10 Major 66% chance of damaging wind over 30 yrs
- Air quality 2/10 Low 2 unhealthy d/yr today · 2 by 30 yrs out
Nearby sold comps map
Loading sold comps map…
Walkable amenities ~0.75 mi
Loading nearby amenities…
Taxation est. · year 1
- Rental income
- $14,694
- − Mortgage interest
- −$6,716
- − Property taxes
- −$541
- − Insurance
- −$600
- − Repairs & maintenance
- −$1,176
- − Management
- −$1,176
- − Depreciation
- −$3,488
- Taxable income
- $998
- Est. tax owed @ 24.0%
- −$239
- After-tax cash flow
- $2,683/yr
For passive investors: Depreciation is non-cash, so a rental often shows a tax loss while cash-flowing — sheltering income. Rental losses are passive: they offset passive income freely, and up to $25,000/yr can offset ordinary (W-2) income if you actively participate and your MAGI is under $100k (phasing out to $0 by $150k); unused losses carry forward. On sale, claimed depreciation is recaptured at up to 25%, and gains may owe capital-gains tax (a 1031 exchange can defer both). Figures are a year-1 estimate at your 24.0% rate — not tax advice; consult a CPA.
Schools (NCES district)
- District
- Karnack ISD
- NCES district ID
- 4825110
- Math proficiency
- 30% ▼ -5.00%
- Reading proficiency
- 35% ▲ 15.00%
- Median HH income
- $42,554
- Composite
- 30.29/100
- National rank
- #11554
- State rank
- #960 of 1141 in TX
Livability — Scottsville
- Score
- 59/100
- State rank
- #1109
- US rank
- #19642
Category grades
Schools grade is shown separately in the Schools card above.
Census & demographics
- Population (ZIP)
- 2,692
Population outlook (Harrison County) Hauer SSP2
- Today (2025)
- 68,691 people
- By 2030
- 69,317 · +0.9%
- By 2040
- 69,973 · +1.9%
- By 2050
- 70,090 · +2.0%
- By 2075
- 70,607 · +2.8%
- By 2100
- 67,546 · -1.7%
Race, ethnicity, and origin ACS 2023
- Neighborhood character
- Diverse neighborhood (Simpson 0.67)
- Race & ethnicity
- White 45% Hispanic / Latino 31% Black 17% Two or more races 6%
- Hispanic origin (detail)
- Mexican 31%
- Common ancestry
- Lithuanian 5% Slovak 1% Romanian 1%
- Foreign-born
- 5% · Canada
- Languages at home
- 88% English-only · Spanish 12%
Political lean MEDSL · Harrison
- 2024 margin
- Solid R (+50.6) · D 24.4% · R 75.0%
- 2008→2024 swing
- -19.2pp toward R · 2008: -31.4pp · 2024: -50.6pp
- All cycles
- 2024: R+50.6 2020: R+45.6 2016: R+43.9 2012: R+34.6 2008: R+31.4
Not yet ingested
- Civics
- —
Market trends
- HPI YoY
- —
- Current HPI
- —
- Rent YoY
- —
- Metro
- —
- State GDP YoY
- ▲ 3.95%
- F500 in state
- 110
Industry mix (Fortune 500 HQ in TX)
| Industry | F500 HQs | Revenue |
|---|---|---|
| Energy | 16 | $1,198B |
|
||
| Technology | 5 | $198B |
|
||
| Engineering / Construction | 4 | $72B |
|
||
| Energy Services | 3 | $60B |
|
||
| Utilities | 3 | $41B |
|
||
| Healthcare | 2 | $330B |
|
||
Price history
3 events — show timeline
- 2026-06-08 Listed $119,900 NTREIS
- 2006-05-05 Sold (Public Records) — Public Records
- 1986-10-22 Sold (Public Records) — Public Records
Property tax history
-3.5%/yrLatest (2025): $541 · +5.4% YoY. Source: county tax records.
Cash-flow waterfall
monthlySold comps — $/sqft
last 12 mo · ≤1 miLoading sold comps…