 Multi-family
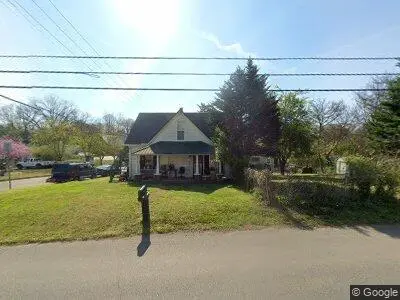
1280 E Harper Ave · Maryville, TN
Flood risk 1/10 · Minimal
- FEMA flood zone
- X (unshaded)
- Chance of flooding over 30 yrs
- 0.0%
- Est. flood insurance / yr
- $507 – $1,088
Fire risk 2/10 · Minimal
- Est. fire insurance / yr
- $949 – $1,763
Heat risk 6/10 · Moderate
- Hot days now (above 103°F)
- 7 days/yr
- Hot days in 30 yrs
- 20 days/yr
Wind risk 2/10 · Minimal
- Chance of severe wind over 30 yrs
- —
Air-quality risk 3/10 · Minor
- Unhealthy air days now
- 2 days/yr
- Unhealthy air days in 30 yrs
- 3 days/yr
Risk factors via First Street. Map © Google.
Why this score? — see what drove the B- grade
The composite is a weighted blend of 9 inputs, each scored 0–100. Each bar is that input's sub-score; the figure is the points it added to the 100-point composite (weight × sub-score).
- Cash flow +27.4/30.0
- DSCR +9.6/10.0
- ARV discount +7.5/15.0
- 1% rule +6.9/10.0
- Schools +4.8/10.0
- Rent growth +3.8/5.0
- Livability +3.6/5.0
- Condition / age +2.5/5.0
- Appreciation +0.0/10.0
$150,000
🖨 Deal sheet (PDF) 📄 Offer letter ✓ Due diligence
Multi-family units
County records classify this as Multi-Family (2-4 Unit). Listing-text estimate: 1 unit. estimate disagrees with records
Listing remarks MLS
Located on a corner Lot in the City of Maryville, this property has the potential to be a great Rental. Some remodeling started, but incomplete; has potential for additional Bedrooms. Partially finished area on 2nd story with outside entrance, not included in sq. ft. Days 1-7: Offers will not be reviewed; Days 8-12: Offers ONLY from NSP buyers, Municipalities, Non-profits and OWNER-OCCUPANTS; Days 13+: Offers from ALL buyers.
Key facts
- Built 2003
Neighborhood map
What this means for you Summary
Snapshot
- This is a 1-bed/2.0-bath multifamily listed at $150k.
Deal economics
- At list price, monthly cash flow is $437 ($5k/yr) — positive.
- The deal already cash-flows at list — no discount required.
- Meets the 1% rule at list price ($2k rent vs $150k).
- Cap rate 9.8% vs local median 3.6% in Maryville — top-decile yield for the area; either an underpriced asset or a hidden risk that comps aren't pricing in. Stress-test before assuming the spread holds.
Location & tenants
- Location reads 71/100 on livability (#38 in TN) — a middle-class / working-renter tenant base. Strengths: crime A+, cost of living A+, housing A+; Watch: amenities D, commute F, health & safety F.
- Maryville (suburban): math 58% / reading 55% proficiency, ranked #5 of 139 in TN (top 4%) — acceptable for families but not a draw, mixed tenant base, ~2y average lease.
- Zoned schools: John Sevier Elementary (math 67% / reading 52%, grade B-, #60 of 952 statewide, top 7%, 613 students, 0% FRL); Coulter Grove Intermediate School (math 60% / reading 56%, grade B, #9 of 333 statewide, top 2%, 881 students, 0% FRL); Maryville High School (math 15% / reading 60%, grade F, #32 of 332 statewide, top 9%, 1,242 students, 0% FRL) — zoned schools average 0% FRL vs 26% district-wide (26 pts lower); this property's tenant base skews higher-income than the district average.
- Market conditions: Rents rising fast (+5.3%/yr); 137 active listings in the ZIP; 4 comparable units currently listed for rent nearby; rentals at typical pace (median 25d on market — plan ~3-4 weeks tenant-placement turnaround); solid renter incomes; 937 units permitted in Blount County in 2024 (57 in 5+ unit buildings).
Forward outlook
- Local home prices are declining (-3.0%/yr); year-one equity from $1k of loan paydown is wiped out by about $4k of value loss. Plan a longer hold.
- Blount County population projected at +8% by 2050 — modest demand growth; plan on rents tracking national, not racing it.
- At projected returns (-3.0% appreciation + 5.3% rent growth), your $42k cash investment doubles in ~8 years — after that, you're playing with house money.
Negotiation context
- Only 0 days on market — expect competitive offers; lowballing is unlikely to land.
- 5 sale attempts since 20y ago with the ask held roughly flat each time — persistent listings suggest the price (not the market) is what's stuck; bring a comps-based counter.
- Current owner paid $125k; 20% above their basis — modest negotiation headroom, anchor on the comps not their cost.
Risks & watch-outs
- Climate carrying-cost: extreme-heat days projected 7→20/yr by 2055 (HVAC capex compounding) — expect insurance premiums to compound above CPI over the hold.
Questions for the listing agent
- Is there a deadline driving the sale (1031 exchange, divorce, estate, relocation)? That informs how much negotiation room exists.
- What's the average days-on-market for RENTAL listings here right now (not sales)? A rising rental-DOM trend means longer vacancies and softer asking-rent achievability than the comps imply.
- What's the recent tenant-quality profile in this submarket — average credit score on applications, eviction rate, late-payment / NSF rate, and stable-employment percentage? A property-management company in the area should have these aggregated.
- How much new apartment / multifamily construction is in the pipeline within 1–3 miles? Heavy new supply (>2% of stock underway) typically softens rents 12–24 months out; light construction supports rent growth.
Investment metrics
- 1% rule
- 1.19% ✓
- Cap rate
- 9.79%
- Cash-on-cash
- 12.49%
- DSCR
- 1.56
- GRM
- 7.0
CMA / ARV
No comps found within radius.
Projected returns pro-forma
-3.0% appreciation · 5.29% rent growth · sell at horizon
- IRR
- 4.6%
- Equity multiple
- 1.18×
- Total profit
- $7,744
- Equity at exit
- $22,365
- IRR
- 16.1%
- Equity multiple
- 2.44×
- Total profit
- $60,680
- Equity at exit
- $12,969
Cash invested: $42,000 (down + closing). Projections, not guarantees.
Landlord ↔ Tenant lean methodology
- Overall (STATE)
- 87 Strongly Landlord-Friendly
- State Tennessee
- 87 Strongly Landlord-Friendly · R+13
- County
- — inherits STATE
- City
- — inherits STATE
ZIP-level market 37804
- Home prices YoY
- -15.4%
- Rents YoY
- 5.3%
- Active inventory
- 137
- Price-to-rent
- 7.0×
Monthly cashflow live
- Estimated rent
- $1,788 medium interval (Pro) →
- Mortgage (P&I)
- −$787
- Tax from tax record
- −$126 /mo · $1,515/yr
- Insurance
- −$62
- HOA
- −$0
- Vacancy / Maint / Mgmt
- −$375
- Net cashflow
- $437
Break-even live
Sensitivity live
| Price | -10% $522 | -5% $480 | +0% $437 | +5% $395 | +10% $352 |
|---|---|---|---|---|---|
| Rent | -10% $296 | -5% $367 | +0% $437 | +5% $508 | +10% $578 |
| Rate | -1.0pp $513 | -0.5pp $475 | base $437 | +0.5pp $398 | +1.0pp $359 |
UW: 25.0% down · 7.5% · 30yr · 1.5% tax · 5.0% vac · 8.0% maint · 8.0% mgmt
Financing live
Cash to close
- Down payment
- $37,500
- Closing costs
- $4,500
- Reserves months
- —
- Total cash needed
- —
Loan-product check · same deal, 3 products live
Conventional
25% down · 7.5% · 30yr
- Down + closing
- —
- Monthly P&I
- —
- Monthly cashflow
- —
- DSCR
- —
- Eligible?
- —
Personal DTI + credit; lowest rate.
DSCR
20% down · 8.5% · 30yr
- Down + closing
- —
- Monthly P&I
- —
- Monthly cashflow
- —
- DSCR
- —
- Eligible?
- —
No personal income docs; deal must DSCR.
Hard money
10% down · 12.0% · 12mo
- Down + closing
- —
- Monthly P&I
- —
- Monthly cashflow
- —
- DSCR
- —
- Eligible?
- —
Short-term bridge; refi at stabilization.
Rent comps 4 comps
| Address | Beds | Baths | Sqft | Rent | $/sqft | DOM | Units | Dist |
|---|---|---|---|---|---|---|---|---|
| 605 Wright Rd Maryville, TN | 1.0 | 1.0 | 1248 | $850 | $0.68 | 25d | 1 | 0.30mi |
| 410 E Church Ave Unit 1 Maryville, TN | 2.0 | 2.0 | 1193 | $2,250 | $1.89 | 16d | 1 | 0.73mi |
| 913 Naomi Dr Unit Naomi- 918 Maryville, TN | 2.0 | 1.5 | 1075 | $1,398 | $1.30 | 25d | 1 | 1.39mi |
| 100 Vintage Alcoa Way Alcoa, TN | 1.0–3.0 | 1.0–2.0 | 1077 | $1,642 | $1.52 | 13d | 12 | 1.50mi |
Listing history 10 events
-
2026-05-26$150,000
-
2026-04-20soldstatus $125,000
-
2012-06-04soldstatus $20,000 429-char remark
Show marketing remark (429 chars)
Located on a corner Lot in the City of Maryville, this property has the potential to be a great Rental. Some remodeling started, but incomplete; has potential for additional Bedrooms. Partially finished area on 2nd story with outside entrance, not included in sq. ft. Days 1-7: Offers will not be reviewed; Days 8-12: Offers ONLY from NSP buyers, Municipalities, Non-profits and OWNER-OCCUPANTS; Days 13+: Offers from ALL buyers.
-
2012-04-05$24,900 429-char remark
Show marketing remark (429 chars)
Located on a corner Lot in the City of Maryville, this property has the potential to be a great Rental. Some remodeling started, but incomplete; has potential for additional Bedrooms. Partially finished area on 2nd story with outside entrance, not included in sq. ft. Days 1-7: Offers will not be reviewed; Days 8-12: Offers ONLY from NSP buyers, Municipalities, Non-profits and OWNER-OCCUPANTS; Days 13+: Offers from ALL buyers.
-
2011-12-08$24,900
-
2009-02-17$135,000
-
2006-11-06soldstatus $92,000
-
2006-11-06soldstatus $92,000
-
2006-10-27soldstatus $92,000
-
2006-04-19$85,900
ⓘ Source: listings_history table (triggers on properties + properties_extension) + one-shot
backfill from property_details.listing_events for pre-trigger history.
Tax reassessment forecast TN · Resets to sale price
- Current annual tax
- $1,515 · $126/mo
- Projected year-2 tax
- $1,515 · $126/mo
- Expected delta
- $0/yr ($0/mo · 0.0%)
ⓘ Screening estimate from a state-policy table — verify with the county assessor before closing.
Climate risk First Street
- Flood 1/10 Low FEMA zone X (unshaded) · 0% chance over 30 yrs
- Wildfire 2/10 Low
- Heat 6/10 Major 7 d/yr ≥103°F today · 20 d/yr by 30 yrs out
- Wind 2/10 Low
- Air quality 3/10 Moderate 2 unhealthy d/yr today · 3 by 30 yrs out
Nearby sold comps map
Loading sold comps map…
Walkable amenities ~0.75 mi
Loading nearby amenities…
Taxation est. · year 1
- Rental income
- $21,457
- − Mortgage interest
- −$8,402
- − Property taxes
- −$1,515
- − Insurance
- −$750
- − Repairs & maintenance
- −$1,717
- − Management
- −$1,717
- − Depreciation
- −$4,364
- Taxable income
- $2,993
- Est. tax owed @ 24.0%
- −$718
- After-tax cash flow
- $4,528/yr
For passive investors: Depreciation is non-cash, so a rental often shows a tax loss while cash-flowing — sheltering income. Rental losses are passive: they offset passive income freely, and up to $25,000/yr can offset ordinary (W-2) income if you actively participate and your MAGI is under $100k (phasing out to $0 by $150k); unused losses carry forward. On sale, claimed depreciation is recaptured at up to 25%, and gains may owe capital-gains tax (a 1031 exchange can defer both). Figures are a year-1 estimate at your 24.0% rate — not tax advice; consult a CPA.
Schools (NCES district)
- District
- Maryville
- NCES district ID
- 4702700
- Math proficiency
- 58% ▼ -3.00%
- Reading proficiency
- 55% ▼ -3.00%
- Median HH income
- $52,318
- Composite
- 48.42/100
- National rank
- #2134
- State rank
- #5 of 139 in TN
Livability — Maryville
- Score
- 71/100
- State rank
- #38
- US rank
- #6533
Category grades
Schools grade is shown separately in the Schools card above.
Census & demographics
- Census place
- Maryville, TN
- County
- Blount County · 112,418 people
- City population
- 89,294
- Metro
- Knoxville, TN
- Population (ZIP)
- 27,382
- Household income
- $79,025
- Rent vs Own
- Severe rent burden
- 466.0
Population outlook (Blount County) Hauer SSP2
- Today (2025)
- 135,873 people
- By 2030
- 139,460 · +2.6%
- By 2040
- 144,767 · +6.5%
- By 2050
- 147,393 · +8.5%
- By 2075
- 151,597 · +11.6%
- By 2100
- 147,393 · +8.5%
Race, ethnicity, and origin ACS 2023
- Neighborhood character
- Predominantly White (87%)
- Race & ethnicity
- White 87% Hispanic / Latino 6% Two or more races 5% Black 3% Asian 1%
- Hispanic origin (detail)
- Mexican 4%
- Common ancestry
- Serbian 2% Slovak 2% Lithuanian 2%
- Foreign-born
- 3% · Canada, South Korea
- Languages at home
- 95% English-only · Spanish 3% Other Asian/Pacific 1%
Political lean MEDSL · Blount
- 2024 margin
- Solid R (+47.7) · D 25.5% · R 73.2% · Other 1.2%
- 2008→2024 swing
- -8.4pp toward R · 2008: -39.4pp · 2024: -47.7pp
- All cycles
- 2024: R+47.7 2020: R+44.2 2016: R+48.8 2012: R+45.7 2008: R+39.4
Not yet ingested
- Civics
- —
Market trends
- HPI YoY
- ▼ -62.46%
- Current HPI
- 343.4773
- Rent YoY
- ▲ 5.29%
- Metro
- Knoxville, TN
- State GDP YoY
- ▲ 2.78%
- F500 in state
- 22
Industry mix (Fortune 500 HQ in TN)
| Industry | F500 HQs | Revenue |
|---|---|---|
| Healthcare | 3 | $91B |
|
||
| Retail | 3 | $72B |
|
||
| Transportation / Logistics | 1 | $88B |
|
||
| Paper / Packaging | 1 | $19B |
|
||
| Insurance | 1 | $13B |
|
||
| Energy | 1 | $12B |
|
||
Price history
+74.6% since first listed10 events — show timeline
- 2026-05-26 Listed $150,000 FSBO.com
- 2026-04-20 Sold (Public Records) $125,000 Public Records
- 2012-06-04 Sold (MLS) $20,000 Knoxville MLS
- 2012-04-05 Listed $24,900 Knoxville MLS
- 2011-12-08 Listed $24,900 Knoxville MLS
- 2009-02-17 Listed $135,000 Knoxville MLS
- 2006-11-06 Sold (Public Records) $92,000 Public Records
- 2006-11-06 Sold (Public Records) $92,000 Public Records
- 2006-10-27 Sold (MLS) $92,000 Knoxville MLS
- 2006-04-19 Listed $85,900 Knoxville MLS
Property tax history
+6.9%/yrLatest (2025): $1,515 · +4.3% YoY. Source: county tax records.
Cash-flow waterfall
monthlySold comps — $/sqft
last 12 mo · ≤1 miLoading sold comps…