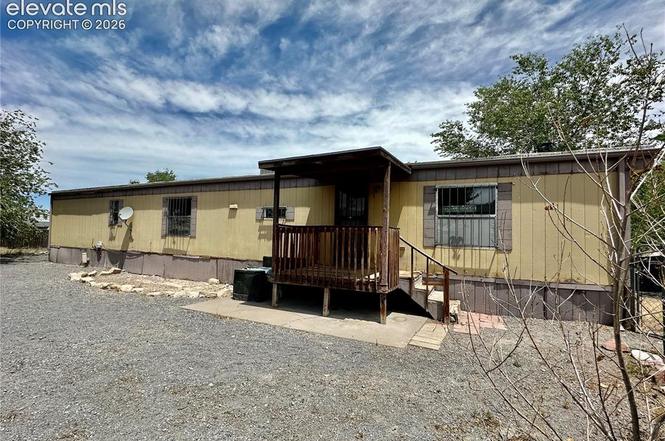
813 S Byrd St · Pueblo West, CO
Flood risk 1/10 · Minimal
- FEMA flood zone
- X (unshaded)
- Chance of flooding over 30 yrs
- 0.0%
- Est. flood insurance / yr
- $473 – $860
Fire risk 5/10 · Moderate
- Est. fire insurance / yr
- $939 – $1,743
Heat risk 4/10 · Minor
- Hot days now (above 96°F)
- 6 days/yr
- Hot days in 30 yrs
- 16 days/yr
Wind risk 2/10 · Minimal
- Chance of severe wind over 30 yrs
- —
Air-quality risk 1/10 · Minimal
- Unhealthy air days now
- 0 days/yr
- Unhealthy air days in 30 yrs
- 0 days/yr
Risk factors via First Street. Map © Google.
Why this score? — see what drove the B- grade
The composite is a weighted blend of 9 inputs, each scored 0–100. Each bar is that input's sub-score; the figure is the points it added to the 100-point composite (weight × sub-score).
- Cash flow +30.0/30.0
- 1% rule +10.0/10.0
- DSCR +10.0/10.0
- ARV discount +7.5/15.0
- Livability +3.2/5.0
- Schools +3.0/10.0
- Rent growth +2.5/5.0
- Condition / age +2.5/5.0
- Appreciation +0.0/10.0
$80,000
🖨 Deal sheet 📄 Offer letter ✓ Due diligence
Listing remarks MLS
Investor Special in Pueblo West! Opportunity awaits with this manufactured home located at 813 Byrd Dr. Situated on its own lot, this property offers tremendous potential for investors, flippers, or buyers looking to build sweat equity. The home needs repairs and updating but features a functional layout and ample opportunity to add value. Conveniently located near schools, shopping, and amenities, this property is ideal for a renovation project or rental investment. Bring your vision and tools—this is a chance to transform a fixer-upper into a profitable asset. Being sold as-is. Don't miss this affordable investment opportunity in growing Pueblo West!
Key facts
- Manufactured home
- Functional layout
- Rental investment
Tags
Property features AI
Finance
- HOA & community: No association amenities
Exterior
- Parking: No garage
- Utilities: Public utilities (standard connections)
- Home design: Manufactured single-family residence; One story
- Construction: Frame construction with wood siding; Metal roof
- Exterior features: Covered porch; Shed(s) on property
Interior
- Kitchen: Range; Oven; Dishwasher; Refrigerator
- Bedrooms: 2 bedrooms on the main level
- Flooring: Carpet; Laminate
- Bathrooms: 1 full bathroom on the main level
- Heating & cooling: Forced air heating (natural gas); Evaporative cooling
- Interior features: Master bedroom on the main level; Living room wood-burning fireplace
- Laundry & utility: Washer and dryer included; Laundry on the main level
Neighborhood map
What this means for you Summary
Snapshot
- This is a 2-bed/1.0-bath manufactured listed at $80k.
Deal economics
- At list price, monthly cash flow is $777 ($9k/yr) — positive.
- The deal already cash-flows at list — no discount required.
- Meets the 1% rule at list price ($2k rent vs $80k).
- Cap rate 17.9% vs local median 3.6% in Pueblo West — top-decile yield for the area; either an underpriced asset or a hidden risk that comps aren't pricing in. Stress-test before assuming the spread holds.
Location & tenants
- Location reads 63/100 on livability (#189 in CO) — a middle-class / working-renter tenant base. Strengths: housing A+, employment B+; Watch: health & safety C-, schools D+, crime F.
- Pueblo County School District 70 (suburban): math 24% / reading 43% proficiency, ranked #40 of 86 in CO (top 46%) — families likely to look elsewhere, expect single-tenant / working-renter base with shorter leases.
- Market conditions: Rents soft (-0.1%/yr); 633 active listings in the ZIP; 22 comparable units currently listed for rent nearby; rentals leasing fast (median 13d on market — plan ~1-2 weeks tenant-placement turnaround); solid renter incomes; 269 units permitted in Pueblo County in 2024 (0 in 5+ unit buildings).
Forward outlook
- Local home prices are declining (-3.0%/yr); year-one equity from $553 of loan paydown is wiped out by about $2k of value loss. Plan a longer hold.
- Pueblo County population projected at +10% by 2050 — modest demand growth; plan on rents tracking national, not racing it.
- At projected returns (-3.0% appreciation + 0.0% rent growth), your $22k cash investment doubles in ~3 years — after that, you're playing with house money.
Negotiation context
- Only 1 days on market — expect competitive offers; lowballing is unlikely to land.
- 4 sale attempts since 13y ago with the ask held roughly flat each time — persistent listings suggest the price (not the market) is what's stuck; bring a comps-based counter.
- Current owner paid $42k; list at $80k implies a 90% gain — meaningful room to come down on a strong offer.
Risks & watch-outs
- Climate carrying-cost: moderate wildfire risk — expect insurance premiums to compound above CPI over the hold.
Questions for the listing agent
- Is there a deadline driving the sale (1031 exchange, divorce, estate, relocation)? That informs how much negotiation room exists.
- Schools are D-rated, which usually means shorter tenancies and higher turnover. Who's the typical renter profile here, and what's been the actual vacancy rate?
- Crime grade is F in this area — have there been break-ins, vandalism, or insurance claims at this property in the last 3 years? What carrier currently insures it and at what premium?
- What's the average days-on-market for RENTAL listings here right now (not sales)? A rising rental-DOM trend means longer vacancies and softer asking-rent achievability than the comps imply.
- What's the recent tenant-quality profile in this submarket — average credit score on applications, eviction rate, late-payment / NSF rate, and stable-employment percentage? A property-management company in the area should have these aggregated.
- How much new for-sale + rental construction is in the pipeline within 1–3 miles? Heavy new supply typically softens prices + rents 12–24 months out; constrained supply supports both.
Investment metrics
- 1% rule
- 2.10% ✓
- Cap rate
- 17.94%
- Cash-on-cash
- 41.60%
- DSCR
- 2.85
- GRM
- 4.0
CMA / ARV
- ARV (on-the-fly)
- $180,096
- Comps found
- 12
Show comp detail 12 sales within ~0.75 mi
| Address | Dist | Beds/Ba | Sqft | Sold | Price | $/sf | Match |
|---|---|---|---|---|---|---|---|
| 745 S Walton Dr | 0.06mi | 2/2.0 | 1,072 (0%) | 8mo | $180,000 | $168 | 86 |
| 353 E Byrd Dr | 0.45mi | 3/2.0 (+1) | 1,064 (-1%) | 2mo | $180,000 | $169 | 67 |
| 270 E Stewart Dr | 0.20mi | 2/2.0 | 960 (-10%) | 2mo | $235,000 | $245 | 67 |
| 992 S Saki Dr | 0.57mi | 3/2.0 (+1) | 1,072 (0%) | 5mo | $180,000 | $168 | 60 |
| 312 E George Dr | 0.24mi | 3/2.0 (+1) | 1,179 (+10%) | 6mo | $159,000 | $135 | 58 |
| 825 S Tolstoi Dr | 0.22mi | 3/2.0 (+1) | 938 (-12%) | 6mo | $149,900 | $160 | 55 |
| 376 E Stanley Dr | 0.43mi | 2/2.0 | 928 (-13%) | 1mo | $215,000 | $232 | 53 |
| 364 E Stanley Dr | 0.39mi | 3/2.0 (+1) | 960 (-10%) | 6mo | $67,000 | $70 | 51 |
| 971 S Silt Dr | 0.53mi | 3/2.0 (+1) | 1,169 (+9%) | 1mo | $205,000 | $175 | 50 |
| 129 E Countryside Dr | 0.38mi | 3/2.0 (+1) | 1,216 (+13%) | 3mo | $162,000 | $133 | 48 |
| 172 E Countryside Dr | 0.44mi | 3/2.0 (+1) | 1,216 (+13%) | 8mo | $170,000 | $140 | 41 |
| 249 E Dawnview Dr | 0.59mi | 3/2.0 (+1) | 1,216 (+13%) | 4mo | $269,900 | $222 | 38 |
Match score weights: distance 35% · size 25% · config 20% · recency 20%. Top-matched comps best support the ARV.
Projected returns pro-forma
-3.0% appreciation · 0.0% rent growth · sell at horizon
- IRR
- 34.8%
- Equity multiple
- 2.41×
- Total profit
- $31,592
- Equity at exit
- $11,928
- IRR
- 40.0%
- Equity multiple
- 4.23×
- Total profit
- $72,244
- Equity at exit
- $6,917
Cash invested: $22,400 (down + closing). Projections, not guarantees.
Landlord ↔ Tenant lean methodology
- Overall (STATE)
- 38 Tenant-Leaning
- State Colorado
- 38 Tenant-Leaning · D+4
- County
- — inherits STATE
- City
- — inherits STATE
ZIP-level market 81007
- Home prices YoY
- -22.9%
- Rents YoY
- -0.1%
- Active inventory
- 633
- Price-to-rent
- 4.0×
Monthly cashflow live
- Estimated rent
- $1,683 high interval (Pro) →
- Mortgage (P&I)
- −$420
- Tax est. 1.5%
- −$100 /mo · $1,200/yr
- Insurance
- −$33
- HOA
- −$0
- Vacancy / Maint / Mgmt
- −$353
- Net cashflow
- $777
Break-even live
UW: 25.0% down · 7.5% · 30yr · 1.5% tax · 5.0% vac · 8.0% maint · 8.0% mgmt
Financing live
Cash to close
- Down payment
- $20,000
- Closing costs
- $2,400
- Reserves months
- —
- Total cash needed
- —
Loan-product check · same deal, 3 products live
Conventional
25% down · 7.5% · 30yr
- Down + closing
- —
- Monthly P&I
- —
- Monthly cashflow
- —
- DSCR
- —
- Eligible?
- —
Personal DTI + credit; lowest rate.
DSCR
20% down · 8.5% · 30yr
- Down + closing
- —
- Monthly P&I
- —
- Monthly cashflow
- —
- DSCR
- —
- Eligible?
- —
No personal income docs; deal must DSCR.
Hard money
10% down · 12.0% · 12mo
- Down + closing
- —
- Monthly P&I
- —
- Monthly cashflow
- —
- DSCR
- —
- Eligible?
- —
Short-term bridge; refi at stabilization.
Rent comps 22 comps
| Address | Beds | Baths | Sqft | Rent | $/sqft | DOM | Units | Dist |
|---|---|---|---|---|---|---|---|---|
| 98 E Byrd Dr Pueblo, CO | 3.0 | 2.0 | 1140 | $1,515 | $1.33 | 13d | 1 | 0.19mi |
| 655 S Inca Dr Pueblo, CO | 3.0 | 2.0 | 1008 | $2,000 | $1.98 | 13d | 1 | 0.33mi |
| 771 S Sterling Dr Pueblo, CO | 3.0 | 2.0 | 1129 | $1,620 | $1.43 | 13d | 1 | 0.45mi |
| 662 S Burro Dr Pueblo, CO | 3.0 | 2.5 | 1248 | $2,100 | $1.68 | 13d | 1 | 0.59mi |
| 512 S Aguilar Dr Pueblo West, CO | 1.0–2.0 | 1.5 | 825 | $1,185 | $1.44 | 13d | 2 | 0.66mi |
| 82 W Baldwyn Dr #88 Pueblo, CO | 3.0 | 2.0 | 1100 | $1,700 | $1.55 | 13d | 1 | 0.84mi |
| 82 W Baldwyn Dr Unit 86 Pueblo West, CO | 3.0 | 2.0 | 1100 | $1,700 | $1.55 | 20d | 1 | 0.84mi |
| 228 W Palomar Plz Pueblo, CO | 2.0 | 2.0 | 1358 | $1,850 | $1.36 | 13d | 1 | 0.92mi |
| 531 S Angus Ave Apt 11 Pueblo West, CO | 2.0 | 1.0 | 768 | $1,359 | $1.77 | 13d | 1 | 1.03mi |
| 531 S Angus Ave Apt 2 Pueblo West, CO | 2.0 | 1.0 | 768 | $1,299 | $1.69 | 13d | 1 | 1.04mi |
| 531 S Angus Ave Unit 13 Pueblo West, CO | 2.0 | 1.0 | 768 | $1,250 | $1.63 | 13d | 1 | 1.04mi |
| 251 W Acorn Dr Unit 251 Pueblo West, CO | 3.0 | 2.0 | 1500 | $2,050 | $1.37 | 13d | 1 | 1.09mi |
| 241 W Laurue Ln Pueblo West, CO | 3.0 | 2.0 | 1484 | $2,200 | $1.48 | 13d | 1 | 1.10mi |
| 896 S Harmony Dr Pueblo West, CO | 2.0 | 2.0 | 771 | $1,600 | $2.08 | 13d | 1 | 1.21mi |
| 230 W Elbow Dr Unit 228 Pueblo, CO | 3.0 | 2.5 | 1427 | $2,025 | $1.42 | 13d | 1 | 1.22mi |
| 898 S Harmony Dr Pueblo West, CO | 2.0 | 2.0 | 771 | $1,600 | $2.08 | 13d | 1 | 1.22mi |
| 208 W Palmer Lake Dr Pueblo, CO | 2.0 | 1.0 | 900 | $1,050 | $1.17 | 20d | 1 | 1.26mi |
| 692 E Hahns Peak Ave Pueblo West, CO | 3.0 | 2.0 | 1100 | $2,000 | $1.82 | 13d | 1 | 1.35mi |
| 690 E Hahns Peak Ave Pueblo, CO | 3.0 | 2.0 | 1100 | $2,000 | $1.82 | 13d | 1 | 1.35mi |
| 970 S Coral Pl Pueblo West, CO | 3.0 | 2.0 | 1484 | $2,195 | $1.48 | 13d | 1 | 1.39mi |
| 318 W Coral Dr Pueblo West, CO | 2.0 | 2.0 | 1060 | $1,575 | $1.49 | 20d | 1 | 1.40mi |
| 667 E Clarion Dr Unit D Pueblo West, CO | 2.0 | 1.0 | 900 | $1,400 | $1.56 | 13d | 1 | 1.45mi |
Listing history 3 events
-
2026-06-19remarks 660-char remark
-
2026-06-19$80,000 Active 1 DOM
-
2026-06-18$80,000 Active 1 DOM
Show marketing remark (666 chars)
Investor Special in Pueblo West! Opportunity awaits with this manufactured home located at 813 Byrd Dr. Situated on its own lot, this property offers tremendous potential for investors, flippers, or buyers looking to build sweat equity. The home needs repairs and updating but features a functional layout and ample opportunity to add value. Conveniently located near schools, shopping, and amenities, this property is ideal for a renovation project or rental investment. Bring your vision and tools—this is a chance to transform a fixer-upper into a profitable asset. Being sold as-is. Don't miss this affordable investment opportunity in growing Pueblo West!
ⓘ Source: listings_history table (triggers on properties + properties_extension) + one-shot
backfill from property_details.listing_events for pre-trigger history.
Climate risk First Street
- Flood 1/10 Low FEMA zone X (unshaded) · 0% chance over 30 yrs
- Wildfire 5/10 Major
- Heat 4/10 Moderate 6 d/yr ≥96°F today · 16 d/yr by 30 yrs out
- Wind 2/10 Low
- Air quality 1/10 Low 0 unhealthy d/yr today · 0 by 30 yrs out
Nearby sold comps map
Loading sold comps map…
Walkable amenities ~0.75 mi
Loading nearby amenities…
Taxation est. · year 1
- Rental income
- $20,194
- − Mortgage interest
- −$4,481
- − Property taxes
- −$1,200
- − Insurance
- −$400
- − Repairs & maintenance
- −$1,616
- − Management
- −$1,616
- − Depreciation
- −$2,327
- Taxable income
- $8,555
- Est. tax owed @ 24.0%
- −$2,053
- After-tax cash flow
- $7,266/yr
For passive investors: Depreciation is non-cash, so a rental often shows a tax loss while cash-flowing — sheltering income. Rental losses are passive: they offset passive income freely, and up to $25,000/yr can offset ordinary (W-2) income if you actively participate and your MAGI is under $100k (phasing out to $0 by $150k); unused losses carry forward. On sale, claimed depreciation is recaptured at up to 25%, and gains may owe capital-gains tax (a 1031 exchange can defer both). Figures are a year-1 estimate at your 24.0% rate — not tax advice; consult a CPA.
Schools (NCES district)
- District
- Pueblo County School District 70
- NCES district ID
- 0806150
- Math proficiency
- 24% ▼ -4.00%
- Reading proficiency
- 43% ▼ -2.00%
- Median HH income
- $59,438
- Composite
- 29.93/100
- National rank
- #6381
- State rank
- #40 of 86 in CO
Livability — Pueblo West
- Score
- 63/100
- State rank
- #189
- US rank
- #15760
Category grades
Schools grade is shown separately in the Schools card above.
Census & demographics
- Census place
- Pueblo West, CO
- County
- Pueblo County · 151,887 people
- Metro
- Pueblo, CO
- Population (ZIP)
- 35,690
- Household income
- $96,713
- Rent vs Own
- Severe rent burden
- 353.0
Population outlook (Pueblo County) Hauer SSP2
- Today (2025)
- 173,240 people
- By 2030
- 177,716 · +2.6%
- By 2040
- 185,125 · +6.9%
- By 2050
- 190,642 · +10.0%
- By 2075
- 201,611 · +16.4%
- By 2100
- 196,443 · +13.4%
Race, ethnicity, and origin ACS 2023
- Neighborhood character
- Predominantly White (65%)
- Race & ethnicity
- White 65% Hispanic / Latino 29% Two or more races 11% Asian 1% Black 1%
- Hispanic origin (detail)
- Mexican 19%
- Common ancestry
- Romanian 2% Lithuanian 2% Italian 2%
- Foreign-born
- 4% · Canada
- Languages at home
- 92% English-only · Spanish 7%
Political lean MEDSL · Pueblo
- 2024 margin
- Lean R (+5.1) · D 46.2% · R 51.3% · Other 2.5%
- 2008→2024 swing
- -20.1pp toward R · 2008: 15.0pp · 2024: -5.1pp
- All cycles
- 2024: R+5.1 2020: D+1.7 2016: D+0.3 2012: D+13.1 2008: D+15.0
Not yet ingested
- Civics
- —
Market trends
- HPI YoY
- ▼ -82.80%
- Current HPI
- 279.191
- Rent YoY
- ▼ -0.10%
- Metro
- Pueblo, CO
- State GDP YoY
- ▲ 1.95%
- F500 in state
- 14
Industry mix (Fortune 500 HQ in CO)
| Industry | F500 HQs | Revenue |
|---|---|---|
| Technology Distribution | 1 | $31B |
|
||
| Food / Agriculture | 1 | $18B |
|
||
| Packaging | 1 | $14B |
|
||
| Healthcare | 1 | $13B |
|
||
| Energy | 1 | $10B |
|
||
| Technology | 1 | $4B |
|
||
Price history
+150.0% since first listed7 events — show timeline
- 2026-06-18 Listed $80,000 elevateMLS
- 2026-06-18 Listed $80,000 PARMLS
- 2014-05-12 Sold (Public Records) $42,000 Public Records
- 2014-05-05 Sold (MLS) $42,000 PARMLS
- 2014-03-13 Listed $42,900 PARMLS
- 2013-12-03 Sold (MLS) $26,900 PARMLS
- 2013-10-02 Listed $31,999 PARMLS
Property tax history
-1.9%/yrLatest (2021): $78 · -11.4% YoY. Source: county tax records.
Cash-flow waterfall
monthlySold comps — $/sqft
last 12 mo · ≤1 miLoading sold comps…