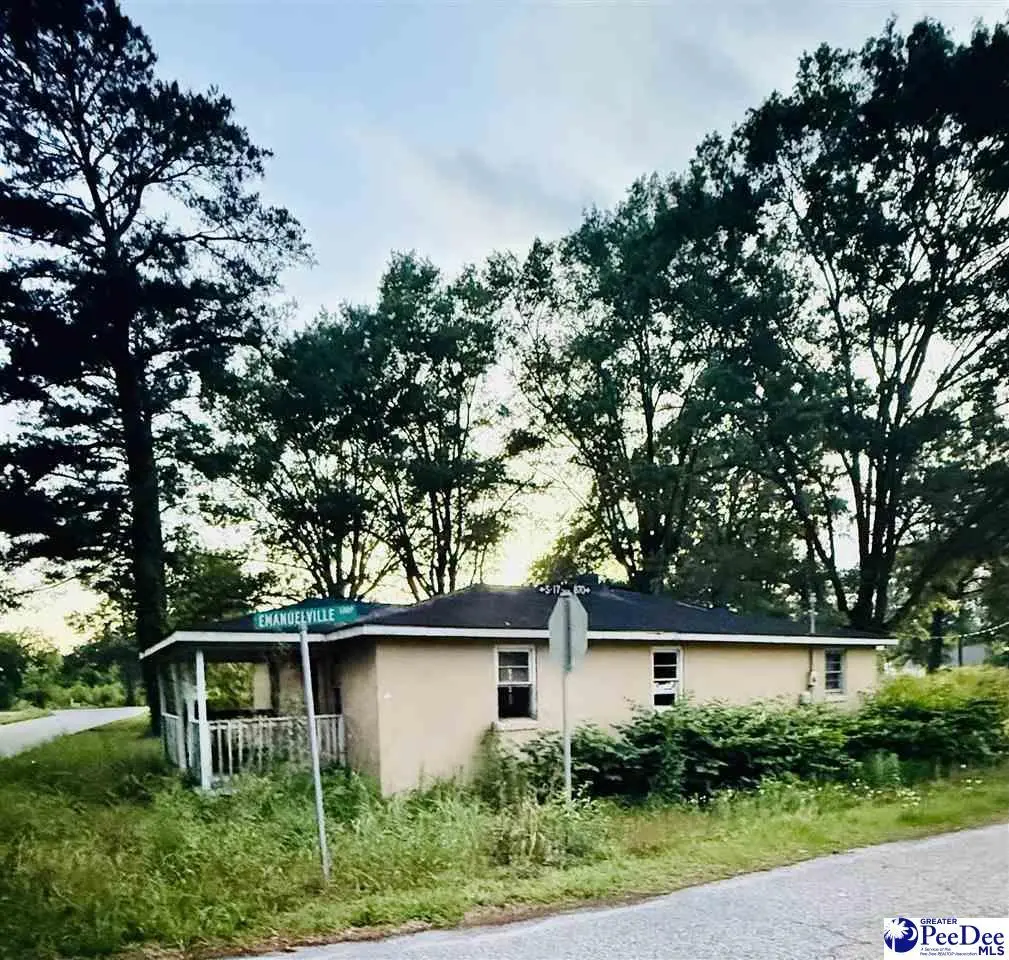
1923 Homelight Rd · Dillon, SC
Flood risk No data
- FEMA flood zone
- —
- Chance of flooding over 30 yrs
- —
- Est. flood insurance / yr
- —
Fire risk No data
- Est. fire insurance / yr
- —
Heat risk No data
- Hot days now (above threshold)
- —
- Hot days in 30 yrs
- —
Wind risk No data
- Chance of severe wind over 30 yrs
- —
Air-quality risk No data
- Unhealthy air days now
- —
- Unhealthy air days in 30 yrs
- —
Risk factors via First Street. Map © Google.
Why this score? — see what drove the B- grade
The composite is a weighted blend of 9 inputs, each scored 0–100. Each bar is that input's sub-score; the figure is the points it added to the 100-point composite (weight × sub-score).
- Cash flow +30.0/30.0
- 1% rule +10.0/10.0
- DSCR +10.0/10.0
- ARV discount +7.5/15.0
- Livability +3.2/5.0
- Rent growth +2.5/5.0
- Condition / age +2.5/5.0
- Schools +1.6/10.0
- Appreciation +0.0/10.0
$33,000
🖨 Deal sheet 📄 Offer letter ✓ Due diligence
Listing remarks
INVESTOR SPECIAL!!! INSTANT EQUITY POTENTIAL!!! Dillon, South Carolina Priced to move! Looking for your next flip? This solid brick cinder block home is built like a tank. It needs renovations being sold strictly as-is, but the structurally sound masonry gives you the ultimate blank canvas to maximize your ARV. Bring your contractor and your creative vision—the footprint is ready for a complete modern reimagining, schedule a walk-through today! Buyer to confirm all dimensions.
Key facts
- 6,970 sq ft lot
- Built 1970
- Listed 14 days
Property features AI
Finance
- Other: Located in the COUNTY subdivision
- Financial info:
- HOA & community:
Exterior
- Parking:
- Security:
- Utilities: Public water; Public sewer
- Home design: Single-family residence; Residential property
- Construction: Shingle roof; About 1,200 finished above-grade
- Exterior features: Corner lot
Interior
- Kitchen:
- Bedrooms:
- Flooring:
- Bathrooms: 1 full bathroom
- Heating & cooling:
- Interior features: Porch
- Laundry & utility:
Neighborhood map
What this means for you Summary
Snapshot
- This is a 3-bed/1.0-bath other listed at $33k.
Deal economics
- At list price, monthly cash flow is $599 ($7k/yr) — positive.
- The deal already cash-flows at list — no discount required.
- Meets the 1% rule at list price ($1k rent vs $33k).
- Recommended offer: $33k (1.5% below list) — sets the bar for market timing.
Location & tenants
- Location reads 63/100 on livability (#163 in SC) — a middle-class / working-renter tenant base. Strengths: cost of living A+, housing A+, health & safety A+; Watch: commute D+, crime F, amenities F.
- Dillon 04 (town): math 14% / reading 27% proficiency, ranked #72 of 80 in SC (top 90%) — low school quality limits family demand, transient renter base, plan for 1-2y turnover; 83% free/reduced lunch — lower-income household profile, screen leases tightly.
- Zoned schools: Dillon Middle (math 10% / reading 22%, grade F, #196 of 229 statewide, top 87%, 666 students, 100% FRL); Dillon High (math 12% / reading 67%, grade F, #180 of 196 statewide, top 93%, 869 students, 100% FRL) — zoned schools average 100% FRL vs 83% district-wide (17 pts higher); higher-poverty schools than district average — tighter screening recommended.
- Market conditions: 78 active listings in the ZIP; 41 units permitted in Dillon County in 2024 (0 in 5+ unit buildings).
Forward outlook
- Local home prices are declining (-3.0%/yr); year-one equity from $228 of loan paydown is wiped out by about $990 of value loss. Plan a longer hold.
- Dillon County population projected at -25% by 2050 — secular population decline; favor cash flow + early exit over multi-decade hold.
- At projected returns (-3.0% appreciation + 3.0% rent growth), your $9k cash investment doubles in ~2 years — after that, you're playing with house money.
Negotiation context
- It's been on market 15 days — a 2% lower offer ($33k) is reasonable based on typical stale-listing flexibility.
Questions for the listing agent
- Built in 1970 — when were the roof, HVAC, electrical panel, plumbing, and water heater last replaced?
- Is there a deadline driving the sale (1031 exchange, divorce, estate, relocation)? That informs how much negotiation room exists.
- Schools are F-rated, which usually means shorter tenancies and higher turnover. Who's the typical renter profile here, and what's been the actual vacancy rate?
- Crime grade is F in this area — have there been break-ins, vandalism, or insurance claims at this property in the last 3 years? What carrier currently insures it and at what premium?
- What's the average days-on-market for RENTAL listings here right now (not sales)? A rising rental-DOM trend means longer vacancies and softer asking-rent achievability than the comps imply.
- What's the recent tenant-quality profile in this submarket — average credit score on applications, eviction rate, late-payment / NSF rate, and stable-employment percentage? A property-management company in the area should have these aggregated.
- How much new for-sale + rental construction is in the pipeline within 1–3 miles? Heavy new supply typically softens prices + rents 12–24 months out; constrained supply supports both.
Investment metrics
- 1% rule
- 3.24% ✓
- Cap rate
- 28.09%
- Cash-on-cash
- 77.86%
- DSCR
- 4.46
- GRM
- 2.6
CMA / ARV
No comps found within radius.
Projected returns pro-forma
-3.0% appreciation · 3.0% rent growth · sell at horizon
- IRR
- 77.9%
- Equity multiple
- 4.56×
- Total profit
- $32,860
- Equity at exit
- $4,920
- IRR
- 81.5%
- Equity multiple
- 9.43×
- Total profit
- $77,885
- Equity at exit
- $2,853
Cash invested: $9,240 (down + closing). Projections, not guarantees.
Landlord ↔ Tenant lean methodology
- Overall (STATE)
- 90 Strongly Landlord-Friendly
- State South Carolina
- 90 Strongly Landlord-Friendly · R+6
- County
- — inherits STATE
- City
- — inherits STATE
ZIP-level market 29536
- Home prices YoY
- -33.9%
- Active inventory
- 78
- Price-to-rent
- 2.6×
Monthly cashflow live
- Estimated rent
- $1,068 medium interval (Pro) →
- Mortgage (P&I)
- −$173
- Tax from tax record
- −$58 /mo · $692/yr
- Insurance
- −$14
- HOA
- −$0
- Vacancy / Maint / Mgmt
- −$224
- Net cashflow
- $599
Break-even live
UW: 25.0% down · 7.5% · 30yr · 1.5% tax · 5.0% vac · 8.0% maint · 8.0% mgmt
Financing live
Cash to close
- Down payment
- $8,250
- Closing costs
- $990
- Reserves months
- —
- Total cash needed
- —
Loan-product check · same deal, 3 products live
Conventional
25% down · 7.5% · 30yr
- Down + closing
- —
- Monthly P&I
- —
- Monthly cashflow
- —
- DSCR
- —
- Eligible?
- —
Personal DTI + credit; lowest rate.
DSCR
20% down · 8.5% · 30yr
- Down + closing
- —
- Monthly P&I
- —
- Monthly cashflow
- —
- DSCR
- —
- Eligible?
- —
No personal income docs; deal must DSCR.
Hard money
10% down · 12.0% · 12mo
- Down + closing
- —
- Monthly P&I
- —
- Monthly cashflow
- —
- DSCR
- —
- Eligible?
- —
Short-term bridge; refi at stabilization.
Listing history 11 events
-
2026-06-18days on market $33,000 Active 15 DOM
-
2026-06-17days on market $33,000 Active 14 DOM
-
2026-06-16days on market $33,000 Active 13 DOM
-
2026-06-15days on market $33,000 Active 12 DOM
-
2026-06-13days on market $33,000 Active 10 DOM
-
2026-06-12days on market $33,000 Active 9 DOM
-
2026-06-09days on market $33,000 Active 6 DOM
-
2026-06-08days on market $33,000 Active 5 DOM
-
2026-06-08days on market $33,000 Active 4 DOM
-
2026-06-07remarks 482-char remark
-
2026-06-07$33,000 Active 3 DOM
ⓘ Source: listings_history table (triggers on properties + properties_extension) + one-shot
backfill from property_details.listing_events for pre-trigger history.
Tax reassessment forecast SC · Resets to sale price
- Current annual tax
- $692 · $58/mo
- Projected year-2 tax
- $692 · $58/mo
- Expected delta
- $0/yr ($0/mo · 0.0%)
ⓘ Screening estimate from a state-policy table — verify with the county assessor before closing.
Nearby sold comps map
Loading sold comps map…
Walkable amenities ~0.75 mi
Loading nearby amenities…
Taxation est. · year 1
- Rental income
- $12,819
- − Mortgage interest
- −$1,849
- − Property taxes
- −$692
- − Insurance
- −$165
- − Repairs & maintenance
- −$1,026
- − Management
- −$1,026
- − Depreciation
- −$960
- Taxable income
- $7,103
- Est. tax owed @ 24.0%
- −$1,705
- After-tax cash flow
- $5,489/yr
For passive investors: Depreciation is non-cash, so a rental often shows a tax loss while cash-flowing — sheltering income. Rental losses are passive: they offset passive income freely, and up to $25,000/yr can offset ordinary (W-2) income if you actively participate and your MAGI is under $100k (phasing out to $0 by $150k); unused losses carry forward. On sale, claimed depreciation is recaptured at up to 25%, and gains may owe capital-gains tax (a 1031 exchange can defer both). Figures are a year-1 estimate at your 24.0% rate — not tax advice; consult a CPA.
Schools (NCES district)
- District
- Dillon 04
- NCES district ID
- 4501920
- Math proficiency
- 14% ▼ -15.00%
- Reading proficiency
- 27% ▼ -9.00%
- Median HH income
- $27,820
- Composite
- 16.16/100
- National rank
- #9230
- State rank
- #72 of 80 in SC
Livability — Dillon
- Score
- 63/100
- State rank
- #163
- US rank
- #14995
Category grades
Schools grade is shown separately in the Schools card above.
Census & demographics
- City population
- 15,825
- Population (ZIP)
- 15,825
Population outlook (Dillon County) Hauer SSP2
- Today (2025)
- 29,087 people
- By 2030
- 27,713 · -4.7%
- By 2040
- 24,772 · -14.8%
- By 2050
- 21,836 · -24.9%
- By 2075
- 15,165 · -47.9%
- By 2100
- 9,849 · -66.1%
Race, ethnicity, and origin ACS 2023
- Neighborhood character
- Diverse neighborhood (Simpson 0.58)
- Race & ethnicity
- Black 54% White 36% Two or more races 5% Hispanic / Latino 4% Native American 1%
- Common ancestry
- Serbian 1% Slovak 1%
- Foreign-born
- 2% · Canada
- Languages at home
- 97% English-only · Spanish 3%
Political lean MEDSL · Dillon
- 2024 margin
- R (+10.8) · D 44.2% · R 55.0%
- 2008→2024 swing
- -22.3pp toward R · 2008: 11.4pp · 2024: -10.8pp
- All cycles
- 2024: R+10.8 2020: R+1.1 2016: D+1.7 2012: D+16.3 2008: D+11.4
Not yet ingested
- Civics
- —
Market trends
- HPI YoY
- ▼ -46.08%
- Current HPI
- 89.7124
- Rent YoY
- —
- Metro
- —
- State GDP YoY
- ▲ 4.51%
- F500 in state
- 2
Industry mix (Fortune 500 HQ in SC)
| Industry | F500 HQs | Revenue |
|---|---|---|
| Packaging | 1 | $7B |
|
||
Price history
1 event — show timeline
- 2026-06-04 Listed $33,000 RAGPD
Property tax history
+2.2%/yrLatest (2025): $692 · +2.6% YoY. Source: county tax records.
Cash-flow waterfall
monthlySold comps — $/sqft
last 12 mo · ≤1 miLoading sold comps…