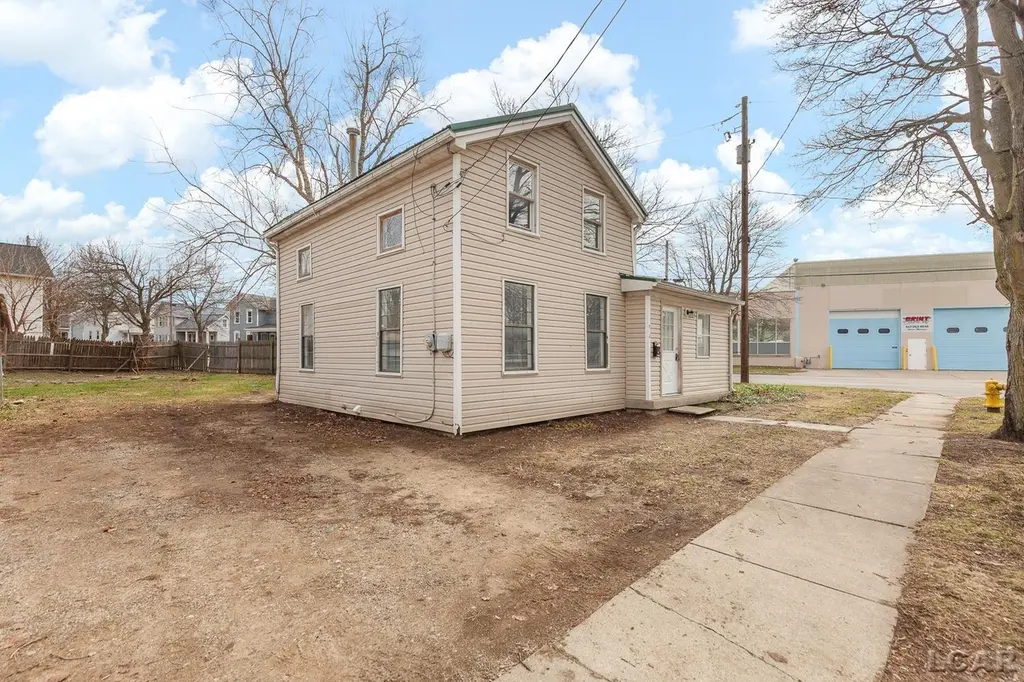
206 Ormsby St · Adrian, MI
Flood risk 1/10 · Minimal
- FEMA flood zone
- X (unshaded)
- Chance of flooding over 30 yrs
- 0.0%
- Est. flood insurance / yr
- $507 – $1,088
Fire risk 1/10 · Minimal
- Est. fire insurance / yr
- $784 – $1,456
Heat risk 3/10 · Minor
- Hot days now (above 98°F)
- 7 days/yr
- Hot days in 30 yrs
- 16 days/yr
Wind risk 2/10 · Minimal
- Chance of severe wind over 30 yrs
- —
Air-quality risk 2/10 · Minimal
- Unhealthy air days now
- 1 days/yr
- Unhealthy air days in 30 yrs
- 1 days/yr
Risk factors via First Street. Map © Google.
Why this score? — see what drove the B grade
The composite is a weighted blend of 9 inputs, each scored 0–100. Each bar is that input's sub-score; the figure is the points it added to the 100-point composite (weight × sub-score).
- Cash flow +30.0/30.0
- ARV discount +11.0/15.0
- DSCR +10.0/10.0
- 1% rule +8.8/10.0
- Livability +3.5/5.0
- Rent growth +2.5/5.0
- Schools +2.5/10.0
- Condition / age +2.5/5.0
- Appreciation +0.0/10.0
$119,900
🖨 Deal sheet (PDF) 📄 Offer letter ✓ Due diligence
Listing remarks MLS
4 bedroom home that is move in ready. Recent updates include new kitchen, bath, flooring, paint, and carpet along with new mechanicals. All situated on large corner lot.
Key facts
- New bath
- New kitchen
- New carpet
Tags
Property features AI
Finance
- Other: City lot on a corner (49 x 104; 0.12 acre); Public maintained road
- HOA & community: Homeowners association present
Exterior
- Utilities: Water available; Public sewer
- Home design: Single family residence; Two stories
- Construction: Vinyl siding
- Exterior features: Front porch
Interior
- Kitchen: Oven; Refrigerator; Range
- Bathrooms: 1 full bathroom
- Heating & cooling: Natural gas heating; Steam heating; No central cooling
- Interior features: Electric water heater; Oven; Refrigerator; Range; Has basement; 8 total rooms
Neighborhood map
What this means for you Summary
Snapshot
- This is a 4-bed/1.0-bath single-family listed at $120k.
Deal economics
- At list price, monthly cash flow is $489 ($6k/yr) — positive.
- The deal already cash-flows at list — no discount required.
- Meets the 1% rule at list price ($2k rent vs $120k).
- Recommended offer: $109k (9.0% below list) — sets the bar for market timing.
- Cap rate 11.2% vs local median 5.6% in Adrian — top-decile yield for the area; either an underpriced asset or a hidden risk that comps aren't pricing in. Stress-test before assuming the spread holds.
Location & tenants
- Location reads 69/100 on livability (#342 in MI) — a middle-class / working-renter tenant base. Strengths: cost of living A+, housing A+, health & safety A+; Watch: amenities D, crime F, commute F.
- Adrian School District (town): math 25% / reading 35% proficiency, ranked #370 of 540 in MI (top 68%) — families likely to look elsewhere, expect single-tenant / working-renter base with shorter leases.
- Zoned schools: Prairie Elementary School (math 17% / reading 27%, grade F, #1,035 of 1,397 statewide, top 77%, 224 students, 80% FRL); Springbrook Middle School (math 29% / reading 38%, grade F, #303 of 493 statewide, top 62%, 641 students, 71% FRL); Adrian High School (math 22% / reading 42%, grade F, #405 of 713 statewide, top 59%, 781 students, 63% FRL).
- Market conditions: 212 active listings in the ZIP; 137 units permitted in Lenawee County in 2024 (0 in 5+ unit buildings).
Forward outlook
- Local home prices are declining (-3.0%/yr); year-one equity from $829 of loan paydown is wiped out by about $4k of value loss. Plan a longer hold.
- Lenawee County population projected at -18% by 2050 — secular population decline; favor cash flow + early exit over multi-decade hold.
- At projected returns (-3.0% appreciation + 3.0% rent growth), your $34k cash investment doubles in ~7 years — after that, you're playing with house money.
Negotiation context
- It's been on market 93 days — a 9% lower offer ($109k) is reasonable based on typical stale-listing flexibility.
- 10 sale attempts since 18y ago; this cycle's ask has dropped $10k (8%) from the opening price — seller is motivated, your offer sets the floor, not the list.
Risks & watch-outs
- Watch-outs: built in 1920 — expect roof / HVAC / electrical / plumbing capex.
Questions for the listing agent
- It's been on market 93 days. Have you received any prior offers? Is the seller open to a 9% concession, seller financing, or rate buy-down credit?
- Built in 1920 — when were the roof, HVAC, electrical panel, plumbing, and water heater last replaced?
- Why hasn't it sold? Are there any deal-killer items the seller is aware of (foundation, flood, title, zoning, code violations)?
- Is there a deadline driving the sale (1031 exchange, divorce, estate, relocation)? That informs how much negotiation room exists.
- Crime grade is F in this area — have there been break-ins, vandalism, or insurance claims at this property in the last 3 years? What carrier currently insures it and at what premium?
- What's the average days-on-market for RENTAL listings here right now (not sales)? A rising rental-DOM trend means longer vacancies and softer asking-rent achievability than the comps imply.
- What's the recent tenant-quality profile in this submarket — average credit score on applications, eviction rate, late-payment / NSF rate, and stable-employment percentage? A property-management company in the area should have these aggregated.
- How much new for-sale + rental construction is in the pipeline within 1–3 miles? Heavy new supply typically softens prices + rents 12–24 months out; constrained supply supports both.
Investment metrics
- 1% rule
- 1.38% ✓
- Cap rate
- 11.19%
- Cash-on-cash
- 17.48%
- DSCR
- 1.78
- GRM
- 6.0
CMA / ARV
- ARV (on-the-fly)
- $129,865
- Comps found
- 12
Show comp detail 12 sales within ~0.75 mi
| Address | Dist | Beds/Ba | Sqft | Sold | Price | $/sf | Match |
|---|---|---|---|---|---|---|---|
| 530 James St | 0.42mi | 3/1.0 (-1) | 1,364 (-0%) | 6mo | $130,000 | $95 | 70 |
| 803 Ormsby St | 0.36mi | 3/1.0 (-1) | 1,441 (+5%) | 2mo | $69,700 | $48 | 67 |
| 903 E Maple St | 0.16mi | 3/1.0 (-1) | 1,509 (+10%) | 4mo | $52,500 | $35 | 66 |
| 136 E Chestnut St E | 0.48mi | 4/1.0 | 1,440 (+5%) | 3mo | $170,000 | $118 | 66 |
| 709 N Locust St | 0.37mi | 3/1.0 (-1) | 1,276 (-7%) | 1mo | $38,000 | $30 | 66 |
| 910 Chestnut St | 0.30mi | 3/1.0 (-1) | 1,275 (-7%) | 7mo | $120,000 | $94 | 64 |
| 308 Toledo St | 0.26mi | 3/1.0 (-1) | 1,242 (-9%) | 6mo | $39,900 | $32 | 63 |
| 126 E Albert St | 0.67mi | 4/1.0 | 1,288 (-6%) | 2mo | $165,000 | $128 | 58 |
| 512 French St | 0.36mi | 4/1.5 | 1,564 (+14%) | 7mo | $133,000 | $85 | 52 |
| 822 Elm St | 0.40mi | 3/1.0 (-1) | 1,175 (-14%) | 4mo | $135,000 | $115 | 50 |
| 826 N Locust St | 0.44mi | 4/2.0 | 1,198 (-12%) | 6mo | $205,000 | $171 | 49 |
| 322 Lawrence Ave | 0.61mi | 3/1.0 (-1) | 1,244 (-9%) | 4mo | $134,900 | $108 | 48 |
Match score weights: distance 35% · size 25% · config 20% · recency 20%. Top-matched comps best support the ARV.
Projected returns pro-forma
-3.0% appreciation · 3.0% rent growth · sell at horizon
- IRR
- 8.9%
- Equity multiple
- 1.35×
- Total profit
- $11,742
- Equity at exit
- $17,877
- IRR
- 18.1%
- Equity multiple
- 2.50×
- Total profit
- $50,417
- Equity at exit
- $10,367
Cash invested: $33,572 (down + closing). Projections, not guarantees.
Landlord ↔ Tenant lean methodology
- Overall (STATE)
- 62 Landlord-Friendly
- State Michigan
- 62 Landlord-Friendly · EVEN
- County
- — inherits STATE
- City
- — inherits STATE
ZIP-level market 49221
- Active inventory
- 212
- Price-to-rent
- 6.0×
Monthly cashflow live
- Estimated rent
- $1,656 medium interval (Pro) →
- Mortgage (P&I)
- −$629
- Tax from tax record
- −$141 /mo · $1,686/yr
- Insurance
- −$50
- HOA
- −$0
- Vacancy / Maint / Mgmt
- −$348
- Net cashflow
- $489
Break-even live
Sensitivity live
| Price | -10% $557 | -5% $523 | +0% $489 | +5% $455 | +10% $421 |
|---|---|---|---|---|---|
| Rent | -10% $358 | -5% $424 | +0% $489 | +5% $555 | +10% $620 |
| Rate | -1.0pp $549 | -0.5pp $520 | base $489 | +0.5pp $458 | +1.0pp $426 |
UW: 25.0% down · 7.5% · 30yr · 1.5% tax · 5.0% vac · 8.0% maint · 8.0% mgmt
Financing live
Cash to close
- Down payment
- $29,975
- Closing costs
- $3,597
- Reserves months
- —
- Total cash needed
- —
Loan-product check · same deal, 3 products live
Conventional
25% down · 7.5% · 30yr
- Down + closing
- —
- Monthly P&I
- —
- Monthly cashflow
- —
- DSCR
- —
- Eligible?
- —
Personal DTI + credit; lowest rate.
DSCR
20% down · 8.5% · 30yr
- Down + closing
- —
- Monthly P&I
- —
- Monthly cashflow
- —
- DSCR
- —
- Eligible?
- —
No personal income docs; deal must DSCR.
Hard money
10% down · 12.0% · 12mo
- Down + closing
- —
- Monthly P&I
- —
- Monthly cashflow
- —
- DSCR
- —
- Eligible?
- —
Short-term bridge; refi at stabilization.
Listing history 43 events
-
2026-06-21days on market $119,900 Active 93 DOM
-
2026-06-21days on market $119,900 Active 92 DOM
-
2026-06-18days on market $119,900 Active 90 DOM
-
2026-06-17days on market $119,900 Active 89 DOM
-
2026-06-16days on market $119,900 Active 88 DOM
-
2026-06-15days on market $119,900 Active 87 DOM
-
2026-06-13days on market $119,900 Active 85 DOM
-
2026-06-12days on market $119,900 Active 84 DOM
-
2026-06-09days on market $119,900 Active 81 DOM
-
2026-06-08days on market $119,900 Active 80 DOM
-
2026-06-07days on market $119,900 Active 79 DOM
-
2026-06-07days on market $119,900 Active 78 DOM
-
2026-06-04days on market $119,900 Active 75 DOM
-
2026-06-02pricestatusdays on market $119,900 Active 74 DOM
-
2026-06-01days on market $126,900 Active Under Contract 73 DOM
-
2026-05-31days on market $126,900 Active Under Contract 72 DOM
-
2026-05-31days on market $126,900 Active Under Contract 71 DOM
-
2026-04-07price $126,900 169-char remark
Show marketing remark (169 chars)
4 bedroom home that is move in ready. Recent updates include new kitchen, bath, flooring, paint, and carpet along with new mechanicals. All situated on large corner lot.
-
2026-04-06price $126,900
-
2026-03-20$129,900 Active 169-char remark
Show marketing remark (169 chars)
4 bedroom home that is move in ready. Recent updates include new kitchen, bath, flooring, paint, and carpet along with new mechanicals. All situated on large corner lot.
-
2026-03-20$129,900 Active
Show marketing remark (169 chars)
4 bedroom home that is move in ready. Recent updates include new kitchen, bath, flooring, paint, and carpet along with new mechanicals. All situated on large corner lot.
-
2024-05-22historical
-
2024-05-22historical
-
2024-04-17price $85,000
-
2024-04-17price $85,000
-
2024-03-15$89,000 Active
-
2024-03-15$89,000 Active
-
2020-12-14soldstatus $595,000
-
2020-12-14soldstatus $595,000
-
2020-12-10soldstatus $51,678
-
2020-12-10soldstatus $51,678 Closed
-
2020-12-10$51,678
-
2020-12-10$51,678 Active
-
2017-01-09soldstatus $605,000
-
2016-12-29soldstatus $26,923
-
2016-12-29soldstatus $26,923 Closed
-
2016-11-15status Pending
-
2016-10-17Active
-
2016-10-03
-
2009-04-17historical
-
2009-04-16historical
-
2008-10-07$22,500
-
2008-10-07$22,500
ⓘ Source: listings_history table (triggers on properties + properties_extension) + one-shot
backfill from property_details.listing_events for pre-trigger history.
Tax reassessment forecast MI · Partial reset (capped growth)
- Current annual tax
- $1,686 · $141/mo
- Projected year-2 tax
- $1,766 · $147/mo
- Expected delta
- +$80/yr (+$7/mo · 4.7%)
ⓘ Screening estimate from a state-policy table — verify with the county assessor before closing.
Climate risk First Street
- Flood 1/10 Low FEMA zone X (unshaded) · 0% chance over 30 yrs
- Wildfire 1/10 Low
- Heat 3/10 Moderate 7 d/yr ≥98°F today · 16 d/yr by 30 yrs out
- Wind 2/10 Low
- Air quality 2/10 Low 1 unhealthy d/yr today · 1 by 30 yrs out
Nearby sold comps map
Loading sold comps map…
Walkable amenities ~0.75 mi
Loading nearby amenities…
Taxation est. · year 1
- Rental income
- $19,874
- − Mortgage interest
- −$6,716
- − Property taxes
- −$1,686
- − Insurance
- −$600
- − Repairs & maintenance
- −$1,590
- − Management
- −$1,590
- − Depreciation
- −$3,488
- Taxable income
- $4,204
- Est. tax owed @ 24.0%
- −$1,009
- After-tax cash flow
- $4,860/yr
For passive investors: Depreciation is non-cash, so a rental often shows a tax loss while cash-flowing — sheltering income. Rental losses are passive: they offset passive income freely, and up to $25,000/yr can offset ordinary (W-2) income if you actively participate and your MAGI is under $100k (phasing out to $0 by $150k); unused losses carry forward. On sale, claimed depreciation is recaptured at up to 25%, and gains may owe capital-gains tax (a 1031 exchange can defer both). Figures are a year-1 estimate at your 24.0% rate — not tax advice; consult a CPA.
Schools (NCES district)
- District
- Adrian School District
- NCES district ID
- 2601950
- Math proficiency
- 25% ▼ -1.00%
- Reading proficiency
- 35% ▼ -2.00%
- Median HH income
- $41,288
- Composite
- 25.33/100
- National rank
- #7480
- State rank
- #370 of 540 in MI
Livability — Adrian
- Score
- 69/100
- State rank
- #342
- US rank
- #8722
Category grades
Schools grade is shown separately in the Schools card above.
Census & demographics
- Census place
- Adrian, MI
- City population
- 41,041
- Population (ZIP)
- 41,041
Population outlook (Lenawee County) Hauer SSP2
- Today (2025)
- 95,497 people
- By 2030
- 92,722 · -2.9%
- By 2040
- 85,641 · -10.3%
- By 2050
- 77,971 · -18.4%
- By 2075
- 60,043 · -37.1%
- By 2100
- 41,468 · -56.6%
Race, ethnicity, and origin ACS 2023
- Neighborhood character
- Predominantly White (77%)
- Race & ethnicity
- White 77% Hispanic / Latino 14% Two or more races 8% Black 4%
- Hispanic origin (detail)
- Mexican 12%
- Common ancestry
- Romanian 3% Lithuanian 3% Italian 2%
- Foreign-born
- 3% · Canada
- Languages at home
- 93% English-only · Spanish 6% Arabic 1%
Political lean MEDSL · Lenawee
- 2024 margin
- Strong R (+23.0) · D 37.8% · R 60.8% · Other 1.4%
- 2008→2024 swing
- -28.1pp toward R · 2008: 5.1pp · 2024: -23.0pp
- All cycles
- 2024: R+23.0 2020: R+19.9 2016: R+21.1 2012: R+1.3 2008: D+5.1
Not yet ingested
- Civics
- —
Market trends
- HPI YoY
- ▼ -143.64%
- Current HPI
- 237.3796
- Rent YoY
- —
- Metro
- —
- State GDP YoY
- ▲ 1.37%
- F500 in state
- 28
Industry mix (Fortune 500 HQ in MI)
| Industry | F500 HQs | Revenue |
|---|---|---|
| Automotive Parts | 3 | $48B |
|
||
| Automotive | 2 | $372B |
|
||
| Chemicals | 1 | $45B |
|
||
| Automotive Retail | 1 | $29B |
|
||
| Healthcare / Medical Devices | 1 | $23B |
|
||
| Automotive Technology | 1 | $20B |
|
||
Price history
+464.0% since first listed26 events — show timeline
- 2026-04-07 Price Changed $126,900 MiRealSource-MiMLS
- 2026-04-06 Price Changed $126,900 REALCOMP
- 2026-03-20 Listed $129,900 REALCOMP
- 2026-03-20 Listed $129,900 MiRealSource-MiMLS
- 2024-05-22 Listing Removed — MiRealSource-MiMLS
- 2024-05-22 Listing Removed — REALCOMP
- 2024-04-17 Price Changed $85,000 MiRealSource-MiMLS
- 2024-04-17 Price Changed $85,000 REALCOMP
- 2024-03-15 Listed $89,000 MiRealSource-MiMLS
- 2024-03-15 Listed $89,000 REALCOMP
- 2020-12-14 Sold (Public Records) $595,000 Public Records
- 2020-12-14 Sold (Public Records) $595,000 Public Records
- 2020-12-10 Listed $51,678 MiRealSource-MiMLS
- 2020-12-10 Listed $51,678 REALCOMP
- 2020-12-10 Sold (MLS) $51,678 MiRealSource-MiMLS
- 2020-12-10 Sold (MLS) $51,678 REALCOMP
- 2017-01-09 Sold (Public Records) $605,000 Public Records
- 2016-12-29 Sold (MLS) $26,923 MiRealSource-MiMLS
- 2016-12-29 Sold (MLS) $26,923 REALCOMP
- 2016-11-15 Pending — MiRealSource-MiMLS
- 2016-10-17 Listed — MiRealSource-MiMLS
- 2016-10-03 Listed — REALCOMP
- 2009-04-17 Listing Removed — REALCOMP
- 2009-04-16 Listing Removed — MiRealSource-MiMLS
- 2008-10-07 Listed $22,500 REALCOMP
- 2008-10-07 Listed $22,500 MiRealSource-MiMLS
Property tax history
+2.8%/yrLatest (2025): $1,686 · -22.1% YoY. Source: county tax records.
Cash-flow waterfall
monthlySold comps — $/sqft
last 12 mo · ≤1 miLoading sold comps…