4944 County Road 3506 · Greenville, TX
Flood risk 1/10 · Minimal
- FEMA flood zone
- X (unshaded)
- Chance of flooding over 30 yrs
- 0.0%
- Est. flood insurance / yr
- $507 – $1,088
Fire risk 6/10 · Moderate
- Est. fire insurance / yr
- $1,222 – $2,270
Heat risk 7/10 · Major
- Hot days now (above 111°F)
- 7 days/yr
- Hot days in 30 yrs
- 24 days/yr
Wind risk 6/10 · Moderate
- Chance of severe wind over 30 yrs
- 27.0%
Air-quality risk 2/10 · Minimal
- Unhealthy air days now
- 1 days/yr
- Unhealthy air days in 30 yrs
- 1 days/yr
Risk factors via First Street. Map © Google.
Why this score? — see what drove the D+ grade
The composite is a weighted blend of 9 inputs, each scored 0–100. Each bar is that input's sub-score; the figure is the points it added to the 100-point composite (weight × sub-score).
- ARV discount +15.0/15.0
- Appreciation +10.0/10.0
- Cash flow +9.4/30.0
- Livability +3.9/5.0
- Schools +3.7/10.0
- DSCR +2.6/10.0
- Rent growth +2.5/5.0
- 1% rule +1.5/10.0
- Condition / age +1.0/5.0
$249,900
🖨 Deal sheet (PDF) 📄 Offer letter ✓ Due diligence
Listing remarks
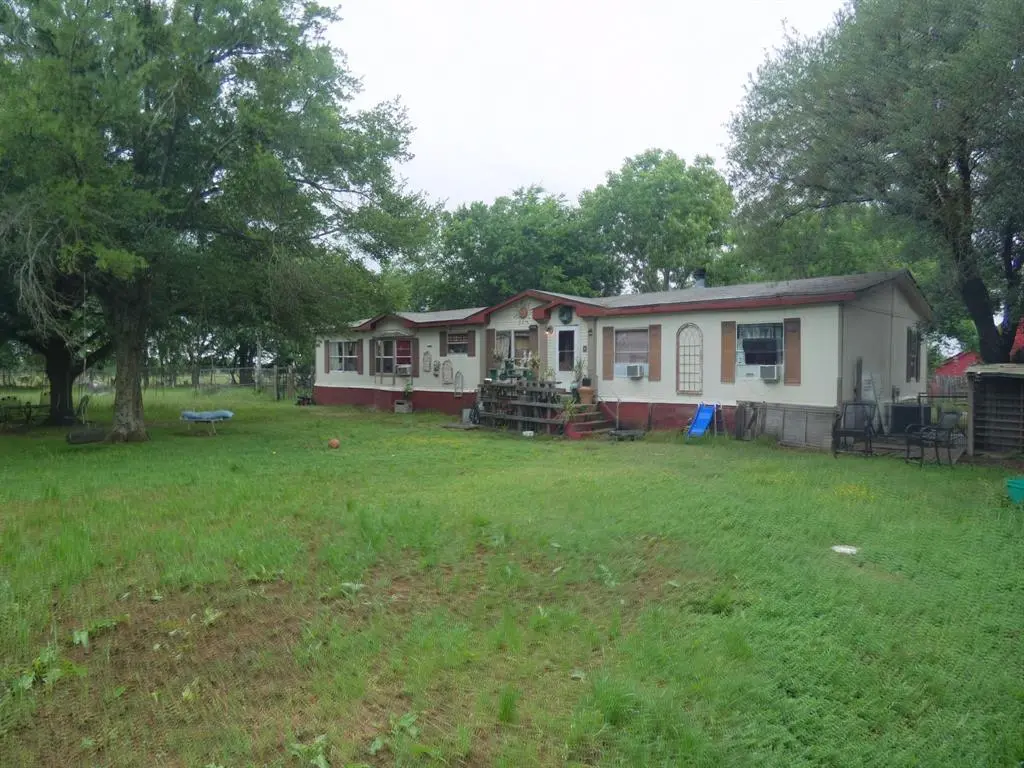
Situated on 8.8 acres in rural Hunt County, this property offers a unique opportunity for investors or buyers looking to create value through renovation. The 2,126 SF doublewide home is in poor condition and will require significant repairs, but the groundwork is in place for a rewarding project. Multiple barns and storage buildings provide added utility for agricultural, workshop, or equipment use. The land is fenced and cross-fenced, making it well-suited for livestock or rural living. Priced below assessed value and offered strictly as-is, this property presents strong upside potential for those ready to put in the work. 7.8 acres of the propert are Ag exempt, making the tax burden low.
Key facts
- Multiple barns
- Storage buildings
- 8.8 acres
Tags
Property features AI
Finance
- Other: Property has agricultural exemption; Current use includes agricultural, horses, livestock, and mobile home; Will not subdivide
- Financial info: Listing accepts cash and conventional terms
- HOA & community: No association
Exterior
- Parking: Driveway; Gravel parking
- Utilities: Electricity connected; Asphalt and electricity listed under utilities; No municipal utility district
- Home design: Single family residence; One story; Residential use with agricultural/equine potential; Suitable for horses and livestock; Multi-parcel property
- Construction: Built in 1996; Siding exterior; Asphalt roof; Pillar/post/pier foundation; Three barns on the property
- Exterior features: Rear porch; Dog run; Stable/barn; Fenced; Cross-fenced; Barbed wire fencing; One tank/pond on property; Utilities easement present; County road frontage; Asphalt road surface
Interior
- Kitchen: Electric range
- Bedrooms: 4 bedrooms (primary bedroom on main level)
- Flooring: Tile; Vinyl
- Bathrooms: 2 full bathrooms
- Heating & cooling: Central heating; Wall/window cooling units
- Interior features: High speed internet available; Two living areas; One dining area; Room count: 6
- Laundry & utility: Utility room
Neighborhood map
What this means for you Summary
Snapshot
- This is a 4-bed/2.0-bath manufactured listed at $250k. Condition is rated poor.
Deal economics
- At list price, monthly cash flow is $-180 ($-2k/yr) — negative.
- To cash-flow at today's rent, offer at most $218k (12.7% below list).
- To meet the 1% rule (rent ≥ 1% of price), the offer needs to be $163k (34.7% below list).
- Recommended offer: $163k (34.7% below list) — sets the bar for 1% rule.
- Cap rate 5.4% vs local median 4.1% in Greenville — top-decile yield for the area; either an underpriced asset or a hidden risk that comps aren't pricing in. Stress-test before assuming the spread holds.
Location & tenants
- Location reads 77/100 on livability (#78 in TX, #2,719 nationally) — a middle-class / working-renter tenant base. Strengths: cost of living A+, housing A+, health & safety A; Watch: employment D, commute F.
- Lone Oak ISD (rural): math 42% / reading 43% proficiency, ranked #310 of 826 in TX (top 38%) — families likely to look elsewhere, expect single-tenant / working-renter base with shorter leases.
- Zoned schools: Lone Oak El (math 37% / reading 42%, grade F, #1,545 of 4,322 statewide, top 38%, 489 students, 45% FRL); Lone Oak Middle (math 45% / reading 43%, grade D, #512 of 1,662 statewide, top 32%, 254 students, 48% FRL); Lone Oak H S (math 52% / reading 47%, grade D, #509 of 1,632 statewide, top 34%, 340 students, 43% FRL).
- Market conditions: 336 active listings in the ZIP; 1,289 units permitted in Hunt County in 2024 (527 in 5+ unit buildings).
- This rent runs 31% of the median local income ($64k/yr) — at the standard rent-burdened threshold; future hikes will face affordability resistance.
Forward outlook
- In year one you build about $27k of equity ($2k loan paydown + $25k appreciation (10.0% local appreciation)).
- Hunt County population projected at +15% by 2050 — modest demand growth; plan on rents tracking national, not racing it.
- By year 2, paydown + projected appreciation supports a ~$43k cash-out refi (75% LTV) — recoverable capital for the next deal without selling this one.
Negotiation context
- It's been on market 60 days — a 3% lower offer ($242k) is reasonable based on typical stale-listing flexibility.
Risks & watch-outs
- Climate carrying-cost: major wind risk, 27% chance of damaging wind over 30y; major wildfire risk; extreme-heat days projected 7→24/yr by 2055 (HVAC capex compounding) — expect insurance premiums to compound above CPI over the hold.
Questions for the listing agent
- What do current leases actually rent for vs. the listed asking? Can we see a recent rent roll and the last 12 months of T-12 income?
- It's been on market 60 days. Have you received any prior offers? Is the seller open to a 35% concession, seller financing, or rate buy-down credit?
- Have any recent inspections been done? Can we get a copy of the seller's disclosures and any deferred-maintenance estimates?
- Is there a deadline driving the sale (1031 exchange, divorce, estate, relocation)? That informs how much negotiation room exists.
- Schools are D-rated, which usually means shorter tenancies and higher turnover. Who's the typical renter profile here, and what's been the actual vacancy rate?
- The area grade is low — what's the realistic commute time and amenity access for the typical tenant pool here? Any planned neighborhood developments (good or bad) we should know about?
- What's the average days-on-market for RENTAL listings here right now (not sales)? A rising rental-DOM trend means longer vacancies and softer asking-rent achievability than the comps imply.
- What's the recent tenant-quality profile in this submarket — average credit score on applications, eviction rate, late-payment / NSF rate, and stable-employment percentage? A property-management company in the area should have these aggregated.
- How much new for-sale + rental construction is in the pipeline within 1–3 miles? Heavy new supply typically softens prices + rents 12–24 months out; constrained supply supports both.
Investment metrics
- 1% rule
- 0.65% ✗
- Cap rate
- 5.43%
- Cash-on-cash
- -3.09%
- DSCR
- 0.86
- GRM
- 12.8
CMA / ARV
- ARV (median comp)
- $358,881
- List price
- $249,900
- Delta
- -30.37%
- Verdict
- UNDERPRICED
- Comps
- 3 within 1.0 mi
Projected returns pro-forma
10.0% appreciation · 3.0% rent growth · sell at horizon
- IRR
- 22.1%
- Equity multiple
- 2.78×
- Total profit
- $124,483
- Equity at exit
- $225,130
- IRR
- 19.8%
- Equity multiple
- 6.36×
- Total profit
- $375,351
- Equity at exit
- $485,501
Cash invested: $69,972 (down + closing). Projections, not guarantees.
Landlord ↔ Tenant lean methodology
- Overall (STATE)
- 87 Strongly Landlord-Friendly
- State Texas
- 87 Strongly Landlord-Friendly · R+5
- County
- — inherits STATE
- City
- — inherits STATE
ZIP-level market 75474
- Home prices YoY
- 7.5%
- Active inventory
- 336
- Price-to-rent
- 12.8×
Monthly cashflow live
- Estimated rent
- $1,633 medium interval (Pro) →
- Mortgage (P&I)
- −$1,311
- Tax from tax record
- −$56 /mo · $668/yr
- Insurance
- −$104
- HOA
- −$0
- Vacancy / Maint / Mgmt
- −$343
- Net cashflow
- $-180
Break-even live
Sensitivity live
| Price | -10% $-39 | -5% $-110 | +0% $-180 | +5% $-251 | +10% $-322 |
|---|---|---|---|---|---|
| Rent | -10% $-309 | -5% $-245 | +0% $-180 | +5% $-116 | +10% $-51 |
| Rate | -1.0pp $-54 | -0.5pp $-117 | base $-180 | +0.5pp $-245 | +1.0pp $-311 |
UW: 25.0% down · 7.5% · 30yr · 1.5% tax · 5.0% vac · 8.0% maint · 8.0% mgmt
Financing live
Cash to close
- Down payment
- $62,475
- Closing costs
- $7,497
- Reserves months
- —
- Total cash needed
- —
Loan-product check · same deal, 3 products live
Conventional
25% down · 7.5% · 30yr
- Down + closing
- —
- Monthly P&I
- —
- Monthly cashflow
- —
- DSCR
- —
- Eligible?
- —
Personal DTI + credit; lowest rate.
DSCR
20% down · 8.5% · 30yr
- Down + closing
- —
- Monthly P&I
- —
- Monthly cashflow
- —
- DSCR
- —
- Eligible?
- —
No personal income docs; deal must DSCR.
Hard money
10% down · 12.0% · 12mo
- Down + closing
- —
- Monthly P&I
- —
- Monthly cashflow
- —
- DSCR
- —
- Eligible?
- —
Short-term bridge; refi at stabilization.
Listing history 17 events
-
2026-06-21days on market $249,900 Active 60 DOM
-
2026-06-18days on market $249,900 Active 57 DOM
-
2026-06-18price $249,900 Active 56 DOM
-
2026-06-17days on market $259,900 Active 56 DOM
-
2026-06-16days on market $259,900 Active 55 DOM
-
2026-06-15days on market $259,900 Active 54 DOM
-
2026-06-13days on market $259,900 Active 52 DOM
-
2026-06-09days on market $259,900 Active 48 DOM
-
2026-06-08days on market $259,900 Active 47 DOM
-
2026-06-07days on market $259,900 Active 46 DOM
-
2026-06-04days on market $259,900 Active 43 DOM
-
2026-06-03days on market $259,900 Active 42 DOM
-
2026-06-02days on market $259,900 Active 41 DOM
-
2026-06-01days on market $259,900 Active 40 DOM
-
2026-05-31days on market $259,900 Active 39 DOM
-
2026-05-15price $259,900 1315-char remark
-
2026-04-22$269,900 Active 1315-char remark
ⓘ Source: listings_history table (triggers on properties + properties_extension) + one-shot
backfill from property_details.listing_events for pre-trigger history.
Tax reassessment forecast TX · Resets to sale price
- Current annual tax
- $668 · $56/mo
- Projected year-2 tax
- $4,573 · $381/mo
- Expected delta
- +$3,905/yr (+$325/mo · 584.3%)
ⓘ Screening estimate from a state-policy table — verify with the county assessor before closing.
Climate risk First Street
- Flood 1/10 Low FEMA zone X (unshaded) · 0% chance over 30 yrs
- Wildfire 6/10 Major
- Heat 7/10 Severe 7 d/yr ≥111°F today · 24 d/yr by 30 yrs out
- Wind 6/10 Major 27% chance of damaging wind over 30 yrs
- Air quality 2/10 Low 1 unhealthy d/yr today · 1 by 30 yrs out
Nearby sold comps map
Loading sold comps map…
Walkable amenities ~0.75 mi
Loading nearby amenities…
Taxation est. · year 1
- Rental income
- $19,595
- − Mortgage interest
- −$13,998
- − Property taxes
- −$668
- − Insurance
- −$1,250
- − Repairs & maintenance
- −$1,568
- − Management
- −$1,568
- − Depreciation
- −$7,270
- Taxable loss
- −$6,726
- Est. tax savings @ 24.0%
- +$1,614
- After-tax cash flow
- $-550/yr
For passive investors: Depreciation is non-cash, so a rental often shows a tax loss while cash-flowing — sheltering income. Rental losses are passive: they offset passive income freely, and up to $25,000/yr can offset ordinary (W-2) income if you actively participate and your MAGI is under $100k (phasing out to $0 by $150k); unused losses carry forward. On sale, claimed depreciation is recaptured at up to 25%, and gains may owe capital-gains tax (a 1031 exchange can defer both). Figures are a year-1 estimate at your 24.0% rate — not tax advice; consult a CPA.
Condition & rehab AI · 1 photo
This 2,126 SF doublewide manufactured home on 8.8 acres in rural Hunt County requires extensive repairs and maintenance, but presents strong upside potential for investors ready to put in the work.
Repairs flagged
- Major siding — Weathered and in poor condition
- Major landscaping — Overgrown vegetation
Value-add opportunities
- Both landscaping and exterior maintenance — Improves curb appeal and property value
- Both exterior siding repair — Enhances property appearance and value
- Both HVAC/mechanical inspection and repair — Ensures comfort and energy efficiency
- Both interior painting and repairs — Enhances property appearance and value
- Both bathroom and kitchen updates — Improves functionality and value
Renovation cost estimate screening
| Repair item | Severity | Est. cost |
|---|---|---|
| siding · Weathered and in poor condition | Major | $15,000–50,000 |
| landscaping · Overgrown vegetation | Major | $15,000–50,000 |
| Total estimated repair cost · 2 items | $30,000–100,000 |
Value-add ROI direction
- Both landscaping and exterior maintenance — Improves curb appeal and property value ↑
- Both exterior siding repair — Enhances property appearance and value ↑
- Both HVAC/mechanical inspection and repair — Ensures comfort and energy efficiency ↑
- Both interior painting and repairs — Enhances property appearance and value ↑
- Both bathroom and kitchen updates — Improves functionality and value ↑
ⓘ Cost ranges are severity-bucket heuristics (US national rule-of-thumb). Get contractor quotes + a written scope before underwriting a rehab budget.
Schools (NCES district)
- District
- Lone Oak ISD
- NCES district ID
- 4828020
- Math proficiency
- 42% ▼ -9.00%
- Reading proficiency
- 43% ▼ -7.00%
- Median HH income
- $51,628
- Composite
- 36.72/100
- National rank
- #4593
- State rank
- #310 of 826 in TX
Livability — Greenville
- Score
- 77/100
- State rank
- #78
- US rank
- #2719
Category grades
Schools grade is shown separately in the Schools card above.
Census & demographics
- County
- Hunt County · 71,969 people
- City population
- 42,767
- Metro
- Dallas-Fort Worth-Arlington, TX
- Population (ZIP)
- 17,671
- Household income
- $64,103
- Rent vs Own
- Severe rent burden
- 181.0
Population outlook (Hunt County) Hauer SSP2
- Today (2025)
- 97,090 people
- By 2030
- 100,452 · +3.5%
- By 2040
- 106,544 · +9.7%
- By 2050
- 111,218 · +14.6%
- By 2075
- 121,695 · +25.3%
- By 2100
- 123,683 · +27.4%
Race, ethnicity, and origin ACS 2023
- Neighborhood character
- Predominantly White (74%)
- Race & ethnicity
- White 74% Hispanic / Latino 19% Two or more races 8% Asian 1% Black 1%
- Hispanic origin (detail)
- Mexican 17%
- Common ancestry
- Lithuanian 2% Romanian 2% Iranian 1%
- Foreign-born
- 8% · Canada
- Languages at home
- 88% English-only · Spanish 10% Other Asian/Pacific 1%
Political lean MEDSL · Hunt
- 2024 margin
- Solid R (+55.5) · D 21.9% · R 77.4%
- 2008→2024 swing
- -14.9pp toward R · 2008: -40.6pp · 2024: -55.5pp
- All cycles
- 2024: R+55.5 2020: R+52.5 2016: R+56.3 2012: R+51.2 2008: R+40.6
Not yet ingested
- Civics
- —
Market trends
- HPI YoY
- ▲ 33.95%
- Current HPI
- 484.21
- Rent YoY
- —
- Metro
- Dallas-Fort Worth-Arlington, TX
- State GDP YoY
- ▲ 3.95%
- F500 in state
- 110
Industry mix (Fortune 500 HQ in TX)
| Industry | F500 HQs | Revenue |
|---|---|---|
| Energy | 16 | $1,198B |
|
||
| Technology | 5 | $198B |
|
||
| Engineering / Construction | 4 | $72B |
|
||
| Energy Services | 3 | $60B |
|
||
| Utilities | 3 | $41B |
|
||
| Healthcare | 2 | $330B |
|
||
Price history
-7.4% since first listed3 events — show timeline
- 2026-06-18 Price Changed $249,900 NTREIS
- 2026-05-15 Price Changed $259,900 NTREIS
- 2026-04-22 Listed $269,900 NTREIS
Property tax history
-17.7%/yrLatest (2025): $668 · -39.7% YoY. Source: county tax records.
Cash-flow waterfall
monthlySold comps — $/sqft
last 12 mo · ≤1 miLoading sold comps…