 🌊 Lakefront
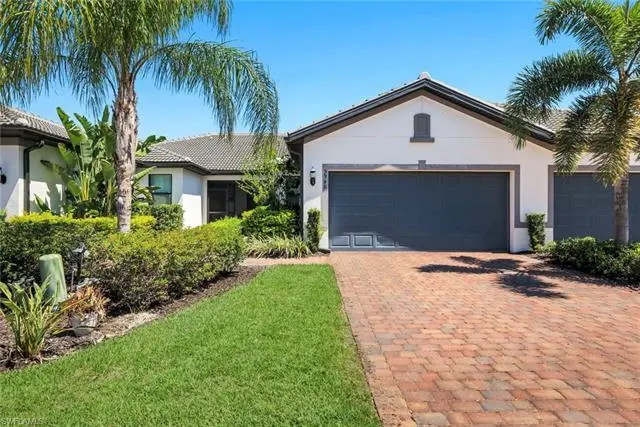
5948 Mayflower Way · Ave Maria, FL
Flood risk 1/10 · Minimal
- FEMA flood zone
- X (unshaded)
- Chance of flooding over 30 yrs
- 0.0%
- Est. flood insurance / yr
- $507 – $1,088
Fire risk 5/10 · Moderate
- Est. fire insurance / yr
- $947 – $1,759
Heat risk 10/10 · Severe
- Hot days now (above 112°F)
- 7 days/yr
- Hot days in 30 yrs
- 28 days/yr
Wind risk 10/10 · Severe
- Chance of severe wind over 30 yrs
- 99.0%
Air-quality risk 2/10 · Minimal
- Unhealthy air days now
- 0 days/yr
- Unhealthy air days in 30 yrs
- 1 days/yr
Risk factors via First Street. Map © Google.
Why this score? — see what drove the C grade
The composite is a weighted blend of 9 inputs, each scored 0–100. Each bar is that input's sub-score; the figure is the points it added to the 100-point composite (weight × sub-score).
- Cash flow +15.6/30.0
- ARV discount +14.4/15.0
- 1% rule +5.8/10.0
- Schools +5.0/10.0
- DSCR +4.8/10.0
- Appreciation +4.5/10.0
- Condition / age +4.0/5.0
- Rent growth +3.2/5.0
- Livability +2.5/5.0
$339,990
🖨 Deal sheet (PDF) 📄 Offer letter ✓ Due diligence
Listing remarks
LIKE NEW BUT WITH A SUPERIOR VIEW! Wake up to breathtaking, unobstructed water and golf course views—a rare find you simply won’t get in new construction. The extended screened lanai at the back of this home showcases 180-degree panoramic scenery with upgraded pavers, creating the perfect setting to enjoy spectacular sunrises and peaceful mornings overlooking the water. This attached villa lives like a single-family home (not a condo) and offers both privacy and peace of mind, featuring impact-resistant windows and doors and a quiet cul-de-sac location—away from traffic and construction. Inside, the home is bright, open, and thoughtfully designed. The contemporary kitchen
Key facts
- Golf course views
- 2 garage spots
- Community pool
Tags
Property features AI
Finance
- HOA & community: Mandatory HOA; Quarterly HOA fee: $1,218; Master HOA quarterly fee: $203; On-site management; HOA maintenance covers cable, internet/WiFi, irrigation water, lawn/land maintenance, legal/accounting, manager, recreation facilities, reserves, street lights, street maintenance and trash removal; Community amenities include clubhouse, community pool and spa, exercise room, tennis and pickleball courts, bocce, putting green, golf course (non-equity), dog park, bike/jog paths, restaurant, library, billiards, hobby room, sauna, sidewalks and underground utilities; Total annual recurring fees: $5,684; Total one-time fees: $1,575; One-time special assessment fee: $1,375
Exterior
- Parking: Attached 2-car garage; Paved driveway
- Security: Gated community
- Utilities: Central water; Central sewer; Cable available
- Home design: Residential villa (attached); 1-story ranch; Rear exposure: East; Located in the Ave Maria development
- Construction: Concrete block construction; Tile roof; Built in 2022
- Exterior features: Pond; Automatic sprinkler system; Impact-resistant doors and windows; Single hung and sliding windows; Stucco exterior; Gated community
Interior
- Kitchen: Pantry; Dishwasher; Disposal; Microwave; Range; Self-cleaning oven; Refrigerator/Freezer; Refrigerator/ice maker
- Bedrooms: 2 bedrooms plus den (split bedroom floor plan)
- Flooring: Carpet; Tile
- Bathrooms: 2 full bathrooms; Master bathroom with dual sinks and shower-only configuration
- Heating & cooling: Central electric heat; Central electric air conditioning; Ceiling fans
- Interior features: Cable prewire; Foyer; French doors; High-speed internet available; Pantry; Smoke detectors; Window coverings; Breakfast bar; Dining/family area; Den (study); Great room; Guest bath; Screened lanai/porch; Unfurnished; 2 ceiling fans
- Laundry & utility: Washer and dryer (in residence)
Neighborhood map
What this means for you Summary
Snapshot
- This is a 2-bed/2.0-bath single-family listed at $340k. Condition is rated good.
Deal economics
- At list price, monthly cash flow is $143 ($2k/yr) — positive.
- The deal already cash-flows at list — no discount required.
- Meets the 1% rule at list price ($4k rent vs $340k).
- Recommended offer: $320k (6.0% below list) — sets the bar for market timing.
Location & tenants
- Location reads: area grade C — affects rentability + tenant quality, not the cash-flow math above.
- Collier (suburban): math 60% / reading 56% proficiency, ranked #16 of 73 in FL (top 22%) — acceptable for families but not a draw, mixed tenant base, ~2y average lease.
- Zoned schools: Estates Elementary School (math 70% / reading 67%, grade B+, #409 of 2,144 statewide, top 20%, 862 students, 53% FRL); Palmetto Ridge High School (math 43% / reading 51%, grade D-, #207 of 667 statewide, top 32%, 2,347 students, 38% FRL).
- Market conditions: Rents rising (+3.0%/yr); 449 active listings in the ZIP; 40 comparable units currently listed for rent nearby; rentals at typical pace (median 24d on market — plan ~3-4 weeks tenant-placement turnaround); 3,520 units permitted in Collier County in 2024 (959 in 5+ unit buildings).
- At $3,687/mo this rent would consume 71% of the median local household income ($62k/yr) (locally 1093% of renters already pay >50% of income on rent) — very limited rent-growth headroom before tenants either downsize or default.
Forward outlook
- Local home prices are declining (-1.1%/yr); year-one equity from $2k of loan paydown is wiped out by about $4k of value loss. Plan a longer hold.
- Collier County population projected at +30% by 2050 — long-run rental-demand tailwind backs the buy-and-hold thesis.
Negotiation context
- It's been on market 85 days — a 6% lower offer ($320k) is reasonable based on typical stale-listing flexibility.
- 5 sale attempts since 4y ago with the ask held roughly flat each time — persistent listings suggest the price (not the market) is what's stuck; bring a comps-based counter.
Risks & watch-outs
- Climate carrying-cost: severe wind risk, 99% chance of damaging wind over 30y; moderate wildfire risk; extreme-heat days projected 7→28/yr by 2055 (HVAC capex compounding) — expect insurance premiums to compound above CPI over the hold.
Questions for the listing agent
- It's been on market 85 days. Have you received any prior offers? Is the seller open to a 6% concession, seller financing, or rate buy-down credit?
- What does the HOA fee cover, when was the last increase, and are there any pending special assessments or reserve-fund shortfalls?
- Why hasn't it sold? Are there any deal-killer items the seller is aware of (foundation, flood, title, zoning, code violations)?
- Is there a deadline driving the sale (1031 exchange, divorce, estate, relocation)? That informs how much negotiation room exists.
- This sits on a lake — are riparian / water-frontage rights deeded with the parcel? Any dock permits, shoreline easements, or HOA water-use restrictions?
- What's the documented flood / surge / shoreline-erosion history here (FEMA AND non-FEMA — e.g., storm surge, creek backup, septic-field saturation)?
- Any water-quality or seasonal algae-bloom issues that affect tenant satisfaction or short-term-rental demand?
- What's the average days-on-market for RENTAL listings here right now (not sales)? A rising rental-DOM trend means longer vacancies and softer asking-rent achievability than the comps imply.
- What's the recent tenant-quality profile in this submarket — average credit score on applications, eviction rate, late-payment / NSF rate, and stable-employment percentage? A property-management company in the area should have these aggregated.
- How much new for-sale + rental construction is in the pipeline within 1–3 miles? Heavy new supply typically softens prices + rents 12–24 months out; constrained supply supports both.
Investment metrics
- 1% rule
- 1.08% ✓
- Cap rate
- 6.80%
- Cash-on-cash
- 1.80%
- DSCR
- 1.08
- GRM
- 7.7
CMA / ARV
- ARV (on-the-fly)
- $401,500
- Comps found
- 1
Show comp detail 1 sale within ~0.75 mi
| Address | Dist | Beds/Ba | Sqft | Sold | Price | $/sf | Match |
|---|---|---|---|---|---|---|---|
| 6373 Liberty St | 0.50mi | 2/2.0 | 1,674 (+15%) | 11mo | $460,000 | $275 | 43 |
Match score weights: distance 35% · size 25% · config 20% · recency 20%. Top-matched comps best support the ARV.
Projected returns pro-forma
-1.05% appreciation · 2.95% rent growth · sell at horizon
- IRR
- -4.1%
- Equity multiple
- 0.82×
- Total profit
- $-17,129
- Equity at exit
- $81,283
- IRR
- 2.7%
- Equity multiple
- 1.25×
- Total profit
- $24,228
- Equity at exit
- $84,685
Cash invested: $95,197 (down + closing). Projections, not guarantees.
Landlord ↔ Tenant lean methodology
- Overall (STATE)
- 87 Strongly Landlord-Friendly
- State Florida
- 87 Strongly Landlord-Friendly · R+3
- County
- — inherits STATE
- City
- — inherits STATE
ZIP-level market 34142
- Home prices YoY
- -0.5%
- Rents YoY
- 3.0%
- Active inventory
- 449
- Price-to-rent
- 7.7×
Monthly cashflow live
- Estimated rent
- $3,687 high interval (Pro) →
- Mortgage (P&I)
- −$1,783
- Tax from tax record
- −$372 /mo · $4,462/yr
- Insurance
- −$142
- HOA
- −$474
- Vacancy / Maint / Mgmt
- −$774
- Net cashflow
- $143
Break-even live
Sensitivity live
| Price | -10% $335 | -5% $239 | +0% $143 | +5% $46 | +10% $-50 |
|---|---|---|---|---|---|
| Rent | -10% $-149 | -5% $-3 | +0% $143 | +5% $288 | +10% $434 |
| Rate | -1.0pp $314 | -0.5pp $229 | base $143 | +0.5pp $54 | +1.0pp $-35 |
UW: 25.0% down · 7.5% · 30yr · 1.5% tax · 5.0% vac · 8.0% maint · 8.0% mgmt
Financing live
Cash to close
- Down payment
- $84,998
- Closing costs
- $10,200
- Reserves months
- —
- Total cash needed
- —
Loan-product check · same deal, 3 products live
Conventional
25% down · 7.5% · 30yr
- Down + closing
- —
- Monthly P&I
- —
- Monthly cashflow
- —
- DSCR
- —
- Eligible?
- —
Personal DTI + credit; lowest rate.
DSCR
20% down · 8.5% · 30yr
- Down + closing
- —
- Monthly P&I
- —
- Monthly cashflow
- —
- DSCR
- —
- Eligible?
- —
No personal income docs; deal must DSCR.
Hard money
10% down · 12.0% · 12mo
- Down + closing
- —
- Monthly P&I
- —
- Monthly cashflow
- —
- DSCR
- —
- Eligible?
- —
Short-term bridge; refi at stabilization.
Rent comps 40 comps
| Address | Beds | Baths | Sqft | Rent | $/sqft | DOM | Units | Dist |
|---|---|---|---|---|---|---|---|---|
| 5935 Mayflower Way Ave Maria, FL | 2.0 | 2.0 | 1460 | $2,550 | $1.75 | 24d | 1 | 0.03mi |
| 5988 Mayflower Way Ave Maria, FL | 2.0 | 2.0 | 1602 | $5,200 | $3.25 | 24d | 1 | 0.06mi |
| 5769 Mayflower Way Ave Maria, FL | 2.0 | 2.0 | 1554 | $4,000 | $2.57 | 24d | 1 | 0.30mi |
| 5705 Mayflower Way #1407 Ave Maria, FL | 2.0 | 2.0 | 1536 | $2,250 | $1.46 | 24d | 1 | 0.40mi |
| 6441 Liberty St Ave Maria, FL | 3.0 | 2.0 | 1685 | $5,795 | $3.44 | 24d | 1 | 0.47mi |
| 5697 Mayflower Way Ave Maria, FL | 2.0 | 2.0 | 1538 | $2,495 | $1.62 | 24d | 1 | 0.47mi |
| 5690 Mayflower Way #601 Ave Maria, FL | 3.0 | 2.0 | 1815 | $5,500 | $3.03 | 24d | 1 | 0.53mi |
| 5690 Mayflower Way Ave Maria, FL | 3.0 | 2.0 | 1815 | $3,295 | $1.82 | 24d | 1 | 0.53mi |
| 6168 Harmony Dr Immokalee, FL | 3.0 | 2.0 | 1570 | $5,495 | $3.50 | 14d | 1 | 0.87mi |
| 6189 Harmony Dr Immokalee, FL | 3.0 | 2.0 | 1558 | $6,295 | $4.04 | 24d | 1 | 0.93mi |
| 6205 Harmony Dr Immokalee, FL | 3.0 | 2.0 | 1558 | $5,000 | $3.21 | 24d | 1 | 0.96mi |
| 8010 Helena Ct Ave Maria, FL | 2.0 | 2.0 | 1554 | $2,500 | $1.61 | 22d | 1 | 1.12mi |
| 5538 Useppa Dr Ave Maria, FL | 2.0 | 2.5 | 1850 | $10,995 | $5.94 | 24d | 1 | 1.13mi |
| 5435 Pikewood Ct Ave Maria, FL | 2.0 | 2.5 | 1850 | $3,695 | $2.00 | 22d | 1 | 1.20mi |
| 5639 Argento Dr Ave Maria, FL | 3.0 | 2.5 | 1400 | $2,500 | $1.79 | 24d | 1 | 1.20mi |
| 5574 Cassidy Ln Ave Maria, FL | 3.0 | 2.0 | 1630 | $2,250 | $1.38 | 22d | 1 | 1.22mi |
| 5688 Cassidy Ln Ave Maria, FL | 2.0 | 2.0 | 1366 | $2,500 | $1.83 | 14d | 1 | 1.24mi |
| 5704 Melbourne Ct #6712 Ave Maria, FL | 3.0 | 2.0 | 1741 | $7,295 | $4.19 | 24d | 1 | 1.26mi |
| 6039 Ellerston WAY #2017 Ave Maria, FL | 2.0 | 2.0 | 1355 | $6,295 | $4.65 | 24d | 1 | 1.26mi |
| 5629 Double Eagle Cir #4217 Ave Maria, FL | 2.0 | 2.0 | 1154 | $5,795 | $5.02 | 24d | 1 | 1.26mi |
| 5651 Double Eagle Cir #4316 Ave Maria, FL | 2.0 | 2.0 | 1154 | $5,495 | $4.76 | 24d | 1 | 1.26mi |
| 5629 Double Eagle Cir #4223 Ave Maria, FL | 2.0 | 2.0 | 1154 | $2,395 | $2.08 | 24d | 1 | 1.26mi |
| 5715 Double Eagle Cir #4416 Ave Maria, FL | 2.0 | 2.0 | 1154 | $2,100 | $1.82 | 24d | 1 | 1.26mi |
| 5835 Double Eagle CIR #4714 Ave Maria, FL | 2.0 | 2.0 | 1120 | $1,895 | $1.69 | 24d | 1 | 1.26mi |
| 5835 Double Eagle Cir #4726 Ave Maria, FL | 2.0 | 2.0 | 1154 | $2,095 | $1.82 | 14d | 1 | 1.26mi |
| 5710 Melbourne Ct #6511 Ave Maria, FL | 3.0 | 2.0 | 1741 | $7,295 | $4.19 | 24d | 1 | 1.26mi |
| 5651 Double Eagle Cir #4338 Ave Maria, FL | 2.0 | 2.0 | 1301 | $6,295 | $4.84 | 24d | 1 | 1.26mi |
| 5629 Double Eagle Cir #4218 Ave Maria, FL | 3.0 | 2.0 | 1301 | $6,295 | $4.84 | 24d | 1 | 1.26mi |
| 6036 Ellerston WAY #1311 Ave Maria, FL | 3.0 | 2.0 | 1741 | $4,490 | $2.58 | 24d | 1 | 1.26mi |
| 5445 Double Eagle Cir #3011 Ave Maria, FL | 2.0 | 2.0 | 1569 | $2,495 | $1.59 | 24d | 1 | 1.26mi |
| 5909 Berwick Ln Ave Maria, FL | 2.0 | 2.0 | 1850 | $10,995 | $5.94 | 24d | 1 | 1.36mi |
| 5478 Double Eagle Cir #3521 Ave Maria, FL | 2.0 | 2.0 | 1569 | $4,995 | $3.18 | 24d | 1 | 1.38mi |
| 5466 Double Eagle Cir #3425 Ave Maria, FL | 2.0 | 2.0 | 1355 | $5,995 | $4.42 | 24d | 1 | 1.40mi |
| 5454 Double Eagle Cir #3325 Ave Maria, FL | 2.0 | 2.0 | 1355 | $2,495 | $1.84 | 24d | 1 | 1.41mi |
| 6082 National Blvd Ave Maria, FL | 2.0 | 2.0 | 1366 | $4,145 | $3.03 | 24d | 2 | 1.41mi |
| 5433 Double Eagle Cir #2915 Ave Maria, FL | 2.0 | 2.0 | 1366 | $6,295 | $4.61 | 22d | 1 | 1.44mi |
| 5433 Double Eagle Cir Ave Maria, FL | 2.0 | 2.0 | 1366 | $3,295 | $2.41 | 24d | 1 | 1.44mi |
| 5428 Double Eagle Cir #2517 Ave Maria, FL | 2.0 | 2.0 | 1355 | $2,695 | $1.99 | 24d | 1 | 1.45mi |
| 5478 Double Eagle Cir #3515 Ave Maria, FL | 2.0 | 2.0 | 1355 | $2,395 | $1.77 | 24d | 1 | 1.46mi |
| 5479 Double Eagle Cir #3626 Ave Maria, FL | 2.0 | 2.0 | 1154 | $2,200 | $1.91 | 14d | 1 | 1.46mi |
HOA detail
- Monthly dues
- $474 · $5,688/yr
- Likely covers
- water
Listing history 29 events
-
2026-06-18days on market $339,990 Active 85 DOM
-
2026-06-17days on market $339,990 Active 84 DOM
-
2026-06-16days on market $339,990 Active 83 DOM
-
2026-06-15days on market $339,990 Active 82 DOM
-
2026-06-14days on market $339,990 Active 80 DOM
-
2026-06-10days on market $339,990 Active 77 DOM
-
2026-06-09days on market $339,990 Active 76 DOM
-
2026-06-08days on market $339,990 Active 75 DOM
-
2026-06-07days on market $339,990 Active 74 DOM
-
2026-06-03days on market $339,990 Active 70 DOM
-
2026-06-02days on market $339,990 Active 69 DOM
-
2026-06-01days on market $339,990 Active 68 DOM
-
2026-05-31days on market $339,990 Active 67 DOM
-
2026-05-30days on market $339,990 Active 66 DOM
-
2026-03-25$339,990 Active
-
2026-03-17historical
-
2026-02-21price $359,500
-
2026-01-14$367,900 Active
-
2026-01-14historical
-
2025-11-25price $374,500
-
2025-10-31price $380,000
-
2025-08-01$384,900 Active
-
2025-07-30historical
-
2025-05-28price $384,900
-
2025-03-23price $389,900
-
2025-02-07price $399,000
-
2024-10-01$409,900 Active
-
2022-12-02historical
-
2022-09-03$411,900 Active
ⓘ Source: listings_history table (triggers on properties + properties_extension) + one-shot
backfill from property_details.listing_events for pre-trigger history.
Tax reassessment forecast FL · Resets to sale price
- Current annual tax
- $4,462 · $372/mo
- Projected year-2 tax
- $4,462 · $372/mo
- Expected delta
- $0/yr ($0/mo · 0.0%)
ⓘ Screening estimate from a state-policy table — verify with the county assessor before closing.
Climate risk First Street
- Flood 1/10 Low FEMA zone X (unshaded) · 0% chance over 30 yrs
- Wildfire 5/10 Major
- Heat 10/10 Extreme 7 d/yr ≥112°F today · 28 d/yr by 30 yrs out
- Wind 10/10 Extreme 99% chance of damaging wind over 30 yrs
- Air quality 2/10 Low 0 unhealthy d/yr today · 1 by 30 yrs out
Nearby sold comps map
Loading sold comps map…
Walkable amenities ~0.75 mi
Loading nearby amenities…
Taxation est. · year 1
- Rental income
- $44,249
- − Mortgage interest
- −$19,045
- − Property taxes
- −$4,462
- − Insurance
- −$1,700
- − Repairs & maintenance
- −$3,540
- − Management
- −$3,540
- − HOA
- −$5,688
- − Depreciation
- −$9,891
- Taxable loss
- −$3,617
- Est. tax savings @ 24.0%
- +$868
- After-tax cash flow
- $2,579/yr
For passive investors: Depreciation is non-cash, so a rental often shows a tax loss while cash-flowing — sheltering income. Rental losses are passive: they offset passive income freely, and up to $25,000/yr can offset ordinary (W-2) income if you actively participate and your MAGI is under $100k (phasing out to $0 by $150k); unused losses carry forward. On sale, claimed depreciation is recaptured at up to 25%, and gains may owe capital-gains tax (a 1031 exchange can defer both). Figures are a year-1 estimate at your 24.0% rate — not tax advice; consult a CPA.
Condition & rehab AI · 12 photos
This home is in excellent condition with a superior view, offering both privacy and a peaceful setting. It is move-in ready with minimal maintenance required.
Value-add opportunities
- Both landscaping upgrade — enhances curb appeal and adds value
- Both painting — refreshes interior and exterior
- Both smart home integration — increases home's marketability and convenience
Renovation cost estimate screening
Value-add ROI direction
- Both landscaping upgrade — enhances curb appeal and adds value ↑
- Both painting — refreshes interior and exterior ↑
- Both smart home integration — increases home's marketability and convenience ↑
ⓘ Cost ranges are severity-bucket heuristics (US national rule-of-thumb). Get contractor quotes + a written scope before underwriting a rehab budget.
Schools (NCES district)
- District
- Collier
- NCES district ID
- 1200330
- Math proficiency
- 60% ▼ -4.00%
- Reading proficiency
- 56% ▼ -2.00%
- Median HH income
- $58,275
- Composite
- 50.23/100
- National rank
- #1892
- State rank
- #16 of 73 in FL
Livability — Ave Maria
No livability data for this city. (Only ~50 U.S. cities are tracked.)
Census & demographics
- Census place
- Ave Maria, FL
- County
- Collier County · 396,295 people
- Metro
- Naples-Marco Island, FL
- Population (ZIP)
- 35,149
- Household income
- $62,333
- Rent vs Own
- Severe rent burden
- 1093.0
Population outlook (Collier County) Hauer SSP2
- Today (2025)
- 420,858 people
- By 2030
- 450,054 · +6.9%
- By 2040
- 502,232 · +19.3%
- By 2050
- 544,932 · +29.5%
- By 2075
- 627,203 · +49.0%
- By 2100
- 659,015 · +56.6%
Race, ethnicity, and origin ACS 2023
- Neighborhood character
- Majority Hispanic (63%)
- Race & ethnicity
- Hispanic / Latino 63% Two or more races 39% Black 19% White 16% Native American 7%
- Hispanic origin (detail)
- Mexican 43% Puerto Rican 3% Cuban 2% Dominican 1%
- Common ancestry
- Hispanic 8% Slovak 1% Serbian 1%
- Foreign-born
- 32% · Canada, Jamaica
- Languages at home
- 34% English-only · Spanish 53% French/Haitian/Cajun 12%
Political lean MEDSL · Collier
- 2024 margin
- Solid R (+33.1) · D 33.1% · R 66.2%
- 2008→2024 swing
- -10.6pp toward R · 2008: -22.5pp · 2024: -33.1pp
- All cycles
- 2024: R+33.1 2020: R+24.7 2016: R+26.0 2012: R+30.1 2008: R+22.5
Not yet ingested
- Civics
- —
Market trends
- HPI YoY
- ▼ -1.05%
- Current HPI
- 226.9105
- Rent YoY
- ▲ 2.95%
- Metro
- Naples-Marco Island, FL
- State GDP YoY
- ▲ 3.28%
- F500 in state
- 36
Industry mix (Fortune 500 HQ in FL)
| Industry | F500 HQs | Revenue |
|---|---|---|
| Industrial Technology | 2 | $29B |
|
||
| Insurance | 2 | $17B |
|
||
| Retail | 1 | $60B |
|
||
| Technology Distribution | 1 | $58B |
|
||
| Homebuilding | 1 | $35B |
|
||
| Technology Manufacturing | 1 | $35B |
|
||
Price history
-17.5% since first listed15 events — show timeline
- 2026-03-25 Listed $339,990 NAPLESMLS
- 2026-03-17 Listing Removed — NAPLESMLS
- 2026-02-21 Price Changed $359,500 NAPLESMLS
- 2026-01-14 Listing Removed — NAPLESMLS
- 2026-01-14 Listed $367,900 NAPLESMLS
- 2025-11-25 Price Changed $374,500 NAPLESMLS
- 2025-10-31 Price Changed $380,000 NAPLESMLS
- 2025-08-01 Listed $384,900 NAPLESMLS
- 2025-07-30 Listing Removed — FORTMLS
- 2025-05-28 Price Changed $384,900 FORTMLS
- 2025-03-23 Price Changed $389,900 FORTMLS
- 2025-02-07 Price Changed $399,000 FORTMLS
- 2024-10-01 Listed $409,900 FORTMLS
- 2022-12-02 Listing Removed — FORTMLS
- 2022-09-03 Listed $411,900 FORTMLS
Property tax history
+31.9%/yrLatest (2025): $4,462 · +9.0% YoY. Source: county tax records.
Cash-flow waterfall
monthlySold comps — $/sqft
last 12 mo · ≤1 miLoading sold comps…