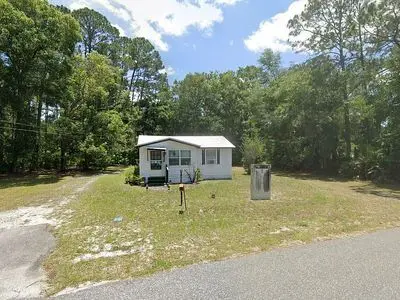
943 Butler Ave · St. Augustine, FL
Flood risk 1/10 · Minimal
- FEMA flood zone
- X (unshaded)
- Chance of flooding over 30 yrs
- 0.0%
- Est. flood insurance / yr
- $507 – $1,088
Fire risk 4/10 · Minor
- Est. fire insurance / yr
- $947 – $1,759
Heat risk 9/10 · Severe
- Hot days now (above 106°F)
- 7 days/yr
- Hot days in 30 yrs
- 20 days/yr
Wind risk 9/10 · Severe
- Chance of severe wind over 30 yrs
- 99.0%
Air-quality risk 3/10 · Minor
- Unhealthy air days now
- 3 days/yr
- Unhealthy air days in 30 yrs
- 3 days/yr
Risk factors via First Street. Map © Google.
Why this score? — see what drove the C grade
The composite is a weighted blend of 9 inputs, each scored 0–100. Each bar is that input's sub-score; the figure is the points it added to the 100-point composite (weight × sub-score).
- Cash flow +22.5/30.0
- ARV discount +7.5/15.0
- DSCR +7.2/10.0
- Schools +6.4/10.0
- 1% rule +5.4/10.0
- Rent growth +2.6/5.0
- Livability +2.5/5.0
- Condition / age +2.5/5.0
- Appreciation +0.0/10.0
$140,000
🖨 Deal sheet (PDF) 📄 Offer letter ✓ Due diligence
Listing remarks
Quaint 2 Bedroom 1 Bathroom Home for Sale. It is that of a fixer upper with a great structure. Great for a primary residence, vacation home or rental property or simply a wonderful starter home. This home is about 20 minutes from downtown St. Augustine and the beaches.
Key facts
- Built 1994
- Listed 30 days
Neighborhood map
What this means for you Summary
Snapshot
- This is a 1-bed/1.0-bath single-family listed at $140k.
Deal economics
- At list price, monthly cash flow is $236 ($3k/yr) — positive.
- The deal already cash-flows at list — no discount required.
- Meets the 1% rule at list price ($1k rent vs $140k).
- Recommended offer: $138k (1.5% below list) — sets the bar for market timing.
- Cap rate 8.3% vs local median 3.1% in St. Augustine — top-decile yield for the area; either an underpriced asset or a hidden risk that comps aren't pricing in. Stress-test before assuming the spread holds.
Location & tenants
- Location reads: area grade C — affects rentability + tenant quality, not the cash-flow math above.
- St. Johns (rural): math 75% / reading 73% proficiency, ranked #2 of 73 in FL (top 3%) — strong family-tenant draw, lease renewals of 3-5y typical; only 20% free/reduced lunch — higher-income household profile.
- Market conditions: Rents flat; 635 active listings in the ZIP; 4 comparable units currently listed for rent nearby; rentals at typical pace (median 18d on market — plan ~3-4 weeks tenant-placement turnaround); 5,575 units permitted in St. Johns County in 2024 (584 in 5+ unit buildings).
Forward outlook
- Local home prices are declining (-3.0%/yr); year-one equity from $968 of loan paydown is wiped out by about $4k of value loss. Plan a longer hold.
- St. Johns County population projected at +60% by 2050 — long-run rental-demand tailwind backs the buy-and-hold thesis.
Negotiation context
- It's been on market 30 days — a 2% lower offer ($138k) is reasonable based on typical stale-listing flexibility.
Risks & watch-outs
- Climate carrying-cost: severe wind risk, 99% chance of damaging wind over 30y; extreme-heat days projected 7→20/yr by 2055 (HVAC capex compounding) — expect insurance premiums to compound above CPI over the hold.
Questions for the listing agent
- Is there a deadline driving the sale (1031 exchange, divorce, estate, relocation)? That informs how much negotiation room exists.
- What's the average days-on-market for RENTAL listings here right now (not sales)? A rising rental-DOM trend means longer vacancies and softer asking-rent achievability than the comps imply.
- What's the recent tenant-quality profile in this submarket — average credit score on applications, eviction rate, late-payment / NSF rate, and stable-employment percentage? A property-management company in the area should have these aggregated.
- How much new for-sale + rental construction is in the pipeline within 1–3 miles? Heavy new supply typically softens prices + rents 12–24 months out; constrained supply supports both.
Investment metrics
- 1% rule
- 1.04% ✓
- Cap rate
- 8.32%
- Cash-on-cash
- 7.23%
- DSCR
- 1.32
- GRM
- 8.0
CMA / ARV
- ARV (on-the-fly)
- $56,939
- Comps found
- 1
Show comp detail 1 sale within ~0.75 mi
| Address | Dist | Beds/Ba | Sqft | Sold | Price | $/sf | Match |
|---|---|---|---|---|---|---|---|
| 410 S Holmes | 0.63mi | 2/1.0 (+1) | 672 (+14%) | 22mo | $65,000 | $97 | 23 |
Match score weights: distance 35% · size 25% · config 20% · recency 20%. Top-matched comps best support the ARV.
Projected returns pro-forma
-3.0% appreciation · 0.25% rent growth · sell at horizon
- IRR
- -8.3%
- Equity multiple
- 0.70×
- Total profit
- $-11,593
- Equity at exit
- $20,874
- IRR
- -2.6%
- Equity multiple
- 0.85×
- Total profit
- $-6,040
- Equity at exit
- $12,105
Cash invested: $39,200 (down + closing). Projections, not guarantees.
Landlord ↔ Tenant lean methodology
- Overall (STATE)
- 87 Strongly Landlord-Friendly
- State Florida
- 87 Strongly Landlord-Friendly · R+3
- County
- — inherits STATE
- City
- — inherits STATE
ZIP-level market 32084
- Rents YoY
- 0.2%
- Active inventory
- 635
- Price-to-rent
- 8.0×
Monthly cashflow live
- Estimated rent
- $1,460 medium interval (Pro) →
- Mortgage (P&I)
- −$734
- Tax from tax record
- −$125 /mo · $1,494/yr
- Insurance
- −$58
- HOA
- −$0
- Vacancy / Maint / Mgmt
- −$307
- Net cashflow
- $236
Break-even live
Sensitivity live
| Price | -10% $315 | -5% $276 | +0% $236 | +5% $196 | +10% $157 |
|---|---|---|---|---|---|
| Rent | -10% $121 | -5% $178 | +0% $236 | +5% $294 | +10% $351 |
| Rate | -1.0pp $307 | -0.5pp $272 | base $236 | +0.5pp $200 | +1.0pp $163 |
UW: 25.0% down · 7.5% · 30yr · 1.5% tax · 5.0% vac · 8.0% maint · 8.0% mgmt
Financing live
Cash to close
- Down payment
- $35,000
- Closing costs
- $4,200
- Reserves months
- —
- Total cash needed
- —
Loan-product check · same deal, 3 products live
Conventional
25% down · 7.5% · 30yr
- Down + closing
- —
- Monthly P&I
- —
- Monthly cashflow
- —
- DSCR
- —
- Eligible?
- —
Personal DTI + credit; lowest rate.
DSCR
20% down · 8.5% · 30yr
- Down + closing
- —
- Monthly P&I
- —
- Monthly cashflow
- —
- DSCR
- —
- Eligible?
- —
No personal income docs; deal must DSCR.
Hard money
10% down · 12.0% · 12mo
- Down + closing
- —
- Monthly P&I
- —
- Monthly cashflow
- —
- DSCR
- —
- Eligible?
- —
Short-term bridge; refi at stabilization.
Rent comps 4 comps
| Address | Beds | Baths | Sqft | Rent | $/sqft | DOM | Units | Dist |
|---|---|---|---|---|---|---|---|---|
| 736 W King St Unit A St. Augustine, FL | 2.0 | 1.0 | 688 | $1,750 | $2.54 | 18d | 1 | 0.49mi |
| 736 W King St Unit B St. Augustine, FL | 1.0 | 1.0 | 450 | $1,200 | $2.67 | 18d | 1 | 0.49mi |
| 509 Live Oak St Unit 1 St. Augustine, FL | 1.0 | 1.0 | 432 | $1,500 | $3.47 | 24d | 1 | 0.86mi |
| 25 Florida Ave Unit A St. Augustine, FL | 2.0 | 1.0 | 500 | $1,200 | $2.40 | 15d | 1 | 1.27mi |
Listing history 15 events
-
2026-06-21days on market $140,000 Active 30 DOM
-
2026-06-18days on market $140,000 Active 27 DOM
-
2026-06-17days on market $140,000 Active 26 DOM
-
2026-06-16days on market $140,000 Active 25 DOM
-
2026-06-15days on market $140,000 Active 24 DOM
-
2026-06-13days on market $140,000 Active 22 DOM
-
2026-06-13days on market $140,000 Active 21 DOM
-
2026-06-10days on market $140,000 Active 18 DOM
-
2026-06-08days on market $140,000 Active 17 DOM
-
2026-06-07days on market $140,000 Active 16 DOM
-
2026-06-03days on market $140,000 Active 9 DOM
-
2026-06-02days on market $140,000 Active 8 DOM
-
2026-06-01days on market $140,000 Active 7 DOM
-
2026-05-31days on market $140,000 Active 6 DOM
-
2026-05-22$140,000 Active
ⓘ Source: listings_history table (triggers on properties + properties_extension) + one-shot
backfill from property_details.listing_events for pre-trigger history.
Tax reassessment forecast FL · Resets to sale price
- Current annual tax
- $1,494 · $125/mo
- Projected year-2 tax
- $1,494 · $125/mo
- Expected delta
- $0/yr ($0/mo · 0.0%)
ⓘ Screening estimate from a state-policy table — verify with the county assessor before closing.
Climate risk First Street
- Flood 1/10 Low FEMA zone X (unshaded) · 0% chance over 30 yrs
- Wildfire 4/10 Moderate
- Heat 9/10 Extreme 7 d/yr ≥106°F today · 20 d/yr by 30 yrs out
- Wind 9/10 Extreme 99% chance of damaging wind over 30 yrs
- Air quality 3/10 Moderate 3 unhealthy d/yr today · 3 by 30 yrs out
Nearby sold comps map
Loading sold comps map…
Walkable amenities ~0.75 mi
Loading nearby amenities…
Taxation est. · year 1
- Rental income
- $17,515
- − Mortgage interest
- −$7,842
- − Property taxes
- −$1,494
- − Insurance
- −$700
- − Repairs & maintenance
- −$1,401
- − Management
- −$1,401
- − Depreciation
- −$4,073
- Taxable income
- $603
- Est. tax owed @ 24.0%
- −$145
- After-tax cash flow
- $2,688/yr
For passive investors: Depreciation is non-cash, so a rental often shows a tax loss while cash-flowing — sheltering income. Rental losses are passive: they offset passive income freely, and up to $25,000/yr can offset ordinary (W-2) income if you actively participate and your MAGI is under $100k (phasing out to $0 by $150k); unused losses carry forward. On sale, claimed depreciation is recaptured at up to 25%, and gains may owe capital-gains tax (a 1031 exchange can defer both). Figures are a year-1 estimate at your 24.0% rate — not tax advice; consult a CPA.
Schools (NCES district)
- District
- St. Johns
- NCES district ID
- 1201740
- Math proficiency
- 75% ▼ -5.00%
- Reading proficiency
- 73% ▼ -2.00%
- Median HH income
- $66,842
- Composite
- 64.31/100
- National rank
- #556
- State rank
- #2 of 73 in FL
Livability — St. Augustine
No livability data for this city. (Only ~50 U.S. cities are tracked.)
Census & demographics
- County
- Saint Johns County · 301,599 people
- Metro
- Jacksonville, FL
- Population (ZIP)
- 37,291
- Household income
- $73,837
- Rent vs Own
- Severe rent burden
- 1748.0
Population outlook (St. Johns County) Hauer SSP2
- Today (2025)
- 303,941 people
- By 2030
- 342,590 · +12.7%
- By 2040
- 417,328 · +37.3%
- By 2050
- 487,011 · +60.2%
- By 2075
- 635,395 · +109.1%
- By 2100
- 717,469 · +136.1%
Race, ethnicity, and origin ACS 2023
- Neighborhood character
- Predominantly White (73%)
- Race & ethnicity
- White 73% Hispanic / Latino 12% Black 11% Two or more races 8%
- Hispanic origin (detail)
- Mexican 2% Puerto Rican 4% Cuban 1%
- Common ancestry
- Lithuanian 3% Romanian 2% Slovak 2%
- Foreign-born
- 6% · Canada, Jamaica
- Languages at home
- 91% English-only · Spanish 6% Other Indo-European 1%
Political lean MEDSL · St. Johns
- 2024 margin
- Solid R (+31.4) · D 33.9% · R 65.2%
- 2008→2024 swing
- +0.2pp no change · 2008: -31.6pp · 2024: -31.4pp
- All cycles
- 2024: R+31.4 2020: R+26.7 2016: R+33.4 2012: R+37.8 2008: R+31.6
Not yet ingested
- Civics
- —
Market trends
- HPI YoY
- ▼ -287.02%
- Current HPI
- 330.9505
- Rent YoY
- ▲ 0.25%
- Metro
- Jacksonville, FL
- State GDP YoY
- ▲ 3.28%
- F500 in state
- 36
Industry mix (Fortune 500 HQ in FL)
| Industry | F500 HQs | Revenue |
|---|---|---|
| Industrial Technology | 2 | $29B |
|
||
| Insurance | 2 | $17B |
|
||
| Retail | 1 | $60B |
|
||
| Technology Distribution | 1 | $58B |
|
||
| Homebuilding | 1 | $35B |
|
||
| Technology Manufacturing | 1 | $35B |
|
||
Price history
1 event — show timeline
- 2026-05-22 Listed $140,000 FSBO.com
Property tax history
+18.9%/yrLatest (2025): $1,494 · +9.6% YoY. Source: county tax records.
Cash-flow waterfall
monthlySold comps — $/sqft
last 12 mo · ≤1 miLoading sold comps…