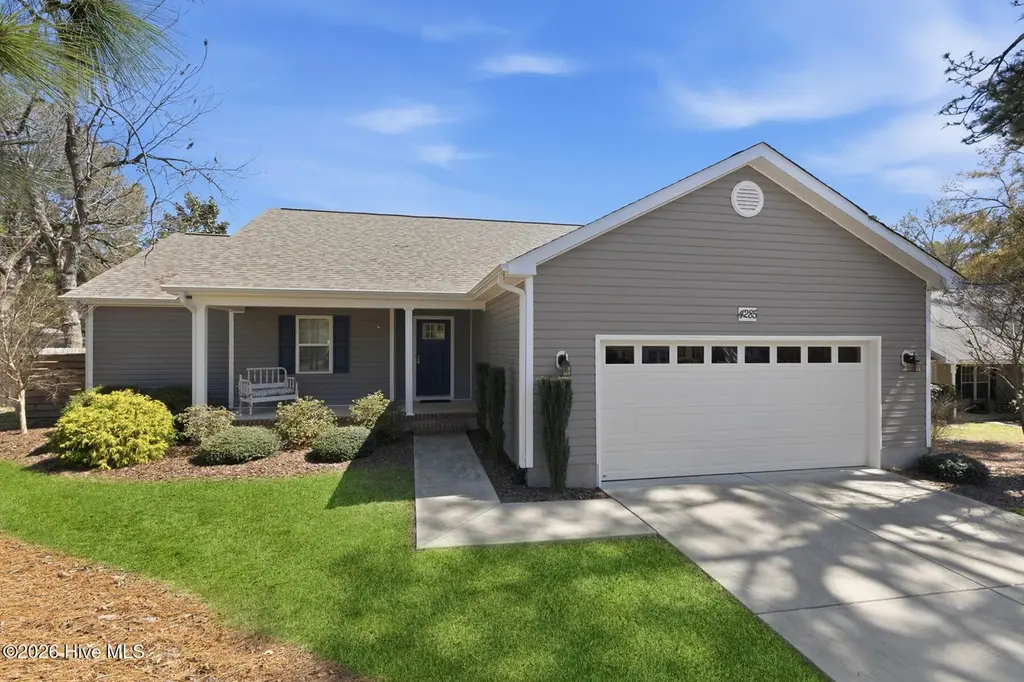
4285 Murdocksville Rd · Pinehurst, NC
Flood risk 1/10 · Minimal
- FEMA flood zone
- X (unshaded)
- Chance of flooding over 30 yrs
- 0.0%
- Est. flood insurance / yr
- $507 – $1,088
Fire risk 4/10 · Minor
- Est. fire insurance / yr
- $906 – $1,684
Heat risk 7/10 · Major
- Hot days now (above 105°F)
- 7 days/yr
- Hot days in 30 yrs
- 17 days/yr
Wind risk 6/10 · Moderate
- Chance of severe wind over 30 yrs
- 54.0%
Air-quality risk 1/10 · Minimal
- Unhealthy air days now
- 0 days/yr
- Unhealthy air days in 30 yrs
- 0 days/yr
Risk factors via First Street. Map © Google.
Why this score? — see what drove the D grade
The composite is a weighted blend of 9 inputs, each scored 0–100. Each bar is that input's sub-score; the figure is the points it added to the 100-point composite (weight × sub-score).
- Cash flow +11.9/30.0
- ARV discount +9.7/15.0
- Schools +4.4/10.0
- Livability +3.7/5.0
- DSCR +3.5/10.0
- Rent growth +2.5/5.0
- Condition / age +2.5/5.0
- 1% rule +2.4/10.0
- Appreciation +0.0/10.0
$399,000
🖨 Deal sheet (PDF) 📄 Offer letter ✓ Due diligence
Listing remarks
Charming ranch-style home featuring an open-concept layout and desirable split-bedroom floor plan. The main living areas boast durable LVP flooring, while the bedrooms offer cozy carpeting for added comfort. The primary bedroom includes a private en-suite bath with a dual-sink vanity, walk-in shower, and a generous walk-in closet. Two additional bedrooms and a full bath provide plenty of space for family or guests. Conveniently located near shopping, dining, and world-class golf, this home offers both comfort and accessibility in a sought-after setting.
Key facts
- Dual-sink vanity
- Walk-in shower
- Durable lvp flooring
Tags
Property features AI
Exterior
- Parking: 2 total parking spaces; Attached 2-car garage; Garage faces front; Concrete driveway; Garage door opener
- Utilities: Public water; Sewer connected; Water connected; Electric service
- Home design: Single-family residence; One story
- Construction: Vinyl siding and frame construction; Composition roof
- Exterior features: Covered patio/porch areas; Deck; Front porch; Wood fencing; Has view; Paved road frontage on city street and state road
Interior
- Kitchen: Refrigerator; Dishwasher; Electric range; Microwave
- Flooring: Carpet; Tile
- Bathrooms: 2 full bathrooms
- Heating & cooling: Heat pump heating; Electric heating; Central air conditioning
- Interior features: Walk-in closet(s); Ceiling fan(s); Accessible full bathroom; Crawl space
- Laundry & utility: Washer hookup; Laundry room; Electric water heater
Neighborhood map
What this means for you Summary
Snapshot
- This is a 4-bed/2.0-bath single-family listed at $399k.
Deal economics
- At list price, monthly cash flow is $-100 ($-1k/yr) — negative.
- To cash-flow at today's rent, offer at most $381k (4.4% below list).
- To meet the 1% rule (rent ≥ 1% of price), the offer needs to be $295k (26.1% below list).
- Recommended offer: $295k (26.1% below list) — sets the bar for 1% rule.
- Cap rate 6.0% vs local median 2.2% in Pinehurst — top-decile yield for the area; either an underpriced asset or a hidden risk that comps aren't pricing in. Stress-test before assuming the spread holds.
Location & tenants
- Location reads 74/100 on livability (#60 in NC, #4,746 nationally) — a middle-class / working-renter tenant base. Strengths: crime A+, employment A+, housing A+; Watch: cost of living C-, health & safety C-, amenities F.
- Moore County Schools (rural): math 48% / reading 54% proficiency, ranked #58 of 178 in NC (top 33%) — acceptable for families but not a draw, mixed tenant base, ~2y average lease.
- Zoned schools: West Pine Elementary (math 51% / reading 58%, grade C, #302 of 1,410 statewide, top 23%, 395 students, 44% FRL); West Pine Middle (math 62% / reading 62%, grade B+, #37 of 475 statewide, top 8%, 688 students, 28% FRL); Pinecrest High (math 66% / reading 72%, grade B, #131 of 535 statewide, top 25%, 2,221 students, 34% FRL).
- Market conditions: 181 active listings in the ZIP; 1 comparable units currently listed for rent nearby; 941 units permitted in Moore County in 2024 (0 in 5+ unit buildings).
Forward outlook
- Local home prices are declining (-3.0%/yr); year-one equity from $3k of loan paydown is wiped out by about $12k of value loss. Plan a longer hold.
- Moore County population projected at +29% by 2050 — long-run rental-demand tailwind backs the buy-and-hold thesis.
Negotiation context
- It's been on market 87 days — a 6% lower offer ($375k) is reasonable based on typical stale-listing flexibility.
Risks & watch-outs
- Climate carrying-cost: major wind risk, 54% chance of damaging wind over 30y; extreme-heat days projected 7→17/yr by 2055 (HVAC capex compounding) — expect insurance premiums to compound above CPI over the hold.
Questions for the listing agent
- What do current leases actually rent for vs. the listed asking? Can we see a recent rent roll and the last 12 months of T-12 income?
- It's been on market 87 days. Have you received any prior offers? Is the seller open to a 26% concession, seller financing, or rate buy-down credit?
- Why hasn't it sold? Are there any deal-killer items the seller is aware of (foundation, flood, title, zoning, code violations)?
- Is there a deadline driving the sale (1031 exchange, divorce, estate, relocation)? That informs how much negotiation room exists.
- Schools are A-rated — typically a magnet for longer-tenancy family renters. What's the average tenant stay here, and is there a school-zone premium baked into asking?
- The area grade is low — what's the realistic commute time and amenity access for the typical tenant pool here? Any planned neighborhood developments (good or bad) we should know about?
- What's the average days-on-market for RENTAL listings here right now (not sales)? A rising rental-DOM trend means longer vacancies and softer asking-rent achievability than the comps imply.
- What's the recent tenant-quality profile in this submarket — average credit score on applications, eviction rate, late-payment / NSF rate, and stable-employment percentage? A property-management company in the area should have these aggregated.
- How much new for-sale + rental construction is in the pipeline within 1–3 miles? Heavy new supply typically softens prices + rents 12–24 months out; constrained supply supports both.
Investment metrics
- 1% rule
- 0.74% ✗
- Cap rate
- 5.99%
- Cash-on-cash
- -1.08%
- DSCR
- 0.95
- GRM
- 11.3
CMA / ARV
- ARV (on-the-fly)
- $419,400
- Comps found
- 11
Show comp detail 11 sales within ~0.75 mi
| Address | Dist | Beds/Ba | Sqft | Sold | Price | $/sf | Match |
|---|---|---|---|---|---|---|---|
| 2255 Longleaf Dr W | 0.27mi | 3/2.0 (-1) | 1,688 (-6%) | 5mo | $380,000 | $225 | 68 |
| 2440 Longleaf Dr W | 0.06mi | 3/2.0 (-1) | 1,628 (-10%) | 23mo | $380,000 | $233 | 57 |
| 5 Gun Club Dr | 0.64mi | 3/2.0 (-1) | 1,705 (-5%) | 13mo | $394,999 | $232 | 45 |
| 280 Wheeling Dr | 0.74mi | 4/2.5 | 1,818 (+1%) | 21mo | $429,500 | $236 | 44 |
| 2655 Longleaf Dr SW | 0.37mi | 3/2.0 (-1) | 1,610 (-11%) | 22mo | $375,000 | $233 | 42 |
| 285 Gun Club Dr | 0.68mi | 3/2.0 (-1) | 1,590 (-12%) | 3mo | $350,000 | $220 | 42 |
| 15 Garner Ln | 0.69mi | 3/2.0 (-1) | 1,640 (-9%) | 12mo | $409,000 | $249 | 38 |
| 1875 Longleaf Dr E | 0.70mi | 3/2.5 (-1) | 1,834 (+2%) | 24mo | $414,000 | $226 | 37 |
| 75 Winchester Rd | 0.53mi | 3/2.0 (-1) | 1,600 (-11%) | 19mo | $355,000 | $222 | 36 |
| 2 Sly Ct | 0.71mi | 3/2.0 (-1) | 1,659 (-8%) | 21mo | $415,000 | $250 | 31 |
| 395 Gun Club Dr | 0.70mi | 3/2.0 (-1) | 1,540 (-14%) | 16mo | $395,000 | $256 | 25 |
Match score weights: distance 35% · size 25% · config 20% · recency 20%. Top-matched comps best support the ARV.
Projected returns pro-forma
-3.0% appreciation · 3.0% rent growth · sell at horizon
- IRR
- -18.1%
- Equity multiple
- 0.36×
- Total profit
- $-71,211
- Equity at exit
- $59,492
- IRR
- -10.5%
- Equity multiple
- 0.37×
- Total profit
- $-70,885
- Equity at exit
- $34,498
Cash invested: $111,720 (down + closing). Projections, not guarantees.
Landlord ↔ Tenant lean methodology
- Overall (STATE)
- 85 Strongly Landlord-Friendly
- State North Carolina
- 85 Strongly Landlord-Friendly · R+3
- County
- — inherits STATE
- City
- — inherits STATE
ZIP-level market 27376
- Home prices YoY
- -30.2%
- Active inventory
- 181
- Price-to-rent
- 11.3×
Monthly cashflow live
- Estimated rent
- $2,950 medium interval (Pro) →
- Mortgage (P&I)
- −$2,092
- Tax from tax record
- −$172 /mo · $2,068/yr
- Insurance
- −$166
- HOA
- −$0
- Vacancy / Maint / Mgmt
- −$620
- Net cashflow
- $-100
Break-even live
Sensitivity live
| Price | -10% $125 | -5% $12 | +0% $-100 | +5% $-213 | +10% $-326 |
|---|---|---|---|---|---|
| Rent | -10% $-334 | -5% $-217 | +0% $-100 | +5% $16 | +10% $133 |
| Rate | -1.0pp $100 | -0.5pp $1 | base $-100 | +0.5pp $-204 | +1.0pp $-309 |
UW: 25.0% down · 7.5% · 30yr · 1.5% tax · 5.0% vac · 8.0% maint · 8.0% mgmt
Financing live
Cash to close
- Down payment
- $99,750
- Closing costs
- $11,970
- Reserves months
- —
- Total cash needed
- —
Loan-product check · same deal, 3 products live
Conventional
25% down · 7.5% · 30yr
- Down + closing
- —
- Monthly P&I
- —
- Monthly cashflow
- —
- DSCR
- —
- Eligible?
- —
Personal DTI + credit; lowest rate.
DSCR
20% down · 8.5% · 30yr
- Down + closing
- —
- Monthly P&I
- —
- Monthly cashflow
- —
- DSCR
- —
- Eligible?
- —
No personal income docs; deal must DSCR.
Hard money
10% down · 12.0% · 12mo
- Down + closing
- —
- Monthly P&I
- —
- Monthly cashflow
- —
- DSCR
- —
- Eligible?
- —
Short-term bridge; refi at stabilization.
Rent comps 1 comps
| Address | Beds | Baths | Sqft | Rent | $/sqft | DOM | Units | Dist |
|---|---|---|---|---|---|---|---|---|
| 205 McCaskill Rd E Pinehurst, NC | 1.0–3.0 | 1.0–2.0 | 1089 | $2,950 | $2.71 | 25d | 1 | 0.63mi |
Listing history 18 events
-
2026-06-22days on market $399,000 Active 87 DOM
-
2026-06-19days on market $399,000 Active 85 DOM
-
2026-06-18days on market $399,000 Active 84 DOM
-
2026-06-17days on market $399,000 Active 83 DOM
-
2026-06-16days on market $399,000 Active 82 DOM
-
2026-06-15days on market $399,000 Active 81 DOM
-
2026-06-14days on market $399,000 Active 79 DOM
-
2026-06-13pricedays on market $399,000 Active 78 DOM
-
2026-06-10days on market $410,000 Active 76 DOM
-
2026-06-09days on market $410,000 Active 75 DOM
-
2026-06-08days on market $410,000 Active 74 DOM
-
2026-06-07days on market $410,000 Active 73 DOM
-
2026-06-05days on market $410,000 Active 70 DOM
-
2026-06-02days on market $410,000 Active 68 DOM
-
2026-06-01days on market $410,000 Active 67 DOM
-
2026-05-31days on market $410,000 Active 66 DOM
-
2026-05-30days on market $410,000 Active 65 DOM
-
2026-03-24$410,000 Active
ⓘ Source: listings_history table (triggers on properties + properties_extension) + one-shot
backfill from property_details.listing_events for pre-trigger history.
Tax reassessment forecast NC · Resets to sale price
- Current annual tax
- $2,068 · $172/mo
- Projected year-2 tax
- $3,272 · $273/mo
- Expected delta
- +$1,204/yr (+$100/mo · 58.2%)
ⓘ Screening estimate from a state-policy table — verify with the county assessor before closing.
Climate risk First Street
- Flood 1/10 Low FEMA zone X (unshaded) · 0% chance over 30 yrs
- Wildfire 4/10 Moderate
- Heat 7/10 Severe 7 d/yr ≥105°F today · 17 d/yr by 30 yrs out
- Wind 6/10 Major 54% chance of damaging wind over 30 yrs
- Air quality 1/10 Low 0 unhealthy d/yr today · 0 by 30 yrs out
Nearby sold comps map
Loading sold comps map…
Walkable amenities ~0.75 mi
Loading nearby amenities…
Taxation est. · year 1
- Rental income
- $35,400
- − Mortgage interest
- −$22,350
- − Property taxes
- −$2,068
- − Insurance
- −$1,995
- − Repairs & maintenance
- −$2,832
- − Management
- −$2,832
- − Depreciation
- −$11,607
- Taxable loss
- −$8,285
- Est. tax savings @ 24.0%
- +$1,988
- After-tax cash flow
- $782/yr
For passive investors: Depreciation is non-cash, so a rental often shows a tax loss while cash-flowing — sheltering income. Rental losses are passive: they offset passive income freely, and up to $25,000/yr can offset ordinary (W-2) income if you actively participate and your MAGI is under $100k (phasing out to $0 by $150k); unused losses carry forward. On sale, claimed depreciation is recaptured at up to 25%, and gains may owe capital-gains tax (a 1031 exchange can defer both). Figures are a year-1 estimate at your 24.0% rate — not tax advice; consult a CPA.
Schools (NCES district)
- District
- Moore County Schools
- NCES district ID
- 3703090
- Math proficiency
- 48% ▲ 5.00%
- Reading proficiency
- 54% ▲ 5.00%
- Median HH income
- $50,333
- Composite
- 43.63/100
- National rank
- #2967
- State rank
- #58 of 178 in NC
Livability — Pinehurst
- Score
- 74/100
- State rank
- #60
- US rank
- #4746
Category grades
Schools grade is shown separately in the Schools card above.
Census & demographics
- Census place
- Pinehurst, NC
- City population
- 19,782
- Population (ZIP)
- 9,693
Population outlook (Moore County) Hauer SSP2
- Today (2025)
- 106,902 people
- By 2030
- 113,134 · +5.8%
- By 2040
- 125,682 · +17.6%
- By 2050
- 137,811 · +28.9%
- By 2075
- 164,387 · +53.8%
- By 2100
- 175,595 · +64.3%
Race, ethnicity, and origin ACS 2023
- Neighborhood character
- Predominantly White (75%)
- Race & ethnicity
- White 75% Black 13% Two or more races 9% Hispanic / Latino 2%
- Common ancestry
- Slovak 5% Lithuanian 4% Serbian 2%
- Foreign-born
- 1% · Canada
- Languages at home
- 97% English-only · Spanish 2% Chinese 1%
Political lean MEDSL · Moore
- 2024 margin
- Strong R (+29.5) · D 34.8% · R 64.3%
- 2008→2024 swing
- -8.1pp toward R · 2008: -21.4pp · 2024: -29.5pp
- All cycles
- 2024: R+29.5 2020: R+27.4 2016: R+29.6 2012: R+28.1 2008: R+21.4
Not yet ingested
- Civics
- —
Market trends
- HPI YoY
- ▼ -76.65%
- Current HPI
- 177.4703
- Rent YoY
- —
- Metro
- —
- State GDP YoY
- ▲ 3.28%
- F500 in state
- 26
Industry mix (Fortune 500 HQ in NC)
| Industry | F500 HQs | Revenue |
|---|---|---|
| Financial Services | 2 | $213B |
|
||
| Retail | 2 | $95B |
|
||
| Industrial Conglomerate | 1 | $38B |
|
||
| Metals / Steel | 1 | $35B |
|
||
| Utilities | 1 | $30B |
|
||
| Industrial Machinery | 1 | $19B |
|
||
Price history
1 event — show timeline
- 2026-03-24 Listed $410,000 Hive MLS
Property tax history
+30.8%/yrLatest (2024): $2,068 · -4.2% YoY. Source: county tax records.
Cash-flow waterfall
monthlySold comps — $/sqft
last 12 mo · ≤1 miLoading sold comps…