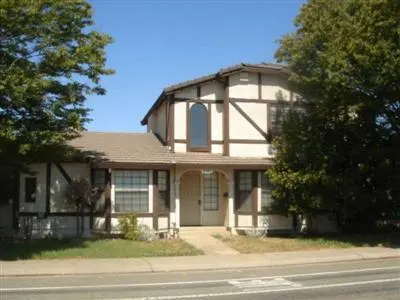
8797 Valley Oak Ln · Elk Grove, CA
Flood risk 1/10 · Minimal
- FEMA flood zone
- X (unshaded)
- Chance of flooding over 30 yrs
- 0.0%
- Est. flood insurance / yr
- $507 – $1,088
Fire risk 5/10 · Moderate
- Est. fire insurance / yr
- $659 – $1,223
Heat risk 7/10 · Major
- Hot days now (above 102°F)
- 7 days/yr
- Hot days in 30 yrs
- 15 days/yr
Wind risk 1/10 · Minimal
- Chance of severe wind over 30 yrs
- —
Air-quality risk 10/10 · Severe
- Unhealthy air days now
- 25 days/yr
- Unhealthy air days in 30 yrs
- 27 days/yr
Risk factors via First Street. Map © Google.
Why this score? — see what drove the D grade
The composite is a weighted blend of 9 inputs, each scored 0–100. Each bar is that input's sub-score; the figure is the points it added to the 100-point composite (weight × sub-score).
- ARV discount +15.0/15.0
- Cash flow +9.4/30.0
- Schools +4.1/10.0
- Livability +3.6/5.0
- DSCR +2.6/10.0
- Rent growth +2.5/5.0
- Condition / age +2.5/5.0
- 1% rule +1.8/10.0
- Appreciation +0.0/10.0
$489,900
🖨 Deal sheet (PDF) 📄 Offer letter ✓ Due diligence
Listing remarks
Highly motivated sellers relocating out of state, offering an excellent opportunity for a smooth and timely transaction. Located in the heart of Elk Grove's original 95624 zip code, this unique two-story half-plex lives and feels like a detached home, with the attached portion thoughtfully designed between the garages and no shared living-area walls. The home features three bedroom suites, each with its own full bathroom, including a rare downstairs suite ideal for guests, extended family, or multi-generational living. Fresh interior paint throughout and new carpet on the entire second floor, installed in February 2026, add to the home's appeal. Upstairs offers two private bedroom suites, i
Key facts
- Private office suite
- Corner-lot halfplex
- Walk-in shower
Tags
Property features AI
Finance
- HOA & community: No homeowners association
Exterior
- Parking: 2-car garage; Garage with opener and side-facing garage
- Utilities: Public water; Public sewer; Public district irrigation; Natural gas connected; Cable available and connected; 220 volts in laundry
- Home design: Attached halfplex (residential); 2-story home; Built in 1984
- Construction: Shingle/composition roof; Attached construction
- Exterior features: Back yard fencing; Corner lot with regular shape; Landscaped front and back with automatic sprinklers
Interior
- Kitchen: Built-in electric oven; Electric cooktop; Hood over range; Microwave; Dishwasher; Ice maker; Breakfast area; Tile countertops; Dining bar / breakfast nook / dining-family combo
- Bedrooms: 3 bedrooms; Main level includes bedroom(s)
- Flooring: Carpet; Laminate; Tile; Wood
- Bathrooms: 3 full bathrooms; Master bath with shower stall(s), double sinks, skylight/solar tube, tile, and multiple shower heads; Other baths feature granite, tile, and tub with shower over
- Heating & cooling: Central heating; Central air conditioning; Ceiling fans
- Interior features: Great room with open beam ceiling; Family room with wood-burning fireplace; Fireplace in family room; Awning-covered back porch
- Laundry & utility: Laundry room inside the home; Laundry has cabinets, gas hook-up, hookups only; 220-volt outlet in laundry
Neighborhood map
What this means for you Summary
Snapshot
- This is a 3-bed/3.0-bath single-family listed at $490k.
Deal economics
- At list price, monthly cash flow is $-352 ($-4k/yr) — negative.
- To cash-flow at today's rent, offer at most $428k (12.7% below list).
- To meet the 1% rule (rent ≥ 1% of price), the offer needs to be $333k (32.0% below list).
- Recommended offer: $333k (32.0% below list) — sets the bar for 1% rule.
- Cap rate 5.4% vs local median 2.8% in Elk Grove — top-decile yield for the area; either an underpriced asset or a hidden risk that comps aren't pricing in. Stress-test before assuming the spread holds.
Location & tenants
- Location reads 71/100 on livability (#212 in CA) — a middle-class / working-renter tenant base. Strengths: employment A+, housing A+, crime B+; Watch: commute F, cost of living F.
- Elk Grove Unified (suburban): math 40% / reading 51% proficiency, ranked #165 of 517 in CA (top 32%) — families likely to look elsewhere, expect single-tenant / working-renter base with shorter leases.
- Zoned schools: Florence Markofer Elementary (math 35% / reading 36%, grade F, #709 of 1,571 statewide, top 45%, 625 students, 40% FRL); Joseph Kerr Middle (math 38% / reading 51%, grade D, #130 of 498 statewide, top 27%, 791 students, 40% FRL); Elk Grove High (math 43% / reading 58%, grade D+, #324 of 1,170 statewide, top 28%, 1,774 students, 31% FRL).
- Market conditions: Rents flat; 243 active listings in the ZIP; 8 comparable units currently listed for rent nearby; rentals at typical pace (median 26d on market — plan ~3-4 weeks tenant-placement turnaround); high-income renter base; 6,825 units permitted in Sacramento County in 2024 (1,752 in 5+ unit buildings).
- This rent runs 32% of the median local income ($125k/yr) — at the standard rent-burdened threshold; future hikes will face affordability resistance.
Forward outlook
- Local home prices are declining (-3.0%/yr); year-one equity from $3k of loan paydown is wiped out by about $15k of value loss. Plan a longer hold.
- Sacramento County population projected at +17% by 2050 — long-run rental-demand tailwind backs the buy-and-hold thesis.
Negotiation context
- It's been on market 32 days — a 3% lower offer ($475k) is reasonable based on typical stale-listing flexibility.
- Current owner paid $371k; 32% above their basis — modest negotiation headroom, anchor on the comps not their cost.
Risks & watch-outs
- Climate carrying-cost: moderate wildfire risk; extreme-heat days projected 7→15/yr by 2055 (HVAC capex compounding) — expect insurance premiums to compound above CPI over the hold.
Questions for the listing agent
- What do current leases actually rent for vs. the listed asking? Can we see a recent rent roll and the last 12 months of T-12 income?
- It's been on market 32 days. Have you received any prior offers? Is the seller open to a 32% concession, seller financing, or rate buy-down credit?
- Is there a deadline driving the sale (1031 exchange, divorce, estate, relocation)? That informs how much negotiation room exists.
- Schools are B-rated — typically a magnet for longer-tenancy family renters. What's the average tenant stay here, and is there a school-zone premium baked into asking?
- The area grade is low — what's the realistic commute time and amenity access for the typical tenant pool here? Any planned neighborhood developments (good or bad) we should know about?
- What's the average days-on-market for RENTAL listings here right now (not sales)? A rising rental-DOM trend means longer vacancies and softer asking-rent achievability than the comps imply.
- What's the recent tenant-quality profile in this submarket — average credit score on applications, eviction rate, late-payment / NSF rate, and stable-employment percentage? A property-management company in the area should have these aggregated.
- How much new for-sale + rental construction is in the pipeline within 1–3 miles? Heavy new supply typically softens prices + rents 12–24 months out; constrained supply supports both.
Investment metrics
- 1% rule
- 0.68% ✗
- Cap rate
- 5.43%
- Cash-on-cash
- -3.08%
- DSCR
- 0.86
- GRM
- 12.3
CMA / ARV
- ARV (median comp)
- $590,601
- List price
- $489,900
- Delta
- -17.05%
- Verdict
- UNDERPRICED
- Comps
- 20 within 1.0 mi
Show comp detail 12 sales within ~0.75 mi
| Address | Dist | Beds/Ba | Sqft | Sold | Price | $/sf | Match |
|---|---|---|---|---|---|---|---|
| 9813 Vista Grande Way | 0.07mi | 4/2.5 (+1) | 1,900 (+4%) | 2mo | $660,000 | $347 | 82 |
| 8763 Rubystone Ct | 0.25mi | 4/2.5 (+1) | 1,896 (+3%) | 1mo | $590,000 | $311 | 75 |
| 8949 Plaza Park Dr | 0.43mi | 3/3.0 | 1,742 (-5%) | 0mo | $415,000 | $238 | 71 |
| 9012 Plaza Park Dr | 0.55mi | 4/2.5 (+1) | 1,847 (+1%) | 4mo | $639,000 | $346 | 63 |
| 9723 Parktree Way | 0.29mi | 3/2.0 | 1,629 (-11%) | 2mo | $500,000 | $307 | 62 |
| 9835 Hans Way | 0.63mi | 4/2.0 (+1) | 1,782 (-3%) | 3mo | $655,000 | $368 | 54 |
| 8724 Oconnell Ct | 0.30mi | 4/2.5 (+1) | 2,108 (+15%) | 2mo | $655,200 | $311 | 53 |
| 8704 Montiflora Ct | 0.33mi | 4/2.0 (+1) | 1,601 (-13%) | 3mo | $554,800 | $347 | 52 |
| 9013 Meadowsweet Way | 0.67mi | 4/2.0 (+1) | 1,744 (-5%) | 3mo | $574,000 | $329 | 49 |
| 8813 Williamson Dr | 0.74mi | 3/2.0 | 1,665 (-9%) | 1mo | $573,000 | $344 | 45 |
| 8770 Superb Cir | 0.66mi | 3/2.0 | 1,640 (-11%) | 3mo | $545,000 | $332 | 45 |
| 8932 Shady Vista Ct | 0.69mi | 4/2.5 (+1) | 1,997 (+9%) | 1mo | $635,000 | $318 | 45 |
Match score weights: distance 35% · size 25% · config 20% · recency 20%. Top-matched comps best support the ARV.
Projected returns pro-forma
-3.0% appreciation · 0.13% rent growth · sell at horizon
- IRR
- -24.3%
- Equity multiple
- 0.19×
- Total profit
- $-111,319
- Equity at exit
- $73,046
- IRR
- -29.0%
- Equity multiple
- -0.19×
- Total profit
- $-162,781
- Equity at exit
- $42,358
Cash invested: $137,172 (down + closing). Projections, not guarantees.
Landlord ↔ Tenant lean methodology
- Overall (STATE)
- 18 Strongly Tenant-Friendly
- State California
- 18 Strongly Tenant-Friendly · D+13
- County
- — inherits STATE
- City
- — inherits STATE
ZIP-level market 95624
- Rents YoY
- 0.1%
- Active inventory
- 243
- Price-to-rent
- 12.3×
Monthly cashflow live
- Estimated rent
- $3,329 high interval (Pro) →
- Mortgage (P&I)
- −$2,569
- Tax from tax record
- −$208 /mo · $2,501/yr
- Insurance
- −$204
- HOA
- −$0
- Vacancy / Maint / Mgmt
- −$699
- Net cashflow
- $-352
Break-even live
Sensitivity live
| Price | -10% $-74 | -5% $-213 | +0% $-352 | +5% $-490 | +10% $-629 |
|---|---|---|---|---|---|
| Rent | -10% $-615 | -5% $-483 | +0% $-352 | +5% $-220 | +10% $-89 |
| Rate | -1.0pp $-105 | -0.5pp $-227 | base $-352 | +0.5pp $-479 | +1.0pp $-608 |
UW: 25.0% down · 7.5% · 30yr · 1.5% tax · 5.0% vac · 8.0% maint · 8.0% mgmt
Financing live
Cash to close
- Down payment
- $122,475
- Closing costs
- $14,697
- Reserves months
- —
- Total cash needed
- —
Loan-product check · same deal, 3 products live
Conventional
25% down · 7.5% · 30yr
- Down + closing
- —
- Monthly P&I
- —
- Monthly cashflow
- —
- DSCR
- —
- Eligible?
- —
Personal DTI + credit; lowest rate.
DSCR
20% down · 8.5% · 30yr
- Down + closing
- —
- Monthly P&I
- —
- Monthly cashflow
- —
- DSCR
- —
- Eligible?
- —
No personal income docs; deal must DSCR.
Hard money
10% down · 12.0% · 12mo
- Down + closing
- —
- Monthly P&I
- —
- Monthly cashflow
- —
- DSCR
- —
- Eligible?
- —
Short-term bridge; refi at stabilization.
Rent comps 8 comps
| Address | Beds | Baths | Sqft | Rent | $/sqft | DOM | Units | Dist |
|---|---|---|---|---|---|---|---|---|
| 10087 Emerald Grove Dr Elk Grove, CA | 3.0 | 2.0 | 1354 | $2,575 | $1.90 | 45d | 1 | 0.85mi |
| 9101 Yount Ct Elk Grove, CA | 3.0 | 2.0 | 1664 | $5,500 | $3.31 | 5d | 1 | 1.01mi |
| 10191 Gatemont Cir Elk Grove, CA | 3.0 | 2.5 | 1800 | $2,800 | $1.56 | 25d | 1 | 1.10mi |
| 8418 Everson Ln Elk Grove, CA | 4.0 | 3.0 | 2476 | $3,400 | $1.37 | 25d | 1 | 1.17mi |
| 4917 Aizenberg Cir Elk Grove, CA | 3.0 | 2.0 | 1468 | $2,500 | $1.70 | 45d | 1 | 1.21mi |
| 10110 Elise Way Elk Grove, CA | 3.0 | 2.5 | 1628 | $3,300 | $2.03 | 9d | 1 | 1.36mi |
| 9270 Emerald Crest Dr Elk Grove, CA | 3.0 | 2.0 | 1454 | $2,550 | $1.75 | 6d | 1 | 1.36mi |
| 10114 Elise Way Elk Grove, CA | 4.0 | 3.0 | 2214 | $2,995 | $1.35 | 9d | 1 | 1.36mi |
Listing history 15 events
-
2026-06-21days on market $489,900 Active 32 DOM
-
2026-06-18days on market $489,900 Active 29 DOM
-
2026-06-17days on market $489,900 Active 28 DOM
-
2026-06-16days on market $489,900 Active 27 DOM
-
2026-06-15days on market $489,900 Active 26 DOM
-
2026-06-13days on market $489,900 Active 24 DOM
-
2026-06-13days on market $489,900 Active 23 DOM
-
2026-06-09days on market $489,900 Active 20 DOM
-
2026-06-08days on market $489,900 Active 19 DOM
-
2026-06-07days on market $489,900 Active 18 DOM
-
2026-06-05pricestatusdays on market $489,900 Active 15 DOM
-
2006-05-04soldstatus $371,000
-
2001-04-10soldstatus $169,000
-
1988-07-29soldstatus $99,000
-
1983-08-24soldstatus $72,000
ⓘ Source: listings_history table (triggers on properties + properties_extension) + one-shot
backfill from property_details.listing_events for pre-trigger history.
Tax reassessment forecast CA · Resets to sale price
- Current annual tax
- $2,501 · $208/mo
- Projected year-2 tax
- $3,723 · $310/mo
- Expected delta
- +$1,223/yr (+$102/mo · 48.9%)
ⓘ Screening estimate from a state-policy table — verify with the county assessor before closing.
Climate risk First Street
- Flood 1/10 Low FEMA zone X (unshaded) · 0% chance over 30 yrs
- Wildfire 5/10 Major
- Heat 7/10 Severe 7 d/yr ≥102°F today · 15 d/yr by 30 yrs out
- Wind 1/10 Low
- Air quality 10/10 Extreme 25 unhealthy d/yr today · 27 by 30 yrs out
Nearby sold comps map
Loading sold comps map…
Walkable amenities ~0.75 mi
Loading nearby amenities…
Taxation est. · year 1
- Rental income
- $39,950
- − Mortgage interest
- −$27,442
- − Property taxes
- −$2,501
- − Insurance
- −$2,450
- − Repairs & maintenance
- −$3,196
- − Management
- −$3,196
- − Depreciation
- −$14,252
- Taxable loss
- −$13,086
- Est. tax savings @ 24.0%
- +$3,141
- After-tax cash flow
- $-1,078/yr
For passive investors: Depreciation is non-cash, so a rental often shows a tax loss while cash-flowing — sheltering income. Rental losses are passive: they offset passive income freely, and up to $25,000/yr can offset ordinary (W-2) income if you actively participate and your MAGI is under $100k (phasing out to $0 by $150k); unused losses carry forward. On sale, claimed depreciation is recaptured at up to 25%, and gains may owe capital-gains tax (a 1031 exchange can defer both). Figures are a year-1 estimate at your 24.0% rate — not tax advice; consult a CPA.
Schools (NCES district)
- District
- Elk Grove Unified
- NCES district ID
- 0612330
- Math proficiency
- 40% ▼ -5.00%
- Reading proficiency
- 51% ▼ -5.00%
- Median HH income
- $67,860
- Composite
- 40.72/100
- National rank
- #3658
- State rank
- #165 of 517 in CA
Livability — Elk Grove
- Score
- 71/100
- State rank
- #212
- US rank
- #6681
Category grades
Schools grade is shown separately in the Schools card above.
Census & demographics
- Census place
- Elk Grove, CA
- County
- Sacramento County · 1,539,646 people
- City population
- 190,119
- Metro
- Sacramento-Roseville-Folsom, CA
- Population (ZIP)
- 67,630
- Household income
- $125,332
- Rent vs Own
- Severe rent burden
- 1160.0
Population outlook (Sacramento County) Hauer SSP2
- Today (2025)
- 1,660,763 people
- By 2030
- 1,732,990 · +4.3%
- By 2040
- 1,855,755 · +11.7%
- By 2050
- 1,941,335 · +16.9%
- By 2075
- 2,046,162 · +23.2%
- By 2100
- 1,961,444 · +18.1%
Race, ethnicity, and origin ACS 2023
- Neighborhood character
- Highly diverse neighborhood (Simpson 0.75)
- Race & ethnicity
- White 37% Asian 28% Hispanic / Latino 17% Two or more races 14% Black 8% Pacific Islander 2%
- Hispanic origin (detail)
- Mexican 14%
- Common ancestry
- Italian 2% Lithuanian 2% Russian 1%
- Foreign-born
- 25% · Vietnam, Canada, China
- Languages at home
- 66% English-only · Other Indo-European 7% Spanish 6% Vietnamese 6%
Political lean MEDSL · Sacramento
- 2024 margin
- D (+19.7) · D 58.1% · R 38.4% · Other 3.5%
- 2008→2024 swing
- +0.7pp no change · 2008: 19.0pp · 2024: 19.7pp
- All cycles
- 2024: D+19.7 2020: D+25.3 2016: D+23.7 2012: D+16.3 2008: D+19.0
Not yet ingested
- Civics
- —
Market trends
- HPI YoY
- ▼ -416.87%
- Current HPI
- 308.8294
- Rent YoY
- ▲ 0.13%
- Metro
- Sacramento-Roseville-Folsom, CA
- State GDP YoY
- ▲ 3.21%
- F500 in state
- 116
Industry mix (Fortune 500 HQ in CA)
| Industry | F500 HQs | Revenue |
|---|---|---|
| Technology | 27 | $1,492B |
|
||
| Financial Services | 3 | $174B |
|
||
| Retail | 3 | $44B |
|
||
| Insurance | 3 | $26B |
|
||
| Media / Entertainment | 2 | $115B |
|
||
| Pharmaceuticals / Biotech | 2 | $62B |
|
||
Price history
+415.3% since first listed4 events — show timeline
- 2006-05-04 Sold (Public Records) $371,000 Public Records
- 2001-04-10 Sold (Public Records) $169,000 Public Records
- 1988-07-29 Sold (Public Records) $99,000 Public Records
- 1983-08-24 Sold (Public Records) $72,000 Public Records
Property tax history
-2.0%/yrLatest (2025): $2,501 · +0.9% YoY. Source: county tax records.
Cash-flow waterfall
monthlySold comps — $/sqft
last 12 mo · ≤1 miLoading sold comps…