 🔨 Auction
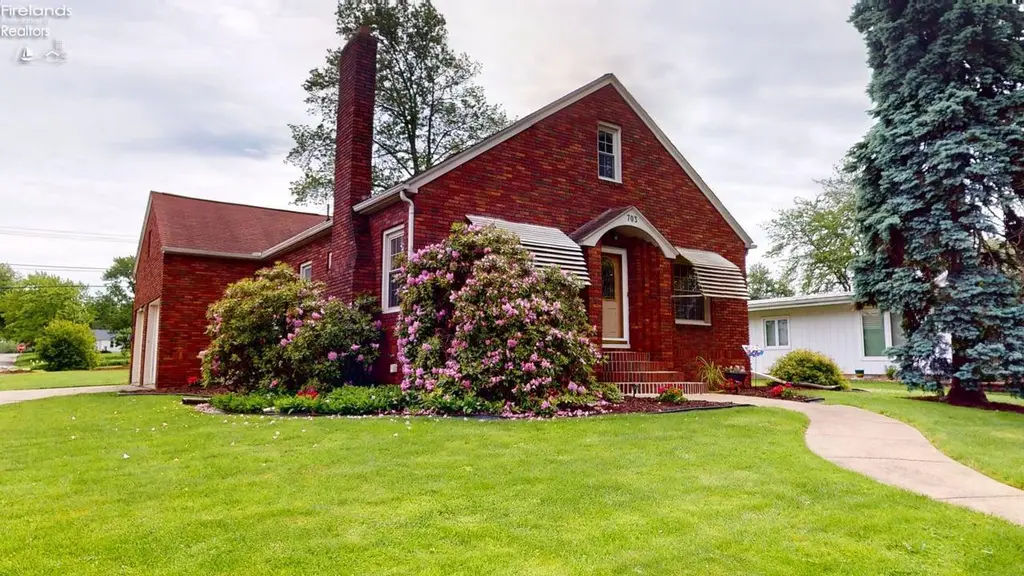
703 S Myrtle Ave · Willard, OH
Flood risk 1/10 · Minimal
- FEMA flood zone
- X (unshaded)
- Chance of flooding over 30 yrs
- 0.0%
- Est. flood insurance / yr
- $507 – $1,088
Fire risk 1/10 · Minimal
- Est. fire insurance / yr
- $713 – $1,323
Heat risk 3/10 · Minor
- Hot days now (above 98°F)
- 7 days/yr
- Hot days in 30 yrs
- 16 days/yr
Wind risk 1/10 · Minimal
- Chance of severe wind over 30 yrs
- —
Air-quality risk 2/10 · Minimal
- Unhealthy air days now
- 0 days/yr
- Unhealthy air days in 30 yrs
- 1 days/yr
Risk factors via First Street. Map © Google.
Why this score? — see what drove the F grade
The composite is a weighted blend of 9 inputs, each scored 0–100. Each bar is that input's sub-score; the figure is the points it added to the 100-point composite (weight × sub-score).
- Cash flow +7.8/30.0
- ARV discount +7.5/15.0
- Schools +3.7/10.0
- Livability +3.5/5.0
- Rent growth +2.5/5.0
- Condition / age +2.5/5.0
- 1% rule +2.3/10.0
- DSCR +1.9/10.0
- Appreciation +0.0/10.0
$1
🖨 Deal sheet 📄 Offer letter ✓ Due diligence
Listing remarks
Auction- Selling at auction on June 24th @ 6:30 PM. Auction held on site. Wonderfully located toward the heart of downtown Willard. House features a brick exterior with a two car attached garage. Three bedrooms with two on the main floor. Upstairs bedroom spans the entire second floor and offers additional walk in closet or storage/ play area. Eat in kitchen that walks out onto the rear deck. Spacious living room with wood burning fire place. Natural woodwork. Full basement. Large back yard with alley access. Starter home, upgrade or investment, this house has tons of potential. Open house dates 6/10 from 6-730pm, 6/13 from 9-1030 am or by appointment. Selling AS-IS and subject to seller co
Key facts
- Natural woodwork
- Brick exterior
- Eat in kitchen
Tags
Property features AI
Exterior
- Parking: Attached 2-car garage; Garage door opener; Paved off-street parking
- Utilities: Public water; Public sewer
- Home design: Single-family residential property
- Construction: Brick construction
- Exterior features: Asphalt roof; Lot approximately 0.265 acres
Interior
- Kitchen: Range
- Bathrooms: 1 full bathroom
- Heating & cooling: Forced air heating (natural gas); Central air conditioning; Ceiling fans
- Interior features: Wood-burning fireplace; Full basement with sump pump; 6 total rooms
- Laundry & utility: Washer; Dryer
Neighborhood map
What this means for you Summary
Snapshot
- This is a 3-bed/1.0-bath single-family listed at $1.
Deal economics
- At list price, monthly cash flow is $-168 ($-2k/yr) — negative.
- The deal already cash-flows at list — no discount required.
- Meets the 1% rule at list price ($1k rent vs $1).
- Cap rate 4.9% vs local median 3.6% in Willard — top-decile yield for the area; either an underpriced asset or a hidden risk that comps aren't pricing in. Stress-test before assuming the spread holds.
Location & tenants
- Location reads 70/100 on livability (#469 in OH) — a middle-class / working-renter tenant base. Strengths: cost of living A+, housing A+, health & safety A+; Watch: schools D+, employment D+, amenities F.
- Willard City (town): math 38% / reading 49% proficiency, ranked #505 of 656 in OH (top 77%) — families likely to look elsewhere, expect single-tenant / working-renter base with shorter leases.
- Market conditions: 57 active listings in the ZIP; 40 units permitted in Huron County in 2024 (0 in 5+ unit buildings).
Forward outlook
- Local home prices are declining (-3.0%/yr); year-one equity from $1k of loan paydown is wiped out by about $4k of value loss. Plan a longer hold.
- Huron County population projected at -22% by 2050 — secular population decline; favor cash flow + early exit over multi-decade hold.
Negotiation context
- It's been on market 25 days — a 2% lower offer ($0) is reasonable based on typical stale-listing flexibility.
Risks & watch-outs
- Watch-outs: property tax is 224112.0% of price; built in 1938 — expect roof / HVAC / electrical / plumbing capex.
Questions for the listing agent
- What do current leases actually rent for vs. the listed asking? Can we see a recent rent roll and the last 12 months of T-12 income?
- Built in 1938 — when were the roof, HVAC, electrical panel, plumbing, and water heater last replaced?
- Property tax is high relative to price — has the assessment been appealed recently, and will the sale trigger a re-assessment?
- Is there a deadline driving the sale (1031 exchange, divorce, estate, relocation)? That informs how much negotiation room exists.
- Schools are D-rated, which usually means shorter tenancies and higher turnover. Who's the typical renter profile here, and what's been the actual vacancy rate?
- The area grade is low — what's the realistic commute time and amenity access for the typical tenant pool here? Any planned neighborhood developments (good or bad) we should know about?
- What's the average days-on-market for RENTAL listings here right now (not sales)? A rising rental-DOM trend means longer vacancies and softer asking-rent achievability than the comps imply.
- What's the recent tenant-quality profile in this submarket — average credit score on applications, eviction rate, late-payment / NSF rate, and stable-employment percentage? A property-management company in the area should have these aggregated.
- How much new for-sale + rental construction is in the pipeline within 1–3 miles? Heavy new supply typically softens prices + rents 12–24 months out; constrained supply supports both.
Investment metrics
- 1% rule
- 0.73% ✗
- Cap rate
- 4.94%
- Cash-on-cash
- -4.82%
- DSCR
- 0.79
- GRM
- 11.4
CMA / ARV
- ARV (on-the-fly)
- $149,408
- Comps found
- 12
Show comp detail 12 sales within ~0.75 mi
| Address | Dist | Beds/Ba | Sqft | Sold | Price | $/sf | Match |
|---|---|---|---|---|---|---|---|
| 620 Dale Ave | 0.12mi | 3/2.0 | 1,296 (+1%) | 3mo | $196,550 | $152 | 87 |
| 40 Crestwood Dr | 0.31mi | 3/3.0 | 1,290 (+0%) | 1mo | $246,400 | $191 | 76 |
| 338 E Howard St | 0.31mi | 3/2.0 | 1,356 (+5%) | 4mo | $207,000 | $153 | 70 |
| 655 Spangler St | 0.32mi | 2/2.0 (-1) | 1,216 (-6%) | 2mo | $135,000 | $111 | 65 |
| 537 Clark St | 0.25mi | 2/1.0 (-1) | 1,171 (-9%) | 5mo | $135,000 | $115 | 64 |
| 49 Hillcrest Dr | 0.34mi | 3/1.5 | 1,424 (+11%) | 2mo | $164,900 | $116 | 63 |
| 606 Park St | 0.20mi | 4/1.0 (+1) | 1,456 (+13%) | 4mo | $150,000 | $103 | 61 |
| 402 W Pearl St | 0.54mi | 2/1.0 (-1) | 1,328 (+3%) | 6mo | $157,000 | $118 | 60 |
| 14 E Laurel St | 0.27mi | 3/1.0 | 1,120 (-13%) | 7mo | $129,900 | $116 | 59 |
| 33 Spring St | 0.74mi | 3/1.0 | 1,257 (-2%) | 6mo | $90,500 | $72 | 56 |
| 517 W Maple St | 0.65mi | 3/1.0 | 1,144 (-11%) | 3mo | $112,900 | $99 | 48 |
| 406 Emerald St | 0.49mi | 2/1.0 (-1) | 1,096 (-15%) | 4mo | $110,000 | $100 | 44 |
Match score weights: distance 35% · size 25% · config 20% · recency 20%. Top-matched comps best support the ARV.
Projected returns pro-forma
-3.0% appreciation · 3.0% rent growth · sell at horizon
- IRR
- -24.5%
- Equity multiple
- 0.17×
- Total profit
- $-34,899
- Equity at exit
- $22,277
- IRR
- -19.9%
- Equity multiple
- -0.05×
- Total profit
- $-44,106
- Equity at exit
- $12,918
Cash invested: $41,834 (down + closing). Projections, not guarantees.
Landlord ↔ Tenant lean methodology
- Overall (STATE)
- 73 Landlord-Friendly
- State Ohio
- 73 Landlord-Friendly · R+6
- County
- — inherits STATE
- City
- — inherits STATE
ZIP-level market 44890
- Home prices YoY
- -16.2%
- Active inventory
- 57
Monthly cashflow live
- Estimated rent
- $1,094 medium interval (Pro) →
- Mortgage (P&I)
- −$784
- Tax est. 1.5%
- −$187 /mo · $2,241/yr
- Insurance
- −$62
- HOA
- −$0
- Vacancy / Maint / Mgmt
- −$230
- Net cashflow
- $-168
Break-even live
UW: 25.0% down · 7.5% · 30yr · 1.5% tax · 5.0% vac · 8.0% maint · 8.0% mgmt
Financing live
Cash to close
- Down payment
- $37,352
- Closing costs
- $4,482
- Reserves months
- —
- Total cash needed
- —
Loan-product check · same deal, 3 products live
Conventional
25% down · 7.5% · 30yr
- Down + closing
- —
- Monthly P&I
- —
- Monthly cashflow
- —
- DSCR
- —
- Eligible?
- —
Personal DTI + credit; lowest rate.
DSCR
20% down · 8.5% · 30yr
- Down + closing
- —
- Monthly P&I
- —
- Monthly cashflow
- —
- DSCR
- —
- Eligible?
- —
No personal income docs; deal must DSCR.
Hard money
10% down · 12.0% · 12mo
- Down + closing
- —
- Monthly P&I
- —
- Monthly cashflow
- —
- DSCR
- —
- Eligible?
- —
Short-term bridge; refi at stabilization.
Listing history 15 events
-
2026-06-18days on market $1 Active 25 DOM
-
2026-06-17days on market $1 Active 24 DOM
-
2026-06-16days on market $1 Active 23 DOM
-
2026-06-15days on market $1 Active 22 DOM
-
2026-06-13days on market $1 Active 20 DOM
-
2026-06-12days on market $1 Active 19 DOM
-
2026-06-09days on market $1 Active 16 DOM
-
2026-06-08days on market $1 Active 15 DOM
-
2026-06-08days on market $1 Active 14 DOM
-
2026-06-07days on market $1 Active 13 DOM
-
2026-06-04days on market $1 Active 10 DOM
-
2026-06-02days on market $1 Active 9 DOM
-
2026-06-01days on market $1 Active 8 DOM
-
2026-05-31days on market $1 Active 7 DOM
-
2026-05-24$1 Active
ⓘ Source: listings_history table (triggers on properties + properties_extension) + one-shot
backfill from property_details.listing_events for pre-trigger history.
Climate risk First Street
- Flood 1/10 Low FEMA zone X (unshaded) · 0% chance over 30 yrs
- Wildfire 1/10 Low
- Heat 3/10 Moderate 7 d/yr ≥98°F today · 16 d/yr by 30 yrs out
- Wind 1/10 Low
- Air quality 2/10 Low 0 unhealthy d/yr today · 1 by 30 yrs out
Nearby sold comps map
Loading sold comps map…
Walkable amenities ~0.75 mi
Loading nearby amenities…
Taxation est. · year 1
- Rental income
- $13,131
- − Mortgage interest
- −$8,369
- − Property taxes
- −$2,241
- − Insurance
- −$747
- − Repairs & maintenance
- −$1,050
- − Management
- −$1,050
- − Depreciation
- −$4,346
- Taxable loss
- −$4,674
- Est. tax savings @ 24.0%
- +$1,122
- After-tax cash flow
- $-895/yr
For passive investors: Depreciation is non-cash, so a rental often shows a tax loss while cash-flowing — sheltering income. Rental losses are passive: they offset passive income freely, and up to $25,000/yr can offset ordinary (W-2) income if you actively participate and your MAGI is under $100k (phasing out to $0 by $150k); unused losses carry forward. On sale, claimed depreciation is recaptured at up to 25%, and gains may owe capital-gains tax (a 1031 exchange can defer both). Figures are a year-1 estimate at your 24.0% rate — not tax advice; consult a CPA.
Schools (NCES district)
- District
- Willard City
- NCES district ID
- 3904509
- Math proficiency
- 38% ▼ -14.00%
- Reading proficiency
- 49% ▼ -7.00%
- Median HH income
- $46,675
- Composite
- 37.04/100
- National rank
- #4512
- State rank
- #505 of 656 in OH
Livability — Willard
- Score
- 70/100
- State rank
- #469
- US rank
- #7772
Category grades
Schools grade is shown separately in the Schools card above.
Census & demographics
- Census place
- Willard, OH
- County
- Huron · 56,496 people
- Population (ZIP)
- 10,364
- Household income
- $64,971
- Rent vs Own
- Severe rent burden
- 5.8
Population outlook (Huron County) Hauer SSP2
- Today (2025)
- 55,572 people
- By 2030
- 53,514 · -3.7%
- By 2040
- 48,770 · -12.2%
- By 2050
- 43,611 · -21.5%
- By 2075
- 32,349 · -41.8%
- By 2100
- 21,849 · -60.7%
Race, ethnicity, and origin ACS 2023
- Neighborhood character
- Predominantly White (83%)
- Race & ethnicity
- White 83% Hispanic / Latino 13% Two or more races 4%
- Hispanic origin (detail)
- Mexican 9% Puerto Rican 2%
- Common ancestry
- Iranian 3% Slovak 1% Lithuanian 1%
- Foreign-born
- 3% · Canada
- Languages at home
- 92% English-only · Spanish 6% German/W. Germanic 1%
Political lean MEDSL · Huron
- 2024 margin
- Solid R (+44.0) · D 27.6% · R 71.6%
- 2008→2024 swing
- -40.9pp toward R · 2008: -3.1pp · 2024: -44.0pp
- All cycles
- 2024: R+44.0 2020: R+41.2 2016: R+36.4 2012: R+8.9 2008: R+3.1
Not yet ingested
- Civics
- —
Market trends
- HPI YoY
- ▼ -44.45%
- Current HPI
- 229.9428
- Rent YoY
- —
- Metro
- —
- State GDP YoY
- ▲ 1.98%
- F500 in state
- 48
Industry mix (Fortune 500 HQ in OH)
| Industry | F500 HQs | Revenue |
|---|---|---|
| Insurance | 3 | $145B |
|
||
| Industrial Machinery | 3 | $49B |
|
||
| Financial Services | 3 | $24B |
|
||
| Consumer Goods | 2 | $93B |
|
||
| Aerospace / Defense | 2 | $47B |
|
||
| Utilities | 2 | $33B |
|
||
Property tax history
+3.0%/yrLatest (2025): $1,541 · +0.5% YoY. Source: county tax records.
Cash-flow waterfall
monthlySold comps — $/sqft
last 12 mo · ≤1 miLoading sold comps…