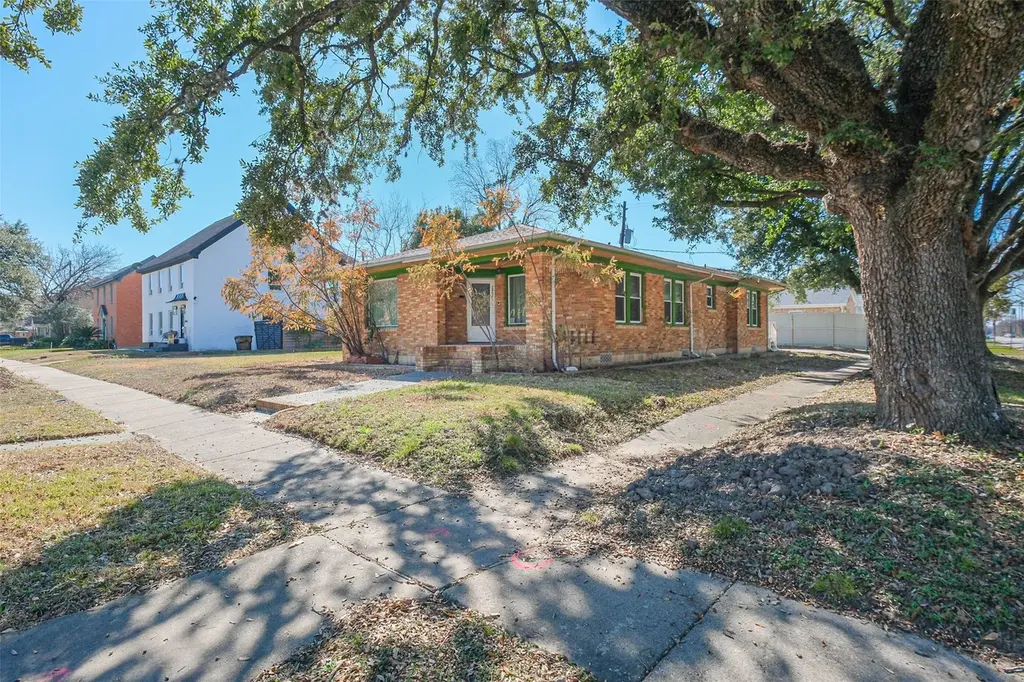
2802 Wheeler St · Houston, TX
Flood risk 4/10 · Minor
- FEMA flood zone
- X (unshaded)
- Chance of flooding over 30 yrs
- 0.2%
- Est. flood insurance / yr
- $507 – $1,088
Fire risk 1/10 · Minimal
- Est. fire insurance / yr
- $1,222 – $2,270
Heat risk 9/10 · Severe
- Hot days now (above 109°F)
- 7 days/yr
- Hot days in 30 yrs
- 25 days/yr
Wind risk 9/10 · Severe
- Chance of severe wind over 30 yrs
- 99.0%
Air-quality risk 2/10 · Minimal
- Unhealthy air days now
- 2 days/yr
- Unhealthy air days in 30 yrs
- 2 days/yr
Risk factors via First Street. Map © Google.
Why this score? — see what drove the D grade
The composite is a weighted blend of 9 inputs, each scored 0–100. Each bar is that input's sub-score; the figure is the points it added to the 100-point composite (weight × sub-score).
- ARV discount +15.0/15.0
- Cash flow +9.4/30.0
- 1% rule +4.1/10.0
- Livability +3.7/5.0
- Schools +2.7/10.0
- DSCR +2.6/10.0
- Condition / age +2.5/5.0
- Rent growth +2.4/5.0
- Appreciation +0.0/10.0
$275,000
🖨 Deal sheet 📄 Offer letter ✓ Due diligence
Listing remarks MLS
Conveniently situated near Downtown, the Medical Center, one block from TCU, and a half mile from UofH universities, this 1940s property on a corner lot comes with an additional lot, offering great potential for adding value. Ideal for renovation or as a lucrative addition to a rental portfolio.
Key facts
- Half mile from uofh
- Near downtown
- One block from tcu
Tags
Neighborhood map
What this means for you Summary
Snapshot
- This is a 3-bed/1.0-bath single-family listed at $275k.
Deal economics
- At list price, monthly cash flow is $-196 ($-2k/yr) — negative.
- To cash-flow at today's rent, offer at most $240k (12.6% below list).
- To meet the 1% rule (rent ≥ 1% of price), the offer needs to be $249k (9.3% below list).
- Recommended offer: $240k (12.6% below list) — sets the bar for cash-flow.
- Cap rate 5.4% vs local median 3.2% in Houston — top-decile yield for the area; either an underpriced asset or a hidden risk that comps aren't pricing in. Stress-test before assuming the spread holds.
Location & tenants
- Location reads 74/100 on livability (#184 in TX, #4,771 nationally) — a middle-class / working-renter tenant base. Strengths: amenities A+, cost of living A+, housing A+; Watch: schools D, crime F.
- Houston ISD (urban): math 27% / reading 35% proficiency, ranked #593 of 826 in TX (top 72%) — families likely to look elsewhere, expect single-tenant / working-renter base with shorter leases; 71% free/reduced lunch — lower-income household profile, screen leases tightly.
- Market conditions: Rents soft (-0.3%/yr); 581 active listings in the ZIP; 40 comparable units currently listed for rent nearby; rentals at typical pace (median 14d on market — plan ~3-4 weeks tenant-placement turnaround); 29,883 units permitted in Harris County in 2024 (8,621 in 5+ unit buildings).
- This rent runs 42% of the median local income ($71k/yr) — at the standard rent-burdened threshold; future hikes will face affordability resistance.
Forward outlook
- Local home prices are declining (-3.0%/yr); year-one equity from $2k of loan paydown is wiped out by about $8k of value loss. Plan a longer hold.
- Harris County population projected at +47% by 2050 — long-run rental-demand tailwind backs the buy-and-hold thesis.
Negotiation context
- It's been on market 127 days — a 12% lower offer ($242k) is reasonable based on typical stale-listing flexibility.
Risks & watch-outs
- Watch-outs: property tax is 2.7% of price; built in 1940 — expect roof / HVAC / electrical / plumbing capex.
- Climate carrying-cost: severe wind risk, 99% chance of damaging wind over 30y; extreme-heat days projected 7→25/yr by 2055 (HVAC capex compounding) — expect insurance premiums to compound above CPI over the hold.
Questions for the listing agent
- What do current leases actually rent for vs. the listed asking? Can we see a recent rent roll and the last 12 months of T-12 income?
- It's been on market 127 days. Have you received any prior offers? Is the seller open to a 13% concession, seller financing, or rate buy-down credit?
- Built in 1940 — when were the roof, HVAC, electrical panel, plumbing, and water heater last replaced?
- Property tax is high relative to price — has the assessment been appealed recently, and will the sale trigger a re-assessment?
- Why hasn't it sold? Are there any deal-killer items the seller is aware of (foundation, flood, title, zoning, code violations)?
- Is there a deadline driving the sale (1031 exchange, divorce, estate, relocation)? That informs how much negotiation room exists.
- Schools are D-rated, which usually means shorter tenancies and higher turnover. Who's the typical renter profile here, and what's been the actual vacancy rate?
- Crime grade is F in this area — have there been break-ins, vandalism, or insurance claims at this property in the last 3 years? What carrier currently insures it and at what premium?
- The area grade is low — what's the realistic commute time and amenity access for the typical tenant pool here? Any planned neighborhood developments (good or bad) we should know about?
- What's the average days-on-market for RENTAL listings here right now (not sales)? A rising rental-DOM trend means longer vacancies and softer asking-rent achievability than the comps imply.
- What's the recent tenant-quality profile in this submarket — average credit score on applications, eviction rate, late-payment / NSF rate, and stable-employment percentage? A property-management company in the area should have these aggregated.
- How much new for-sale + rental construction is in the pipeline within 1–3 miles? Heavy new supply typically softens prices + rents 12–24 months out; constrained supply supports both.
Investment metrics
- 1% rule
- 0.91% ✗
- Cap rate
- 5.44%
- Cash-on-cash
- -3.06%
- DSCR
- 0.86
- GRM
- 9.2
CMA / ARV
- ARV (median comp)
- $346,387
- List price
- $275,000
- Delta
- -20.61%
- Verdict
- UNDERPRICED
- Comps
- 20 within 1.0 mi
Show comp detail 12 sales within ~0.75 mi
| Address | Dist | Beds/Ba | Sqft | Sold | Price | $/sf | Match |
|---|---|---|---|---|---|---|---|
| 2619 Rosewood St | 0.09mi | 3/2.0 | 1,648 (+4%) | 4mo | $399,900 | $243 | 82 |
| 2512 Cleburne St | 0.23mi | 3/2.5 | 1,597 (+1%) | 4mo | $300,000 | $188 | 78 |
| 2909 Arbor St | 0.24mi | 3/2.0 | 1,568 (-1%) | 8mo | $349,500 | $223 | 77 |
| 2715 Arbor St | 0.23mi | 2/2.0 (-1) | 1,583 (+0%) | 8mo | $325,000 | $205 | 73 |
| 3439 Wentworth St | 0.64mi | 3/2.0 | 1,587 (+0%) | 1mo | $330,000 | $208 | 64 |
| 2708 Arbor St | 0.26mi | 2/2.0 (-1) | 1,691 (+7%) | 9mo | $259,000 | $153 | 60 |
| 2821 Winbern St | 0.40mi | 4/1.5 (+1) | 1,640 (+4%) | 11mo | $149,900 | $91 | 59 |
| 5313 Palmer St | 0.57mi | 3/2.5 | 1,479 (-6%) | 1mo | $245,000 | $166 | 56 |
| 2015 Alabama St | 0.59mi | 3/2.0 | 1,726 (+9%) | 8mo | $149,990 | $87 | 47 |
| 2210 Berry St | 0.55mi | 3/2.5 | 1,758 (+11%) | 5mo | $410,000 | $233 | 46 |
| 3508 Sauer St | 0.50mi | 3/3.5 | 1,737 (+10%) | 7mo | $375,000 | $216 | 45 |
| 2010 Blodgett St Unit G | 0.52mi | 2/2.0 (-1) | 1,799 (+14%) | 2mo | $368,500 | $205 | 42 |
Match score weights: distance 35% · size 25% · config 20% · recency 20%. Top-matched comps best support the ARV.
Projected returns pro-forma
-3.0% appreciation · 0.0% rent growth · sell at horizon
- IRR
- -25.3%
- Equity multiple
- 0.17×
- Total profit
- $-64,158
- Equity at exit
- $41,003
- IRR
- -37.4%
- Equity multiple
- -0.29×
- Total profit
- $-99,373
- Equity at exit
- $23,777
Cash invested: $77,000 (down + closing). Projections, not guarantees.
Landlord ↔ Tenant lean methodology
- Overall (STATE)
- 87 Strongly Landlord-Friendly
- State Texas
- 87 Strongly Landlord-Friendly · R+5
- County
- — inherits STATE
- City
- — inherits STATE
ZIP-level market 77004
- Rents YoY
- -0.3%
- Active inventory
- 581
- Price-to-rent
- 9.2×
Monthly cashflow live
- Estimated rent
- $2,493 high interval (Pro) →
- Mortgage (P&I)
- −$1,442
- Tax from tax record
- −$609 /mo · $7,308/yr
- Insurance
- −$115
- HOA
- −$0
- Vacancy / Maint / Mgmt
- −$524
- Net cashflow
- $-196
Break-even live
UW: 25.0% down · 7.5% · 30yr · 1.5% tax · 5.0% vac · 8.0% maint · 8.0% mgmt
Financing live
Cash to close
- Down payment
- $68,750
- Closing costs
- $8,250
- Reserves months
- —
- Total cash needed
- —
Loan-product check · same deal, 3 products live
Conventional
25% down · 7.5% · 30yr
- Down + closing
- —
- Monthly P&I
- —
- Monthly cashflow
- —
- DSCR
- —
- Eligible?
- —
Personal DTI + credit; lowest rate.
DSCR
20% down · 8.5% · 30yr
- Down + closing
- —
- Monthly P&I
- —
- Monthly cashflow
- —
- DSCR
- —
- Eligible?
- —
No personal income docs; deal must DSCR.
Hard money
10% down · 12.0% · 12mo
- Down + closing
- —
- Monthly P&I
- —
- Monthly cashflow
- —
- DSCR
- —
- Eligible?
- —
Short-term bridge; refi at stabilization.
Rent comps 40 comps
| Address | Beds | Baths | Sqft | Rent | $/sqft | DOM | Units | Dist |
|---|---|---|---|---|---|---|---|---|
| 2703 Blodgett St Unit 1047952P Houston, TX | 1.0–5.0 | 1.5–5.5 | 2497 | $11,718 | $4.69 | 2d | 2 | 0.14mi |
| 4306 Ennis St Houston, TX | 3.0 | 3.0 | 1989 | $2,500 | $1.26 | 44d | 1 | 0.14mi |
| 2401 Eagle St Houston, TX | 4.0 | 4.0 | 1700 | $2,800 | $1.65 | 44d | 1 | 0.25mi |
| 2615 Arbor St Unit 1047947P Houston, TX | 2.0 | 2.0 | 1194 | $2,387 | $2.00 | 2d | 1 | 0.25mi |
| 2615 Arbor St Unit 1047942P Houston, TX | 2.0 | 2.0 | 1194 | $2,742 | $2.30 | 22d | 1 | 0.25mi |
| 2319 Rosewood St Unit A Houston, TX | 3.0 | 1.0 | 1333 | $1,515 | $1.14 | 24d | 1 | 0.25mi |
| 2511 Arbor St Houston, TX | 2.0 | 1.0 | 1368 | $2,450 | $1.79 | 11d | 1 | 0.28mi |
| 2311 Eagle St Houston, TX | 3.0 | 4.0 | 1783 | $2,500 | $1.40 | 44d | 1 | 0.30mi |
| 2307 Arbor St Houston, TX | 2.0 | 1.0 | 1325 | $2,295 | $1.73 | 44d | 1 | 0.37mi |
| 2209 Alabama St Unit B Houston, TX | 3.0 | 2.5 | 2074 | $2,350 | $1.13 | 44d | 1 | 0.47mi |
| 3229 Holman St Houston, TX | 4.0 | 4.0 | 1632 | $1,200 | $0.74 | 44d | 1 | 0.61mi |
| 1802 Wentworth St Unit 1542674P Houston, TX | 1.0–2.0 | 1.0–2.0 | 1016 | $6,374 | $6.27 | 2d | 2 | 0.63mi |
| 4704 Chenevert St Unit B Houston, TX | 2.0 | 1.0 | 1200 | $1,700 | $1.42 | 44d | 1 | 0.64mi |
| 3603 Chenevert St Houston, TX | 1.0–2.0 | 1.0–2.0 | 1020 | $2,129 | $2.09 | 14d | 8 | 0.69mi |
| 3609 Chenevert St Houston, TX | 2.0 | 2.0 | 1168 | $1,749 | $1.50 | 22d | 1 | 0.70mi |
| 3609 Chenevert St Houston, TX | 2.0 | 2.0 | 1168 | $1,749 | $1.50 | 20d | 1 | 0.70mi |
| 3213 Saint Emanuel St Houston, TX | 4.0 | 3.5 | 2100 | $3,300 | $1.57 | 17d | 1 | 0.71mi |
| 3012 Live Oak St Unit A Houston, TX | 3.0 | 2.0 | 1188 | $1,395 | $1.17 | 21d | 1 | 0.71mi |
| 1942 Prospect St Unit OHNP2 Houston, TX | 2.0 | 2.0 | 1279 | $3,397 | $2.66 | 5d | 1 | 0.73mi |
| 1942 Prospect St Unit OHNP2 Houston, TX | 2.0 | 2.0 | 1279 | $3,397 | $2.66 | 4d | 1 | 0.73mi |
| 5506 Sampson St Houston, TX | 3.0 | 3.0 | 1287 | $920 | $0.71 | 24d | 1 | 0.73mi |
| 4899 La Branch St Houston, TX | 2.0 | 2.0 | 1175 | $2,191 | $1.86 | 24d | 1 | 0.84mi |
| 5751 Almeda Rd Houston, TX | 2.0 | 2.0 | 1148 | $2,040 | $1.78 | 44d | 1 | 0.91mi |
| 5755 Almeda Rd Unit 2174 Houston, TX | 2.0 | 2.0 | 1148 | $2,174 | $1.89 | 11d | 1 | 0.92mi |
| 5755 Almeda Rd Unit 5792 Houston, TX | 2.0 | 2.0 | 1148 | $2,185 | $1.90 | 12d | 1 | 0.92mi |
| 5755 Almeda Rd Unit 2162 Houston, TX | 2.0 | 2.0 | 1148 | $2,150 | $1.87 | 5d | 1 | 0.92mi |
| 5755 Almeda Rd Unit 2187 Houston, TX | 2.0 | 2.0 | 1148 | $2,185 | $1.90 | 5d | 1 | 0.92mi |
| 5755 Almeda Rd Unit 2148 Houston, TX | 2.0 | 2.0 | 1148 | $2,142 | $1.87 | 3d | 1 | 0.92mi |
| 5755 Almeda Rd Unit 422 Houston, TX | 2.0 | 2.0 | 1148 | $2,150 | $1.87 | 8d | 1 | 0.92mi |
| 3507 Canfield St Houston, TX | 3.0 | 2.5 | 2200 | $2,350 | $1.07 | 24d | 1 | 0.92mi |
| 5350 Crawford St Unit 5383 Houston, TX | 3.0 | 2.0 | 1991 | $4,460 | $2.24 | 11d | 1 | 0.94mi |
| 5350 Crawford St Unit 3165 Houston, TX | 3.0 | 2.0 | 1991 | $4,428 | $2.22 | 3d | 1 | 0.94mi |
| 3 Hermann Museum Circle Dr Houston, TX | 3.0 | 1.0–2.5 | 1075 | $8,103 | $7.53 | 44d | 1 | 0.96mi |
| 5815 Almeda Rd Houston, TX | 2.0 | 2.0 | 1209 | $2,967 | $2.45 | 12d | 1 | 0.97mi |
| 5501 La Branch St Houston, TX | 3.0 | 3.0 | 964 | $4,875 | $5.06 | 5d | 245 | 0.99mi |
| 1615 Hermann Dr Houston, TX | 2.0 | 2.0 | 1175 | $2,191 | $1.86 | 44d | 1 | 1.00mi |
| 1699 Hermann Dr Houston, TX | 2.0 | 1.0–2.5 | 1331 | $7,118 | $5.35 | 2d | 10 | 1.01mi |
| 1615 Hermann Dr Unit 2148 Houston, TX | 2.0 | 2.0 | 1292 | $2,566 | $1.99 | 3d | 1 | 1.01mi |
| 4001 Fannin St Houston, TX | 3.0 | 1.0–3.0 | 1536 | $3,158 | $2.06 | 3d | 16 | 1.02mi |
| 1701 Hermann Dr Houston, TX | 2.0 | 1.0–2.0 | 1210 | $4,355 | $3.60 | 3d | 4 | 1.03mi |
Listing history 16 events
-
2026-06-18days on market $275,000 Pending 127 DOM
-
2026-06-17days on market $275,000 Pending 126 DOM
-
2026-06-16days on market $275,000 Pending 125 DOM
-
2026-06-16status $275,000 Pending 124 DOM
-
2026-06-15days on market $275,000 Active 124 DOM
-
2026-06-13days on market $275,000 Active 122 DOM
-
2026-06-10days on market $275,000 Active 118 DOM
-
2026-06-08days on market $275,000 Active 117 DOM
-
2026-06-08price $275,000 Active 116 DOM
-
2026-06-07days on market $290,000 Active 116 DOM
-
2026-06-04days on market $290,000 Active 113 DOM
-
2026-06-01days on market $290,000 Active 110 DOM
-
2026-05-31days on market $290,000 Active 109 DOM
-
2026-04-18price $290,000 296-char remark
Show marketing remark (296 chars)
Conveniently situated near Downtown, the Medical Center, one block from TCU, and a half mile from UofH universities, this 1940s property on a corner lot comes with an additional lot, offering great potential for adding value. Ideal for renovation or as a lucrative addition to a rental portfolio.
-
2026-02-11$300,000 Active 296-char remark
Show marketing remark (296 chars)
Conveniently situated near Downtown, the Medical Center, one block from TCU, and a half mile from UofH universities, this 1940s property on a corner lot comes with an additional lot, offering great potential for adding value. Ideal for renovation or as a lucrative addition to a rental portfolio.
-
1997-05-07soldstatus
ⓘ Source: listings_history table (triggers on properties + properties_extension) + one-shot
backfill from property_details.listing_events for pre-trigger history.
Tax reassessment forecast TX · Resets to sale price
- Current annual tax
- $7,308 · $609/mo
- Projected year-2 tax
- $7,308 · $609/mo
- Expected delta
- $0/yr ($0/mo · 0.0%)
ⓘ Screening estimate from a state-policy table — verify with the county assessor before closing.
Climate risk First Street
- Flood 4/10 Moderate FEMA zone X (unshaded) · 20% chance over 30 yrs
- Wildfire 1/10 Low
- Heat 9/10 Extreme 7 d/yr ≥109°F today · 25 d/yr by 30 yrs out
- Wind 9/10 Extreme 99% chance of damaging wind over 30 yrs
- Air quality 2/10 Low 2 unhealthy d/yr today · 2 by 30 yrs out
Nearby sold comps map
Loading sold comps map…
Walkable amenities ~0.75 mi
Loading nearby amenities…
Taxation est. · year 1
- Rental income
- $29,918
- − Mortgage interest
- −$15,404
- − Property taxes
- −$7,308
- − Insurance
- −$1,375
- − Repairs & maintenance
- −$2,393
- − Management
- −$2,393
- − Depreciation
- −$8,000
- Taxable loss
- −$6,956
- Est. tax savings @ 24.0%
- +$1,669
- After-tax cash flow
- $-684/yr
For passive investors: Depreciation is non-cash, so a rental often shows a tax loss while cash-flowing — sheltering income. Rental losses are passive: they offset passive income freely, and up to $25,000/yr can offset ordinary (W-2) income if you actively participate and your MAGI is under $100k (phasing out to $0 by $150k); unused losses carry forward. On sale, claimed depreciation is recaptured at up to 25%, and gains may owe capital-gains tax (a 1031 exchange can defer both). Figures are a year-1 estimate at your 24.0% rate — not tax advice; consult a CPA.
Schools (NCES district)
- District
- Houston ISD
- NCES district ID
- 4823640
- Math proficiency
- 27% ▼ -18.00%
- Reading proficiency
- 35% ▼ -6.00%
- Median HH income
- $46,054
- Composite
- 26.63/100
- National rank
- #7173
- State rank
- #593 of 826 in TX
Livability — Houston
- Score
- 74/100
- State rank
- #184
- US rank
- #4771
Category grades
Schools grade is shown separately in the Schools card above.
Census & demographics
- Census place
- Houston, TX
- County
- Harris County · 4,702,590 people
- City population
- 3,226,434
- Metro
- Houston-The Woodlands-Sugar Land, TX
- Population (ZIP)
- 35,997
- Household income
- $71,199
- Rent vs Own
- Severe rent burden
- 3072.0
Population outlook (Harris County) Hauer SSP2
- Today (2025)
- 5,571,493 people
- By 2030
- 6,089,821 · +9.3%
- By 2040
- 7,142,806 · +28.2%
- By 2050
- 8,185,864 · +46.9%
- By 2075
- 10,574,329 · +89.8%
- By 2100
- 12,109,958 · +117.4%
Race, ethnicity, and origin ACS 2023
- Neighborhood character
- Diverse neighborhood (Simpson 0.68)
- Race & ethnicity
- Black 48% White 27% Hispanic / Latino 13% Two or more races 11% Asian 8%
- Hispanic origin (detail)
- Mexican 9%
- Common ancestry
- Lithuanian 1% Romanian 1% Italian 1%
- Foreign-born
- 14% · Canada, China, South Korea
- Languages at home
- 82% English-only · Spanish 10% Chinese 2% Other Indo-European 2%
Political lean MEDSL · Harris
- 2024 margin
- Lean D (+5.5) · D 52.0% · R 46.4% · Other 1.6%
- 2008→2024 swing
- +3.9pp toward D · 2008: 1.6pp · 2024: 5.5pp
- All cycles
- 2024: D+5.5 2020: D+13.3 2016: D+12.4 2012: D+0.1 2008: D+1.6
Not yet ingested
- Civics
- —
Market trends
- HPI YoY
- ▼ -139.34%
- Current HPI
- 199.6066
- Rent YoY
- ▼ -0.32%
- Metro
- Houston-The Woodlands-Sugar Land, TX
- State GDP YoY
- ▲ 3.95%
- F500 in state
- 110
Industry mix (Fortune 500 HQ in TX)
| Industry | F500 HQs | Revenue |
|---|---|---|
| Energy | 16 | $1,198B |
|
||
| Technology | 5 | $198B |
|
||
| Engineering / Construction | 4 | $72B |
|
||
| Energy Services | 3 | $60B |
|
||
| Utilities | 3 | $41B |
|
||
| Healthcare | 2 | $330B |
|
||
Price history
-3.3% since first listed3 events — show timeline
- 2026-04-18 Price Changed $290,000 HARMLS
- 2026-02-11 Listed $300,000 HARMLS
- 1997-05-07 Sold (Public Records) — Public Records
Property tax history
+5.3%/yrLatest (2025): $7,308 · +3.0% YoY. Source: county tax records.
Cash-flow waterfall
monthlySold comps — $/sqft
last 12 mo · ≤1 miLoading sold comps…