 🏗️ New Construction
Eagle Plan · Ruskin, FL
Flood risk No data
- FEMA flood zone
- —
- Chance of flooding over 30 yrs
- —
- Est. flood insurance / yr
- —
Fire risk No data
- Est. fire insurance / yr
- —
Heat risk No data
- Hot days now (above threshold)
- —
- Hot days in 30 yrs
- —
Wind risk No data
- Chance of severe wind over 30 yrs
- —
Air-quality risk No data
- Unhealthy air days now
- —
- Unhealthy air days in 30 yrs
- —
Risk factors via First Street. Map © Google.
Why this score? — see what drove the D grade
The composite is a weighted blend of 9 inputs, each scored 0–100. Each bar is that input's sub-score; the figure is the points it added to the 100-point composite (weight × sub-score).
- Cash flow +12.3/30.0
- ARV discount +7.5/15.0
- Condition / age +4.8/5.0
- Schools +4.4/10.0
- DSCR +3.6/10.0
- Livability +3.6/5.0
- 1% rule +3.5/10.0
- Rent growth +1.8/5.0
- Appreciation +0.0/10.0
$357,999
🖨 Deal sheet (PDF) 📄 Offer letter ✓ Due diligence
Listing remarks
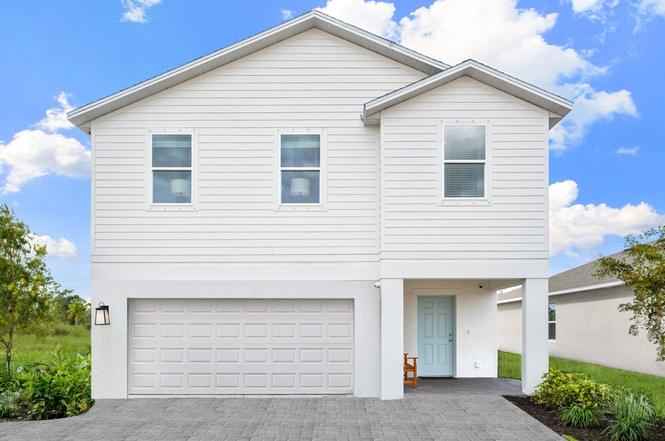
The two-story Eagle floor plan offers 2,271 square feet of thoughtfully designed, open-concept living space featuring 4 bedrooms, 2.5 bathrooms, a versatile loft, and a 2-car garage. On the first floor, you'll find a welcoming foyer that flows into a spacious great room, dining area, and modern kitchen, plus a convenient half bath. Upstairs, enjoy a flexible loft space, three secondary bedrooms, a full bathroom, and laundry room. Your private primary suite is also located upstairs and includes a spacious bathroom with dual vanity sinks, a walk-in shower, and a generous walk-in closet. To top it off, the home includes a relaxing patio for seamless indoor/outdoor living-perfect for soaking up
Key facts
- Relaxing patio
- Modern kitchen
- Versatile loft
Tags
Property features AI
Finance
- Other: List price $357,999
Exterior
- Parking: 2 covered garage spaces (2 total parking spaces)
- Home design: New construction plan named Eagle; Active listing
Interior
- Bedrooms: 4 bedrooms
- Bathrooms: 2 full bathrooms and 1 half bathroom (2.5 total)
- Interior features: Living area of 2271
Neighborhood map
What this means for you Summary
Snapshot
- This is a 4-bed/2.5-bath single-family listed at $358k. Condition is rated excellent.
Deal economics
- At list price, monthly cash flow is $-70 ($-845/yr) — negative.
- The deal already cash-flows at list — no discount required.
- To meet the 1% rule (rent ≥ 1% of price), the offer needs to be $325k (9.3% below list).
- Recommended offer: $325k (9.3% below list) — sets the bar for 1% rule.
- Cap rate 6.1% vs local median 4.7% in Ruskin — meaningfully above typical; check what's discounted (condition, days-on-market, listing class) to confirm the premium yield is real.
Location & tenants
- Location reads 71/100 on livability (#392 in FL) — a middle-class / working-renter tenant base. Strengths: cost of living A+, housing A+, commute B+; Watch: amenities F, health & safety F.
- Manatee (suburban): math 54% / reading 50% proficiency, ranked #26 of 73 in FL (top 36%) — acceptable for families but not a draw, mixed tenant base, ~2y average lease.
- Zoned schools: James Tillman Elementary Magnet School (math 65% / reading 34%, grade D, #1,088 of 2,144 statewide, top 53%, 520 students, 74% FRL); Palmetto High School (math 22% / reading 36%, grade F, #456 of 667 statewide, top 68%, 2,100 students, 61% FRL) — zoned schools average 68% FRL vs 51% district-wide (17 pts higher); higher-poverty schools than district average — tighter screening recommended.
- Zoned-school proficiency averages 39% at this address vs 52% district-wide (-13 pts) — the specific schools serving this property underperform the Manatee average; the district grade overstates school quality for this exact location.
- Market conditions: Rents soft (-3.0%/yr); 1170 active listings in the ZIP; 7 comparable units currently listed for rent nearby; rentals at typical pace (median 26d on market — plan ~3-4 weeks tenant-placement turnaround); solid renter incomes; 7,472 units permitted in Manatee County in 2024 (1,782 in 5+ unit buildings).
- At $3,248/mo this rent would consume 50% of the median local household income ($78k/yr) (locally 1193% of renters already pay >50% of income on rent) — very limited rent-growth headroom before tenants either downsize or default.
Forward outlook
- Local home prices are declining (-3.0%/yr); year-one equity from $3k of loan paydown is wiped out by about $11k of value loss. Plan a longer hold.
- Manatee County population projected at +43% by 2050 — long-run rental-demand tailwind backs the buy-and-hold thesis.
Negotiation context
- It's been on market 106 days — a 9% lower offer ($326k) is reasonable based on typical stale-listing flexibility.
Questions for the listing agent
- What do current leases actually rent for vs. the listed asking? Can we see a recent rent roll and the last 12 months of T-12 income?
- It's been on market 106 days. Have you received any prior offers? Is the seller open to a 9% concession, seller financing, or rate buy-down credit?
- Why hasn't it sold? Are there any deal-killer items the seller is aware of (foundation, flood, title, zoning, code violations)?
- Is there a deadline driving the sale (1031 exchange, divorce, estate, relocation)? That informs how much negotiation room exists.
- Schools are F-rated, which usually means shorter tenancies and higher turnover. Who's the typical renter profile here, and what's been the actual vacancy rate?
- The area grade is low — what's the realistic commute time and amenity access for the typical tenant pool here? Any planned neighborhood developments (good or bad) we should know about?
- What's the average days-on-market for RENTAL listings here right now (not sales)? A rising rental-DOM trend means longer vacancies and softer asking-rent achievability than the comps imply.
- What's the recent tenant-quality profile in this submarket — average credit score on applications, eviction rate, late-payment / NSF rate, and stable-employment percentage? A property-management company in the area should have these aggregated.
- How much new for-sale + rental construction is in the pipeline within 1–3 miles? Heavy new supply typically softens prices + rents 12–24 months out; constrained supply supports both.
Investment metrics
- 1% rule
- 0.85% ✗
- Cap rate
- 6.07%
- Cash-on-cash
- -0.79%
- DSCR
- 0.96
- GRM
- 9.8
CMA / ARV
- ARV (on-the-fly)
- $381,528
- Comps found
- 12
Show comp detail 12 sales within ~0.75 mi
| Address | Dist | Beds/Ba | Sqft | Sold | Price | $/sf | Match |
|---|---|---|---|---|---|---|---|
| 13721 Shellmore Ave | 0.21mi | 4/2.5 | 2,271 (0%) | 1mo | $364,999 | $161 | 89 |
| 13811 Shellmore Ave | 0.21mi | 4/2.5 | 2,271 (0%) | 3mo | $365,000 | $161 | 87 |
| 13509 Shellmore Ave | 0.11mi | 4/2.5 | 2,168 (-4%) | 0mo | $365,000 | $168 | 87 |
| 13431 Shellmore Ave | 0.10mi | 4/2.5 | 2,168 (-4%) | 2mo | $380,000 | $175 | 86 |
| 13407 Shellmore Ave | 0.09mi | 4/2.5 | 2,168 (-4%) | 2mo | $340,000 | $157 | 86 |
| 9324 Chiswell Trl | 0.26mi | 4/2.0 | 2,271 (0%) | 3mo | $339,000 | $149 | 83 |
| 13307 Shellmore Ave | 0.10mi | 4/3.0 | 2,190 (-4%) | 7mo | $400,000 | $183 | 82 |
| 9142 Dalera Cv | 0.21mi | 4/2.5 | 2,168 (-4%) | 3mo | $378,000 | $174 | 80 |
| 13423 Shellmore Ave | 0.10mi | 3/2.5 (-1) | 1,964 (-14%) | 2mo | $339,030 | $173 | 67 |
| 13828 Shellmore Ave | 0.21mi | 5/3.5 (+1) | 2,504 (+10%) | 0mo | $385,000 | $154 | 64 |
| 9320 Chiswell Trl | 0.26mi | 5/3.5 (+1) | 2,516 (+11%) | 0mo | $365,900 | $145 | 60 |
| 13713 Iona Ave | 0.60mi | 3/3.0 (-1) | 2,085 (-8%) | 1mo | $550,000 | $264 | 50 |
Match score weights: distance 35% · size 25% · config 20% · recency 20%. Top-matched comps best support the ARV.
Projected returns pro-forma
-3.0% appreciation · 0.0% rent growth · sell at horizon
- IRR
- -21.0%
- Equity multiple
- 0.29×
- Total profit
- $-75,782
- Equity at exit
- $56,887
- IRR
- -23.4%
- Equity multiple
- -0.01×
- Total profit
- $-108,359
- Equity at exit
- $32,988
Cash invested: $106,828 (down + closing). Projections, not guarantees.
Landlord ↔ Tenant lean methodology
- Overall (STATE)
- 87 Strongly Landlord-Friendly
- State Florida
- 87 Strongly Landlord-Friendly · R+3
- County
- — inherits STATE
- City
- — inherits STATE
ZIP-level market 34221
- Rents YoY
- -3.0%
- Active inventory
- 1170
- Price-to-rent
- 9.2×
Monthly cashflow live
- Estimated rent
- $3,248 high interval (Pro) →
- Mortgage (P&I)
- −$2,001
- Tax est. 1.5%
- −$477 /mo · $5,723/yr
- Insurance
- −$159
- HOA
- −$0
- Vacancy / Maint / Mgmt
- −$682
- Net cashflow
- $-70
Break-even live
Sensitivity live
| Price | -10% $193 | -5% $61 | +0% $-70 | +5% $-202 | +10% $-334 |
|---|---|---|---|---|---|
| Rent | -10% $-327 | -5% $-199 | +0% $-70 | +5% $58 | +10% $186 |
| Rate | -1.0pp $122 | -0.5pp $27 | base $-70 | +0.5pp $-169 | +1.0pp $-270 |
UW: 25.0% down · 7.5% · 30yr · 1.5% tax · 5.0% vac · 8.0% maint · 8.0% mgmt
Financing live
Cash to close
- Down payment
- $95,382
- Closing costs
- $11,446
- Reserves months
- —
- Total cash needed
- —
Loan-product check · same deal, 3 products live
Conventional
25% down · 7.5% · 30yr
- Down + closing
- —
- Monthly P&I
- —
- Monthly cashflow
- —
- DSCR
- —
- Eligible?
- —
Personal DTI + credit; lowest rate.
DSCR
20% down · 8.5% · 30yr
- Down + closing
- —
- Monthly P&I
- —
- Monthly cashflow
- —
- DSCR
- —
- Eligible?
- —
No personal income docs; deal must DSCR.
Hard money
10% down · 12.0% · 12mo
- Down + closing
- —
- Monthly P&I
- —
- Monthly cashflow
- —
- DSCR
- —
- Eligible?
- —
Short-term bridge; refi at stabilization.
Rent comps 7 comps
| Address | Beds | Baths | Sqft | Rent | $/sqft | DOM | Units | Dist |
|---|---|---|---|---|---|---|---|---|
| 11628 Moonsail Dr Parrish, FL | 3.0 | 2.0 | 2144 | $3,500 | $1.63 | 23d | 1 | 1.11mi |
| 11612 Armada Way Parrish, FL | 4.0 | 2.0 | 2112 | $3,400 | $1.61 | 21d | 1 | 1.19mi |
| 10749 Hidden Banks Gln Parrish, FL | 5.0 | 3.0 | 2447 | $2,549 | $1.04 | 25d | 1 | 1.31mi |
| 10826 Sapphire Breeze Cv Palmetto, FL | 4.0 | 2.0 | 1850 | $2,500 | $1.35 | 5d | 1 | 1.36mi |
| 8614 Mercator Ct Parrish, FL | 4.0 | 2.5 | 2910 | $3,300 | $1.13 | 25d | 1 | 1.40mi |
| 7518 117th Ln E Palmetto, FL | 3.0 | 3.0 | 2156 | $3,100 | $1.44 | 25d | 1 | 1.43mi |
| 10935 Gentle Current Way Parrish, FL | 5.0 | 3.0 | 2605 | $3,900 | $1.50 | 25d | 1 | 1.47mi |
Listing history 15 events
-
2026-06-22days on market $357,999 Active 106 DOM
-
2026-06-18days on market $357,999 Active 103 DOM
-
2026-06-17days on market $357,999 Active 102 DOM
-
2026-06-16days on market $357,999 Active 101 DOM
-
2026-06-15days on market $357,999 Active 100 DOM
-
2026-06-13days on market $357,999 Active 98 DOM
-
2026-06-13days on market $357,999 Active 97 DOM
-
2026-06-10days on market $357,999 Active 95 DOM
-
2026-06-09days on market $357,999 Active 94 DOM
-
2026-06-08days on market $357,999 Active 93 DOM
-
2026-06-08days on market $357,999 Active 92 DOM
-
2026-06-03days on market $357,999 Active 88 DOM
-
2026-06-02days on market $357,999 Active 87 DOM
-
2026-06-01days on market $357,999 Active 86 DOM
-
2026-05-31days on market $357,999 Active 85 DOM
ⓘ Source: listings_history table (triggers on properties + properties_extension) + one-shot
backfill from property_details.listing_events for pre-trigger history.
Nearby sold comps map
Loading sold comps map…
Walkable amenities ~0.75 mi
Loading nearby amenities…
Taxation est. · year 1
- Rental income
- $38,980
- − Mortgage interest
- −$21,371
- − Property taxes
- −$5,723
- − Insurance
- −$1,908
- − Repairs & maintenance
- −$3,118
- − Management
- −$3,118
- − Depreciation
- −$11,099
- Taxable loss
- −$7,358
- Est. tax savings @ 24.0%
- +$1,766
- After-tax cash flow
- $920/yr
For passive investors: Depreciation is non-cash, so a rental often shows a tax loss while cash-flowing — sheltering income. Rental losses are passive: they offset passive income freely, and up to $25,000/yr can offset ordinary (W-2) income if you actively participate and your MAGI is under $100k (phasing out to $0 by $150k); unused losses carry forward. On sale, claimed depreciation is recaptured at up to 25%, and gains may owe capital-gains tax (a 1031 exchange can defer both). Figures are a year-1 estimate at your 24.0% rate — not tax advice; consult a CPA.
Condition & rehab AI · 13 photos
This two-story home is in excellent condition with no visible repairs needed. It offers a well-maintained exterior, interior, and landscaping, making it a great investment opportunity.
Value-add opportunities
- Both Painting the exterior siding — Enhances curb appeal and value
- Both Landscaping improvements — Enhances curb appeal and value
- Both Interior touch-ups — Enhances interior aesthetics and value
Renovation cost estimate screening
Value-add ROI direction
- Both Painting the exterior siding — Enhances curb appeal and value ↑
- Both Landscaping improvements — Enhances curb appeal and value ↑
- Both Interior touch-ups — Enhances interior aesthetics and value ↑
ⓘ Cost ranges are severity-bucket heuristics (US national rule-of-thumb). Get contractor quotes + a written scope before underwriting a rehab budget.
Schools (NCES district)
- District
- Manatee
- NCES district ID
- 1201230
- Math proficiency
- 54% ▼ -6.00%
- Reading proficiency
- 50% ▼ -2.00%
- Median HH income
- $49,607
- Composite
- 44.43/100
- National rank
- #2806
- State rank
- #26 of 73 in FL
Livability — Ruskin
- Score
- 71/100
- State rank
- #392
- US rank
- #6879
Category grades
Schools grade is shown separately in the Schools card above.
Census & demographics
- County
- Manatee County · 416,364 people
- City population
- 33,319
- Metro
- North Port-Sarasota-Bradenton, FL
- Population (ZIP)
- 56,208
- Household income
- $77,712
- Rent vs Own
- Severe rent burden
- 1193.0
Population outlook (Manatee County) Hauer SSP2
- Today (2025)
- 447,342 people
- By 2030
- 488,911 · +9.3%
- By 2040
- 567,934 · +27.0%
- By 2050
- 637,995 · +42.6%
- By 2075
- 781,970 · +74.8%
- By 2100
- 848,272 · +89.6%
Race, ethnicity, and origin ACS 2023
- Neighborhood character
- Diverse neighborhood (Simpson 0.58)
- Race & ethnicity
- White 59% Hispanic / Latino 22% Black 14% Two or more races 11%
- Hispanic origin (detail)
- Mexican 14% Puerto Rican 3%
- Common ancestry
- Romanian 2% Lithuanian 2% Italian 2%
- Foreign-born
- 10% · Canada, Dominican Republic, Jamaica
- Languages at home
- 81% English-only · Spanish 16% Other Indo-European 1%
Political lean MEDSL · Manatee
- 2024 margin
- Strong R (+23.5) · D 37.9% · R 61.4%
- 2008→2024 swing
- -16.5pp toward R · 2008: -7.0pp · 2024: -23.5pp
- All cycles
- 2024: R+23.5 2020: R+16.1 2016: R+17.1 2012: R+12.5 2008: R+7.0
Not yet ingested
- Civics
- —
Market trends
- HPI YoY
- ▼ -383.53%
- Current HPI
- 302.1458
- Rent YoY
- ▼ -2.98%
- Metro
- North Port-Sarasota-Bradenton, FL
- State GDP YoY
- ▲ 3.28%
- F500 in state
- 36
Industry mix (Fortune 500 HQ in FL)
| Industry | F500 HQs | Revenue |
|---|---|---|
| Industrial Technology | 2 | $29B |
|
||
| Insurance | 2 | $17B |
|
||
| Retail | 1 | $60B |
|
||
| Technology Distribution | 1 | $58B |
|
||
| Homebuilding | 1 | $35B |
|
||
| Technology Manufacturing | 1 | $35B |
|
||
Cash-flow waterfall
monthlySold comps — $/sqft
last 12 mo · ≤1 miLoading sold comps…