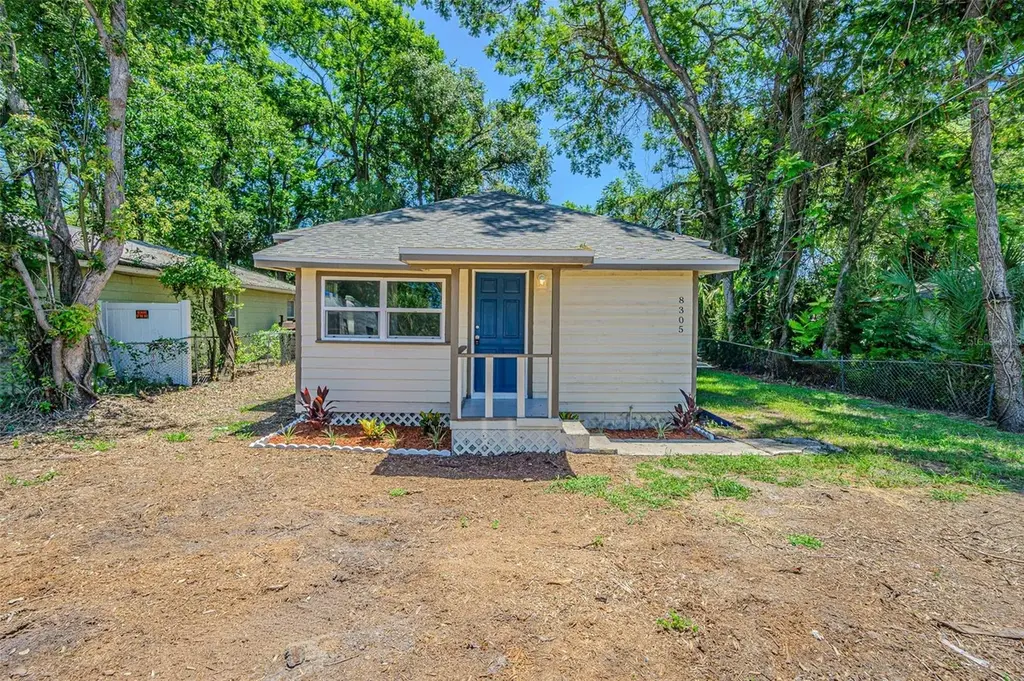
8305 N Klondyke St · Tampa, FL
Flood risk 1/10 · Minimal
- FEMA flood zone
- X (unshaded)
- Chance of flooding over 30 yrs
- 0.0%
- Est. flood insurance / yr
- $507 – $1,088
Fire risk 1/10 · Minimal
- Est. fire insurance / yr
- $947 – $1,759
Heat risk 10/10 · Severe
- Hot days now (above 108°F)
- 7 days/yr
- Hot days in 30 yrs
- 27 days/yr
Wind risk 9/10 · Severe
- Chance of severe wind over 30 yrs
- 99.0%
Air-quality risk 3/10 · Minor
- Unhealthy air days now
- 3 days/yr
- Unhealthy air days in 30 yrs
- 4 days/yr
Risk factors via First Street. Map © Google.
Why this score? — see what drove the D grade
The composite is a weighted blend of 9 inputs, each scored 0–100. Each bar is that input's sub-score; the figure is the points it added to the 100-point composite (weight × sub-score).
- Cash flow +15.4/30.0
- ARV discount +7.5/15.0
- DSCR +4.7/10.0
- Schools +4.2/10.0
- Livability +4.0/5.0
- 1% rule +3.4/10.0
- Rent growth +2.6/5.0
- Condition / age +2.5/5.0
- Appreciation +0.0/10.0
$199,900
🖨 Deal sheet (PDF) 📄 Offer letter ✓ Due diligence
Listing remarks MLS
Short Sale - subject to 3rd Party Approval. PRICE REDUCED!! Handyman special on this two bedroom bungalow. Home does need work. Cash offers only.
Key facts
- Renovated bungalow
- Updated kitchen
- Large walk-in closet
Tags
Property features AI
Finance
- Other: Residential zoning RS-50
- HOA & community: No association (N/A)
Exterior
- Parking: Garage (laundry located in garage)
- Utilities: Public water; Public sewer; High-speed internet available; Electricity connected; Water connected
- Home design: Single-family residence; One story; Faces west; Entry level: One
- Construction: Frame construction; Shingle roof; Crawlspace foundation; Built on approximately 0.11 acre lot
- Exterior features: Front porch; Private mailbox; Shed(s); Trees and landscaped yard; Paved, public-maintained road access; Lot dimensions approximately 50 x 100
Interior
- Kitchen: Dishwasher; Microwave; Range; Refrigerator; Electric water heater
- Bedrooms: 2 bedrooms
- Bathrooms: 1 full bathroom
- Heating & cooling: Central heating; Heat pump; Central air conditioning
- Interior features: Ceiling fans; Walk-in closet(s); Crawl space
- Laundry & utility: Laundry area in garage
Neighborhood map
What this means for you Summary
Snapshot
- This is a 2-bed/1.0-bath single-family listed at $200k.
Deal economics
- At list price, monthly cash flow is $76 ($907/yr) — positive.
- The deal already cash-flows at list — no discount required.
- To meet the 1% rule (rent ≥ 1% of price), the offer needs to be $168k (16.0% below list).
- Recommended offer: $168k (16.0% below list) — sets the bar for 1% rule.
Location & tenants
- Location reads 79/100 on livability (#142 in FL, #2,135 nationally) — a middle-class / working-renter tenant base. Strengths: commute A+, housing A+, health & safety A+; Watch: crime D+.
- Hillsborough (suburban): math 47% / reading 50% proficiency, ranked #41 of 73 in FL (top 56%) — families likely to look elsewhere, expect single-tenant / working-renter base with shorter leases.
- Zoned schools: Sulphur Springs K-8 School (math 20% / reading 18%, grade F, #2,111 of 2,144 statewide, top 99%, 610 students, 88% FRL); Sligh Middle School (math 16% / reading 22%, grade F, #564 of 571 statewide, top 99%, 606 students, 84% FRL); Chamberlain High School (math 20% / reading 23%, grade F, #546 of 667 statewide, top 82%, 1,262 students, 72% FRL) — zoned schools average 82% FRL vs 52% district-wide (30 pts higher); higher-poverty schools than district average — tighter screening recommended.
- Zoned-school proficiency averages 20% at this address vs 48% district-wide (-29 pts) — the specific schools serving this property underperform the Hillsborough average; the district grade overstates school quality for this exact location.
- Market conditions: Rents flat; 374 active listings in the ZIP; 40 comparable units currently listed for rent nearby; rentals at typical pace (median 20d on market — plan ~3-4 weeks tenant-placement turnaround); 9,053 units permitted in Hillsborough County in 2024 (4,555 in 5+ unit buildings).
- This rent runs 34% of the median local income ($59k/yr) — at the standard rent-burdened threshold; future hikes will face affordability resistance.
Forward outlook
- Local home prices are declining (-3.0%/yr); year-one equity from $1k of loan paydown is wiped out by about $6k of value loss. Plan a longer hold.
- Hillsborough County population projected at +37% by 2050 — long-run rental-demand tailwind backs the buy-and-hold thesis.
Negotiation context
- Only 6 days on market — expect competitive offers; lowballing is unlikely to land.
- 7 sale attempts since 20y ago with the ask held roughly flat each time — persistent listings suggest the price (not the market) is what's stuck; bring a comps-based counter.
- Current owner paid $28k; list at $200k implies a 601% gain — meaningful room to come down on a strong offer.
Risks & watch-outs
- Watch-outs: built in 1941 — expect roof / HVAC / electrical / plumbing capex.
- Climate carrying-cost: severe wind risk, 99% chance of damaging wind over 30y; extreme-heat days projected 7→27/yr by 2055 (HVAC capex compounding) — expect insurance premiums to compound above CPI over the hold.
Questions for the listing agent
- Built in 1941 — when were the roof, HVAC, electrical panel, plumbing, and water heater last replaced?
- Is there a deadline driving the sale (1031 exchange, divorce, estate, relocation)? That informs how much negotiation room exists.
- Crime grade is D in this area — have there been break-ins, vandalism, or insurance claims at this property in the last 3 years? What carrier currently insures it and at what premium?
- The area grade is low — what's the realistic commute time and amenity access for the typical tenant pool here? Any planned neighborhood developments (good or bad) we should know about?
- What's the average days-on-market for RENTAL listings here right now (not sales)? A rising rental-DOM trend means longer vacancies and softer asking-rent achievability than the comps imply.
- What's the recent tenant-quality profile in this submarket — average credit score on applications, eviction rate, late-payment / NSF rate, and stable-employment percentage? A property-management company in the area should have these aggregated.
- How much new for-sale + rental construction is in the pipeline within 1–3 miles? Heavy new supply typically softens prices + rents 12–24 months out; constrained supply supports both.
Investment metrics
- 1% rule
- 0.84% ✗
- Cap rate
- 6.75%
- Cash-on-cash
- 1.62%
- DSCR
- 1.07
- GRM
- 9.9
CMA / ARV
No comps found within radius.
Projected returns pro-forma
-3.0% appreciation · 0.52% rent growth · sell at horizon
- IRR
- -16.3%
- Equity multiple
- 0.43×
- Total profit
- $-31,722
- Equity at exit
- $29,806
- IRR
- -12.7%
- Equity multiple
- 0.33×
- Total profit
- $-37,614
- Equity at exit
- $17,284
Cash invested: $55,972 (down + closing). Projections, not guarantees.
Landlord ↔ Tenant lean methodology
- Overall (STATE)
- 87 Strongly Landlord-Friendly
- State Florida
- 87 Strongly Landlord-Friendly · R+3
- County
- — inherits STATE
- City
- — inherits STATE
ZIP-level market 33604
- Home prices YoY
- -31.3%
- Rents YoY
- 0.5%
- Active inventory
- 374
- Price-to-rent
- 9.9×
Monthly cashflow live
- Estimated rent
- $1,680 high interval (Pro) →
- Mortgage (P&I)
- −$1,048
- Tax from tax record
- −$120 /mo · $1,437/yr
- Insurance
- −$83
- HOA
- −$0
- Lot rent
- −$0
- Vacancy / Maint / Mgmt
- −$353
- Net cashflow
- $76
Break-even live
Sensitivity live
| Price | -10% $189 | -5% $132 | +0% $76 | +5% $19 | +10% $-38 |
|---|---|---|---|---|---|
| Rent | -10% $-57 | -5% $9 | +0% $76 | +5% $142 | +10% $208 |
| Rate | -1.0pp $176 | -0.5pp $126 | base $76 | +0.5pp $24 | +1.0pp $-29 |
UW: 25.0% down · 7.5% · 30yr · 1.5% tax · 5.0% vac · 8.0% maint · 8.0% mgmt
Financing live
Cash to close
- Down payment
- $49,975
- Closing costs
- $5,997
- Reserves months
- —
- Total cash needed
- —
Loan-product check · same deal, 3 products live
Conventional
25% down · 7.5% · 30yr
- Down + closing
- —
- Monthly P&I
- —
- Monthly cashflow
- —
- DSCR
- —
- Eligible?
- —
Personal DTI + credit; lowest rate.
DSCR
20% down · 8.5% · 30yr
- Down + closing
- —
- Monthly P&I
- —
- Monthly cashflow
- —
- DSCR
- —
- Eligible?
- —
No personal income docs; deal must DSCR.
Hard money
10% down · 12.0% · 12mo
- Down + closing
- —
- Monthly P&I
- —
- Monthly cashflow
- —
- DSCR
- —
- Eligible?
- —
Short-term bridge; refi at stabilization.
Rent comps 40 comps
| Address | Beds | Baths | Sqft | Rent | $/sqft | DOM | Units | Dist |
|---|---|---|---|---|---|---|---|---|
| 8304 N Mulberry St Tampa, FL | 3.0 | 1.0 | 858 | $1,650 | $1.92 | 7d | 1 | 0.08mi |
| 8210 N 13th St Tampa, FL | 2.0 | 1.0 | 995 | $1,895 | $1.90 | 7d | 1 | 0.12mi |
| 8117 N Mulberry St Unit B Tampa, FL | 3.0 | 1.0 | 800 | $1,789 | $2.24 | 1d | 1 | 0.16mi |
| 8117 N Mulberry St Unit B Tampa, FL | 3.0 | 1.0 | 800 | $2,750 | $3.44 | 24d | 1 | 0.16mi |
| 8105 N Klondyke St Unit A- Tampa, FL | 2.0 | 1.0 | 720 | $1,200 | $1.67 | 5d | 1 | 0.17mi |
| 8416 N Brooks St Tampa, FL | 3.0 | 2.0 | 1090 | $1,900 | $1.74 | 13d | 1 | 0.18mi |
| 8105 N 12th St Tampa, FL | 2.0 | 1.0 | 874 | $1,650 | $1.89 | 26d | 1 | 0.21mi |
| 8506 N Brooks St Unit A Tampa, FL | 3.0 | 1.0 | 1004 | $1,950 | $1.94 | 13d | 1 | 0.25mi |
| 8419 N Semmes St Tampa, FL | 3.0 | 1.0 | 864 | $1,750 | $2.03 | 26d | 1 | 0.27mi |
| 8118 N Alaska St Tampa, FL | 2.0 | 1.0 | 700 | $1,500 | $2.14 | 5d | 1 | 0.27mi |
| 8213 N 17th St Tampa, FL | 3.0 | 1.0 | 880 | $1,800 | $2.05 | 26d | 1 | 0.27mi |
| 8218 N Elmer St Unit B Tampa, FL | 2.0 | 1.0 | 756 | $1,400 | $1.85 | 26d | 1 | 0.30mi |
| 8307 N Elmer St Tampa, FL | 3.0 | 1.0 | 1030 | $1,919 | $1.86 | 5d | 1 | 0.32mi |
| 7903 N 13th St Tampa, FL | 2.0 | 1.0 | 648 | $1,199 | $1.85 | 7d | 1 | 0.33mi |
| 8004 N Alaska St Tampa, FL | 2.0 | 1.0 | 844 | $1,595 | $1.89 | 26d | 1 | 0.36mi |
| 1709 E Idell St Unit B Tampa, FL | 3.0 | 1.0 | 857 | $1,500 | $1.75 | 5d | 1 | 0.39mi |
| 1809 E Sitka St Tampa, FL | 3.0 | 2.0 | 1115 | $1,840 | $1.65 | 17d | 1 | 0.41mi |
| 1726 E Idell St Unit B Tampa, FL | 1.0 | 1.0 | 702 | $1,400 | $1.99 | 7d | 1 | 0.44mi |
| 1607 E Maple Ave Tampa, FL | 3.0 | 2.0 | 1061 | $1,500 | $1.41 | 26d | 1 | 0.44mi |
| 1607 E Maple Ave Tampa, FL | 3.0 | 2.0 | 1061 | $1,500 | $1.41 | 24d | 1 | 0.44mi |
| 8619 N Mulberry St Unit A Tampa, FL | 2.0 | 1.0 | 742 | $1,350 | $1.82 | 26d | 1 | 0.45mi |
| 1500 E Humphrey St Tampa, FL | 2.0 | 1.5–2.0 | 858 | $1,772 | $2.07 | 26d | 1 | 0.46mi |
| 1503 E Humphrey St Apt D Tampa, FL | 2.0 | 1.5 | 850 | $1,750 | $2.06 | 26d | 1 | 0.47mi |
| 1505 E Humphrey St Apt A Tampa, FL | 2.0 | 1.5 | 850 | $1,750 | $2.06 | 26d | 1 | 0.48mi |
| 1508 E Humphrey St Apt B Tampa, FL | 2.0 | 1.5 | 850 | $1,750 | $2.06 | 26d | 1 | 0.48mi |
| 1502 E Humphrey St Apt C Tampa, FL | 2.0 | 1.5 | 850 | $1,750 | $2.06 | 26d | 1 | 0.48mi |
| 1504 E Humphrey St Apt D Tampa, FL | 2.0 | 1.5 | 850 | $1,750 | $2.06 | 26d | 1 | 0.49mi |
| 1601 E Marks Dr Tampa, FL | 2.0 | 1.0 | 700 | $1,490 | $2.13 | 26d | 1 | 0.50mi |
| 1506 E Humphrey St Apt B Tampa, FL | 2.0 | 1.5 | 850 | $1,750 | $2.06 | 26d | 1 | 0.50mi |
| 8618 N 20th St Tampa, FL | 3.0 | 2.0 | 1064 | $2,011 | $1.89 | 7d | 1 | 0.59mi |
| 714 E Hollywood St Tampa, FL | 1.0 | 1.0 | 750 | $1,495 | $1.99 | 20d | 1 | 0.61mi |
| 708 E Hollywood St Tampa, FL | 1.0 | 1.0 | 675 | $1,400 | $2.07 | 7d | 1 | 0.63mi |
| 708 E Hollywood St Unit 708-1 Tampa, FL | 1.0 | 1.0 | 675 | $1,400 | $2.07 | 16d | 1 | 0.63mi |
| 708 E Hollywood St Unit 714-6 Tampa, FL | 1.0 | 1.0 | 750 | $1,495 | $1.99 | 20d | 1 | 0.63mi |
| 8505 N Lamar Ave Unit C Tampa, FL | 1.0 | 1.0 | 910 | $1,350 | $1.48 | 1d | 1 | 0.64mi |
| 8505 N Lamar Ave Unit C Tampa, FL | 1.0 | 1.0 | 910 | $1,499 | $1.65 | 7d | 1 | 0.64mi |
| 7717 N Huntley Ave Tampa, FL | 2.0 | 1.0 | 692 | $1,425 | $2.06 | 6d | 1 | 0.67mi |
| 7707 N Huntley Ave Unit 7707-5 Tampa, FL | 2.0 | 1.0 | 655 | $1,325 | $2.02 | 26d | 1 | 0.68mi |
| 2014 E Humphrey St Tampa, FL | 3.0 | 1.0 | 880 | $1,690 | $1.92 | 13d | 1 | 0.74mi |
| 1909 E Crenshaw St Unit Crenshaw B Tampa, FL | 1.0 | 1.0 | 750 | $1,600 | $2.13 | 26d | 1 | 0.75mi |
Listing history 5 events
-
2026-06-15statusdays on market $199,900 Pending 6 DOM
-
2026-06-13days on market $199,900 Active 5 DOM
-
2026-06-13days on market $199,900 Active 4 DOM
-
2026-06-08remarks 699-char remark
-
2026-06-08$199,900 Active 1 DOM
ⓘ Source: listings_history table (triggers on properties + properties_extension) + one-shot
backfill from property_details.listing_events for pre-trigger history.
Tax reassessment forecast FL · Resets to sale price
- Current annual tax
- $1,437 · $120/mo
- Projected year-2 tax
- $1,659 · $138/mo
- Expected delta
- +$222/yr (+$19/mo · 15.5%)
ⓘ Screening estimate from a state-policy table — verify with the county assessor before closing.
Climate risk First Street
- Flood 1/10 Low FEMA zone X (unshaded) · 0% chance over 30 yrs
- Wildfire 1/10 Low
- Heat 10/10 Extreme 7 d/yr ≥108°F today · 27 d/yr by 30 yrs out
- Wind 9/10 Extreme 99% chance of damaging wind over 30 yrs
- Air quality 3/10 Moderate 3 unhealthy d/yr today · 4 by 30 yrs out
Nearby sold comps map
Loading sold comps map…
Walkable amenities ~0.75 mi
Loading nearby amenities…
Taxation est. · year 1
- Rental income
- $20,156
- − Mortgage interest
- −$11,198
- − Property taxes
- −$1,437
- − Insurance
- −$1,000
- − Repairs & maintenance
- −$1,612
- − Management
- −$1,612
- − Depreciation
- −$5,815
- Taxable loss
- −$2,518
- Est. tax savings @ 24.0%
- +$604
- After-tax cash flow
- $1,512/yr
For passive investors: Depreciation is non-cash, so a rental often shows a tax loss while cash-flowing — sheltering income. Rental losses are passive: they offset passive income freely, and up to $25,000/yr can offset ordinary (W-2) income if you actively participate and your MAGI is under $100k (phasing out to $0 by $150k); unused losses carry forward. On sale, claimed depreciation is recaptured at up to 25%, and gains may owe capital-gains tax (a 1031 exchange can defer both). Figures are a year-1 estimate at your 24.0% rate — not tax advice; consult a CPA.
Schools (NCES district)
- District
- Hillsborough
- NCES district ID
- 1200870
- Math proficiency
- 47% ▼ -8.00%
- Reading proficiency
- 50% ▼ -4.00%
- Median HH income
- $50,622
- Composite
- 41.6/100
- National rank
- #3435
- State rank
- #41 of 73 in FL
Livability — Tampa
- Score
- 79/100
- State rank
- #142
- US rank
- #2135
Category grades
Schools grade is shown separately in the Schools card above.
Census & demographics
- Census place
- Tampa, FL
- County
- Hillsborough County · 1,540,968 people
- City population
- 523,346
- Metro
- Tampa-St. Petersburg-Clearwater, FL
- Population (ZIP)
- 40,055
- Household income
- $58,766
- Rent vs Own
- Severe rent burden
- 2581.0
Population outlook (Hillsborough County) Hauer SSP2
- Today (2025)
- 1,607,022 people
- By 2030
- 1,733,968 · +7.9%
- By 2040
- 1,979,565 · +23.2%
- By 2050
- 2,203,427 · +37.1%
- By 2075
- 2,667,893 · +66.0%
- By 2100
- 2,891,558 · +79.9%
Race, ethnicity, and origin ACS 2023
- Neighborhood character
- Diverse neighborhood (Simpson 0.69)
- Race & ethnicity
- Hispanic / Latino 38% White 35% Two or more races 22% Black 21% Asian 2%
- Hispanic origin (detail)
- Mexican 3% Puerto Rican 11% Cuban 13% Dominican 2%
- Common ancestry
- Romanian 3% Lithuanian 2% Slovak 1%
- Foreign-born
- 18% · Canada, Vietnam, Jamaica
- Languages at home
- 66% English-only · Spanish 30% Vietnamese 1% French/Haitian/Cajun 1%
Political lean MEDSL · Hillsborough
- 2024 margin
- Toss-up / Even · D 47.8% · R 50.9% · Other 1.3%
- 2008→2024 swing
- -10.2pp toward R · 2008: 7.1pp · 2024: -3.1pp
- All cycles
- 2024: R+3.1 2020: D+6.9 2016: D+6.8 2012: D+6.7 2008: D+7.1
Not yet ingested
- Civics
- —
Market trends
- HPI YoY
- ▼ -200.24%
- Current HPI
- 439.7084
- Rent YoY
- ▲ 0.52%
- Metro
- Tampa-St. Petersburg-Clearwater, FL
- State GDP YoY
- ▲ 3.28%
- F500 in state
- 36
Industry mix (Fortune 500 HQ in FL)
| Industry | F500 HQs | Revenue |
|---|---|---|
| Industrial Technology | 2 | $29B |
|
||
| Insurance | 2 | $17B |
|
||
| Retail | 1 | $60B |
|
||
| Technology Distribution | 1 | $58B |
|
||
| Homebuilding | 1 | $35B |
|
||
| Technology Manufacturing | 1 | $35B |
|
||
Price history
+3231.7% since first listed22 events — show timeline
- 2026-06-08 Listed $199,900 Stellar MLS as Distributed by MLS Grid
- 2015-02-13 Sold (Public Records) $28,500 Public Records
- 2015-01-09 Sold (MLS) $18,500 Stellar MLS as Distributed by MLS Grid
- 2014-12-24 Pending — Stellar MLS as Distributed by MLS Grid
- 2014-11-04 Contingent — Stellar MLS as Distributed by MLS Grid
- 2014-10-29 Relisted — Stellar MLS as Distributed by MLS Grid
- 2014-10-23 Contingent — Stellar MLS as Distributed by MLS Grid
- 2014-10-17 Price Changed $20,700 Stellar MLS as Distributed by MLS Grid
- 2014-10-08 Price Changed $22,700 Stellar MLS as Distributed by MLS Grid
- 2014-08-28 Price Changed $27,700 Stellar MLS as Distributed by MLS Grid
- 2014-08-12 Price Changed $29,900 Stellar MLS as Distributed by MLS Grid
- 2014-07-29 Listed $34,900 Stellar MLS as Distributed by MLS Grid
- 2007-11-20 Sold (Public Records) $61,000 Public Records
- 2007-11-12 Sold (MLS) $61,296 Stellar MLS as Distributed by MLS Grid
- 2007-08-15 Listed $68,125 Stellar MLS as Distributed by MLS Grid
- 2007-04-20 Listing Removed — Stellar MLS as Distributed by MLS Grid
- 2007-01-06 Listed $134,900 Stellar MLS as Distributed by MLS Grid
- 2006-08-02 Listed $139,000 Stellar MLS as Distributed by MLS Grid
- 2006-05-18 Sold (Public Records) $124,000 Public Records
- 2006-04-01 Listing Removed — Stellar MLS as Distributed by MLS Grid
- 2006-02-12 Listed $110,000 Stellar MLS as Distributed by MLS Grid
- 1998-04-09 Sold (Public Records) $6,000 Public Records
Property tax history
+12.7%/yrLatest (2025): $1,437 · +14.4% YoY. Source: county tax records.
Cash-flow waterfall
monthlySold comps — $/sqft
last 12 mo · ≤1 miLoading sold comps…