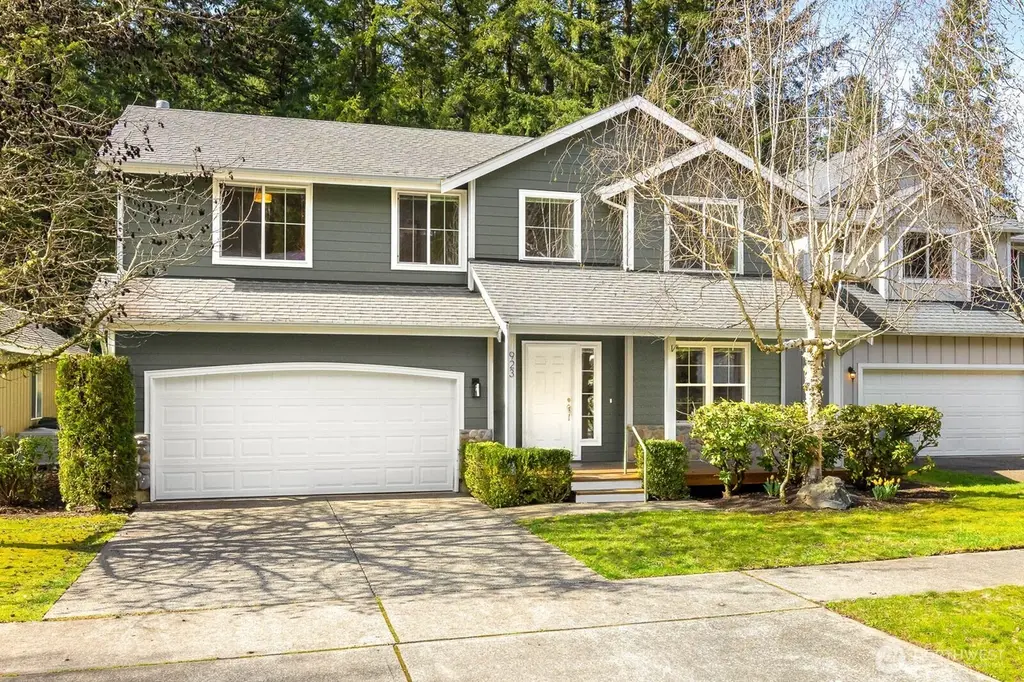
923 Sarah Ct NW · Olympia, WA
Flood risk 1/10 · Minimal
- FEMA flood zone
- X (unshaded)
- Chance of flooding over 30 yrs
- 0.0%
- Est. flood insurance / yr
- $507 – $1,088
Fire risk 3/10 · Minor
- Est. fire insurance / yr
- $604 – $1,122
Heat risk 3/10 · Minor
- Hot days now (above 88°F)
- 7 days/yr
- Hot days in 30 yrs
- 14 days/yr
Wind risk 1/10 · Minimal
- Chance of severe wind over 30 yrs
- —
Air-quality risk 6/10 · Moderate
- Unhealthy air days now
- 6 days/yr
- Unhealthy air days in 30 yrs
- 7 days/yr
Risk factors via First Street. Map © Google.
Why this score? — see what drove the D grade
The composite is a weighted blend of 9 inputs, each scored 0–100. Each bar is that input's sub-score; the figure is the points it added to the 100-point composite (weight × sub-score).
- ARV discount +10.5/15.0
- Appreciation +10.0/10.0
- Schools +6.2/10.0
- Cash flow +4.3/30.0
- Livability +4.2/5.0
- Rent growth +3.3/5.0
- Condition / age +2.5/5.0
- 1% rule +0.0/10.0
- DSCR +0.0/10.0
$535,000
🖨 Deal sheet (PDF) 📄 Offer letter ✓ Due diligence
Listing remarks
Set in a peaceful cul-de-sac in a sought-after West Olympia neighborhood, this inviting home offers the comfort of main-level living with plenty of space to grow. Fresh interior paint, brand-new carpet, and updated interior and exterior lighting create a bright, clean, and welcoming feel throughout. Major systems have been thoughtfully maintained, including a recently serviced HVAC system and newer water heater for added peace of mind. The spacious main-floor primary suite features a walk-in closet and private ensuite with a relaxing soaking tub. Natural light pours into two generous living spaces, adding warmth and comfort to everyday living. Upstairs, you’ll find three large bedroom
Key facts
- Newer water heater
- Cul-de-sac
- Main-level living
Tags
Property features AI
Finance
- Other: Located on a level lot in a cul-de-sac with curbs, sidewalks and paved streets; Bus route nearby (Route 48)
- Financial info: Financing available: Cash, Conventional, FHA, VA
- HOA & community: HOA with annual fee of $300 (covers common area maintenance); Community governed by CCRs
Exterior
- Parking: Attached garage with 2 covered spaces (approx. 400 sq ft)
- Security: Fully fenced
- Utilities: Natural gas; Public water; Sewer connected; PSE power; Xfinity cable and internet
- Home design: Single-family residence; Two-story; Entry at main level; Built on lot; Has a view; Good condition
- Construction: Built in 2003 (effective year); Wood construction; Composition roof; Poured concrete foundation
- Exterior features: Wood exterior; Wood products; Deck; Patio; Fenced — fully fenced yard; Garden space; Cable TV and high-speed internet available; Gas available
Interior
- Kitchen: Dishwasher; Garbage disposal; Microwave; Refrigerator; Stove/Range
- Bedrooms: 4 bedrooms total — 3 upstairs, 1 on main level
- Flooring: Vinyl; Carpet
- Bathrooms: 2 full bathrooms; 1 half bathroom; 2 bathtubs; 2 showers; 2 bathrooms on the main level
- Heating & cooling: Forced air heating; No central cooling
- Interior features: Dining room; Pantry; Walk-in closets; Water heater (located in garage)
- Laundry & utility: Washer; Dryer; Gas water heater (in garage)
Neighborhood map
What this means for you Summary
Snapshot
- This is a 4-bed/2.5-bath single-family listed at $535k.
Deal economics
- At list price, monthly cash flow is $-1k ($-17k/yr) — negative.
- To cash-flow at today's rent, offer at most $281k (47.4% below list).
- To meet the 1% rule (rent ≥ 1% of price), the offer needs to be $262k (51.1% below list).
- Recommended offer: $262k (51.1% below list) — sets the bar for 1% rule.
- Cap rate 3.1% vs local median 2.4% in Olympia — meaningfully above typical; check what's discounted (condition, days-on-market, listing class) to confirm the premium yield is real.
Location & tenants
- Location reads 83/100 on livability (#58 in WA, #1,036 nationally) — a professional / high-income tenant draw. Strengths: amenities A+, commute A+, health & safety A+; Watch: crime F, cost of living D-.
- Olympia School District (urban): math 66% / reading 75% proficiency, ranked #17 of 291 in WA (top 6%) — strong family-tenant draw, lease renewals of 3-5y typical.
- Zoned schools: Garfield Elementary School (351 students, 65% FRL); Jefferson Middle School (447 students, 54% FRL); Capital High School (1,326 students, 38% FRL) — zoned schools average 52% FRL vs 25% district-wide (27 pts higher); higher-poverty schools than district average — tighter screening recommended.
- Market conditions: Rents rising (+3.2%/yr); 306 active listings in the ZIP; 7 comparable units currently listed for rent nearby; rentals lingering (median 46d on market — plan ~5-8 weeks vacancy on turnover, expect pricing pressure); 71% of comp listings sitting > 30 days — soft ceiling on asking rent; solid renter incomes; 1,222 units permitted in Thurston County in 2024 (508 in 5+ unit buildings).
- This rent runs 34% of the median local income ($92k/yr) — at the standard rent-burdened threshold; future hikes will face affordability resistance.
Forward outlook
- In year one you build about $57k of equity ($4k loan paydown + $54k appreciation (10.0% local appreciation)).
- Thurston County population projected at +27% by 2050 — long-run rental-demand tailwind backs the buy-and-hold thesis.
- By year 2, paydown + projected appreciation supports a ~$92k cash-out refi (75% LTV) — recoverable capital for the next deal without selling this one.
Negotiation context
- Only 13 days on market — expect competitive offers; lowballing is unlikely to land.
- 2 sale attempts since 24y ago with the ask held roughly flat each time — persistent listings suggest the price (not the market) is what's stuck; bring a comps-based counter.
- Current owner paid $230k; list at $535k implies a 133% gain — meaningful room to come down on a strong offer.
Questions for the listing agent
- What do current leases actually rent for vs. the listed asking? Can we see a recent rent roll and the last 12 months of T-12 income?
- What does the HOA fee cover, when was the last increase, and are there any pending special assessments or reserve-fund shortfalls?
- Is there a deadline driving the sale (1031 exchange, divorce, estate, relocation)? That informs how much negotiation room exists.
- Schools are A-rated — typically a magnet for longer-tenancy family renters. What's the average tenant stay here, and is there a school-zone premium baked into asking?
- Crime grade is F in this area — have there been break-ins, vandalism, or insurance claims at this property in the last 3 years? What carrier currently insures it and at what premium?
- The area grade is low — what's the realistic commute time and amenity access for the typical tenant pool here? Any planned neighborhood developments (good or bad) we should know about?
- What's the average days-on-market for RENTAL listings here right now (not sales)? A rising rental-DOM trend means longer vacancies and softer asking-rent achievability than the comps imply.
- What's the recent tenant-quality profile in this submarket — average credit score on applications, eviction rate, late-payment / NSF rate, and stable-employment percentage? A property-management company in the area should have these aggregated.
- How much new for-sale + rental construction is in the pipeline within 1–3 miles? Heavy new supply typically softens prices + rents 12–24 months out; constrained supply supports both.
Investment metrics
- 1% rule
- 0.49% ✗
- Cap rate
- 3.07%
- Cash-on-cash
- -11.51%
- DSCR
- 0.49
- GRM
- 17.0
CMA / ARV
- ARV (median comp)
- $573,195
- List price
- $535,000
- Delta
- -6.66%
- Verdict
- FAIR
- Comps
- 20 within 1.0 mi
Show comp detail 12 sales within ~0.75 mi
| Address | Dist | Beds/Ba | Sqft | Sold | Price | $/sf | Match |
|---|---|---|---|---|---|---|---|
| 821 Sarah Ct NW | 0.05mi | 3/2.5 (-1) | 2,076 (+5%) | 9mo | $494,000 | $238 | 77 |
| 1615 Easthill Ct NW | 0.45mi | 3/2.0 (-1) | 1,999 (+1%) | 2mo | $575,000 | $288 | 69 |
| 1201 Tabitha Ct NW | 0.15mi | 3/2.0 (-1) | 1,801 (-9%) | 6mo | $610,000 | $339 | 66 |
| 2702 Walnut Loop NW | 0.33mi | 4/3.0 | 1,788 (-10%) | 1mo | $575,000 | $322 | 65 |
| 1228 Tabitha Ct NW | 0.21mi | 4/2.5 | 2,176 (+10%) | 12mo | $650,000 | $299 | 64 |
| 702 Wily St NW | 0.17mi | 3/2.5 (-1) | 2,195 (+11%) | 9mo | $600,000 | $273 | 62 |
| 1418 Ethel St NW | 0.36mi | 3/2.0 (-1) | 1,897 (-4%) | 11mo | $555,000 | $293 | 60 |
| 1022 Cardigan Loop NW | 0.45mi | 3/2.0 (-1) | 1,864 (-6%) | 8mo | $530,918 | $285 | 55 |
| 2715 Walnut Loop NW | 0.39mi | 3/2.5 (-1) | 1,822 (-8%) | 10mo | $562,900 | $309 | 55 |
| 2705 Walnut Loop NW | 0.33mi | 3/2.5 (-1) | 2,194 (+11%) | 12mo | $616,000 | $281 | 51 |
| 1808 Cyrene Dr NW | 0.54mi | 3/2.0 (-1) | 1,732 (-13%) | 4mo | $545,500 | $315 | 44 |
| 2608 19th Way NW | 0.70mi | 3/2.0 (-1) | 1,724 (-13%) | 4mo | $520,000 | $302 | 35 |
Match score weights: distance 35% · size 25% · config 20% · recency 20%. Top-matched comps best support the ARV.
Projected returns pro-forma
10.0% appreciation · 3.16% rent growth · sell at horizon
- IRR
- 16.3%
- Equity multiple
- 2.34×
- Total profit
- $200,240
- Equity at exit
- $481,970
- IRR
- 15.6%
- Equity multiple
- 5.42×
- Total profit
- $662,317
- Equity at exit
- $1,039,387
Cash invested: $149,800 (down + closing). Projections, not guarantees.
Landlord ↔ Tenant lean methodology
- Overall (STATE)
- 28 Tenant-Leaning
- State Washington
- 28 Tenant-Leaning · D+8
- County
- — inherits STATE
- City
- — inherits STATE
ZIP-level market 98502
- Home prices YoY
- 1.8%
- Rents YoY
- 3.2%
- Active inventory
- 306
- Price-to-rent
- 17.0×
Monthly cashflow live
- Estimated rent
- $2,619 high interval (Pro) →
- Mortgage (P&I)
- −$2,806
- Tax from tax record
- −$451 /mo · $5,418/yr
- Insurance
- −$223
- HOA
- −$25
- Vacancy / Maint / Mgmt
- −$550
- Net cashflow
- $-1,436
Break-even live
Sensitivity live
| Price | -10% $-1,133 | -5% $-1,285 | +0% $-1,436 | +5% $-1,588 | +10% $-1,739 |
|---|---|---|---|---|---|
| Rent | -10% $-1,643 | -5% $-1,540 | +0% $-1,436 | +5% $-1,333 | +10% $-1,229 |
| Rate | -1.0pp $-1,167 | -0.5pp $-1,300 | base $-1,436 | +0.5pp $-1,575 | +1.0pp $-1,716 |
UW: 25.0% down · 7.5% · 30yr · 1.5% tax · 5.0% vac · 8.0% maint · 8.0% mgmt
Financing live
Cash to close
- Down payment
- $133,750
- Closing costs
- $16,050
- Reserves months
- —
- Total cash needed
- —
Loan-product check · same deal, 3 products live
Conventional
25% down · 7.5% · 30yr
- Down + closing
- —
- Monthly P&I
- —
- Monthly cashflow
- —
- DSCR
- —
- Eligible?
- —
Personal DTI + credit; lowest rate.
DSCR
20% down · 8.5% · 30yr
- Down + closing
- —
- Monthly P&I
- —
- Monthly cashflow
- —
- DSCR
- —
- Eligible?
- —
No personal income docs; deal must DSCR.
Hard money
10% down · 12.0% · 12mo
- Down + closing
- —
- Monthly P&I
- —
- Monthly cashflow
- —
- DSCR
- —
- Eligible?
- —
Short-term bridge; refi at stabilization.
Rent comps 7 comps
| Address | Beds | Baths | Sqft | Rent | $/sqft | DOM | Units | Dist |
|---|---|---|---|---|---|---|---|---|
| 2137 Conger Ave NW Unit A Olympia, WA | 3.0 | 2.0 | 1248 | $1,995 | $1.60 | 45d | 1 | 0.62mi |
| 2137 Conger Ave NW Unit C Olympia, WA | 3.0 | 2.0 | 1248 | $1,895 | $1.52 | 45d | 1 | 0.62mi |
| 4407 Goldcrest Dr NW Olympia, WA | 4.0 | 2.5 | 2615 | $2,950 | $1.13 | 45d | 1 | 0.87mi |
| 1901 Hudson St NW Olympia, WA | 3.0 | 2.5 | 1705 | $2,700 | $1.58 | 15d | 1 | 0.98mi |
| 2006 Burbank Ave NW Unit NA Olympia, WA | 4.0 | 3.0 | 1750 | $2,650 | $1.51 | 45d | 1 | 1.11mi |
| 4611 Greenwood Dr SW Olympia, WA | 3.0 | 3.0 | 1448 | $2,495 | $1.72 | 45d | 1 | 1.19mi |
| 5004 4th Way SW Olympia, WA | 2.0–3.0 | 2.0–2.5 | 1271 | $2,645 | $2.08 | 15d | 5 | 1.38mi |
HOA detail
- Monthly dues
- $25 · $300/yr
- Likely covers
- water
Listing history 4 events
-
2026-05-06$535,000 Active
-
2003-07-01soldstatus $229,950
-
2003-06-30soldstatus $229,950
-
2002-10-17$229,950
ⓘ Source: listings_history table (triggers on properties + properties_extension) + one-shot
backfill from property_details.listing_events for pre-trigger history.
Tax reassessment forecast WA · Resets to sale price
- Current annual tax
- $5,418 · $451/mo
- Projected year-2 tax
- $5,418 · $451/mo
- Expected delta
- $0/yr ($0/mo · 0.0%)
ⓘ Screening estimate from a state-policy table — verify with the county assessor before closing.
Climate risk First Street
- Flood 1/10 Low FEMA zone X (unshaded) · 0% chance over 30 yrs
- Wildfire 3/10 Moderate
- Heat 3/10 Moderate 7 d/yr ≥88°F today · 14 d/yr by 30 yrs out
- Wind 1/10 Low
- Air quality 6/10 Major 6 unhealthy d/yr today · 7 by 30 yrs out
Nearby sold comps map
Loading sold comps map…
Walkable amenities ~0.75 mi
Loading nearby amenities…
Taxation est. · year 1
- Rental income
- $31,423
- − Mortgage interest
- −$29,968
- − Property taxes
- −$5,418
- − Insurance
- −$2,675
- − Repairs & maintenance
- −$2,514
- − Management
- −$2,514
- − HOA
- −$300
- − Depreciation
- −$15,564
- Taxable loss
- −$27,529
- Est. tax savings @ 24.0%
- +$6,607
- After-tax cash flow
- $-10,629/yr
For passive investors: Depreciation is non-cash, so a rental often shows a tax loss while cash-flowing — sheltering income. Rental losses are passive: they offset passive income freely, and up to $25,000/yr can offset ordinary (W-2) income if you actively participate and your MAGI is under $100k (phasing out to $0 by $150k); unused losses carry forward. On sale, claimed depreciation is recaptured at up to 25%, and gains may owe capital-gains tax (a 1031 exchange can defer both). Figures are a year-1 estimate at your 24.0% rate — not tax advice; consult a CPA.
Schools (NCES district)
- District
- Olympia School District
- NCES district ID
- 5306180
- Math proficiency
- 66% ▼ -2.00%
- Reading proficiency
- 75% ▼ -2.00%
- Median HH income
- $63,852
- Composite
- 62.27/100
- National rank
- #1438
- State rank
- #17 of 291 in WA
Livability — Olympia
- Score
- 83/100
- State rank
- #58
- US rank
- #1036
Category grades
Schools grade is shown separately in the Schools card above.
Census & demographics
- Census place
- Olympia, WA
- County
- Thurston County · 269,345 people
- City population
- 98,428
- Metro
- Olympia-Lacey-Tumwater, WA
- Population (ZIP)
- 35,398
- Household income
- $92,207
- Rent vs Own
- Severe rent burden
- 1811.0
Population outlook (Thurston County) Hauer SSP2
- Today (2025)
- 308,239 people
- By 2030
- 326,483 · +5.9%
- By 2040
- 359,890 · +16.8%
- By 2050
- 391,800 · +27.1%
- By 2075
- 468,024 · +51.8%
- By 2100
- 519,890 · +68.7%
Race, ethnicity, and origin ACS 2023
- Neighborhood character
- Predominantly White (71%)
- Race & ethnicity
- White 71% Two or more races 13% Hispanic / Latino 11% Asian 6% Black 3% Native American 1%
- Hispanic origin (detail)
- Mexican 3% Puerto Rican 4%
- Common ancestry
- Italian 5% Portuguese 4% Iranian 3%
- Foreign-born
- 8% · Vietnam, Canada, China
- Languages at home
- 90% English-only · Spanish 3% Vietnamese 2% Other Asian/Pacific 1%
Political lean MEDSL · Thurston
- 2024 margin
- Strong D (+20.4) · D 58.5% · R 38.1% · Other 3.5%
- 2008→2024 swing
- -1.3pp toward R · 2008: 21.7pp · 2024: 20.4pp
- All cycles
- 2024: D+20.4 2020: D+18.6 2016: D+15.4 2012: D+19.0 2008: D+21.7
Not yet ingested
- Civics
- —
Market trends
- HPI YoY
- ▲ 18.49%
- Current HPI
- 1056.49
- Rent YoY
- ▲ 3.16%
- Metro
- Olympia-Lacey-Tumwater, WA
- State GDP YoY
- ▲ 4.65%
- F500 in state
- 22
Industry mix (Fortune 500 HQ in WA)
| Industry | F500 HQs | Revenue |
|---|---|---|
| Retail | 2 | $269B |
|
||
| Technology / Retail | 1 | $638B |
|
||
| Technology | 1 | $245B |
|
||
| Telecommunications | 1 | $38B |
|
||
| Food / Beverage | 1 | $36B |
|
||
| Automotive / Trucks | 1 | $34B |
|
||
Price history
+132.7% since first listed5 events — show timeline
- 2026-05-19 Pending — NWMLS as Distributed by MLS Grid
- 2026-05-06 Listed $535,000 NWMLS as Distributed by MLS Grid
- 2003-07-01 Sold (MLS) $229,950 NWMLS as Distributed by MLS Grid
- 2003-06-30 Sold (Public Records) $229,950 Public Records
- 2002-10-17 Listed $229,950 NWMLS as Distributed by MLS Grid
Property tax history
+4.4%/yrLatest (2026): $5,418 · -0.6% YoY. Source: county tax records.
Cash-flow waterfall
monthlySold comps — $/sqft
last 12 mo · ≤1 miLoading sold comps…