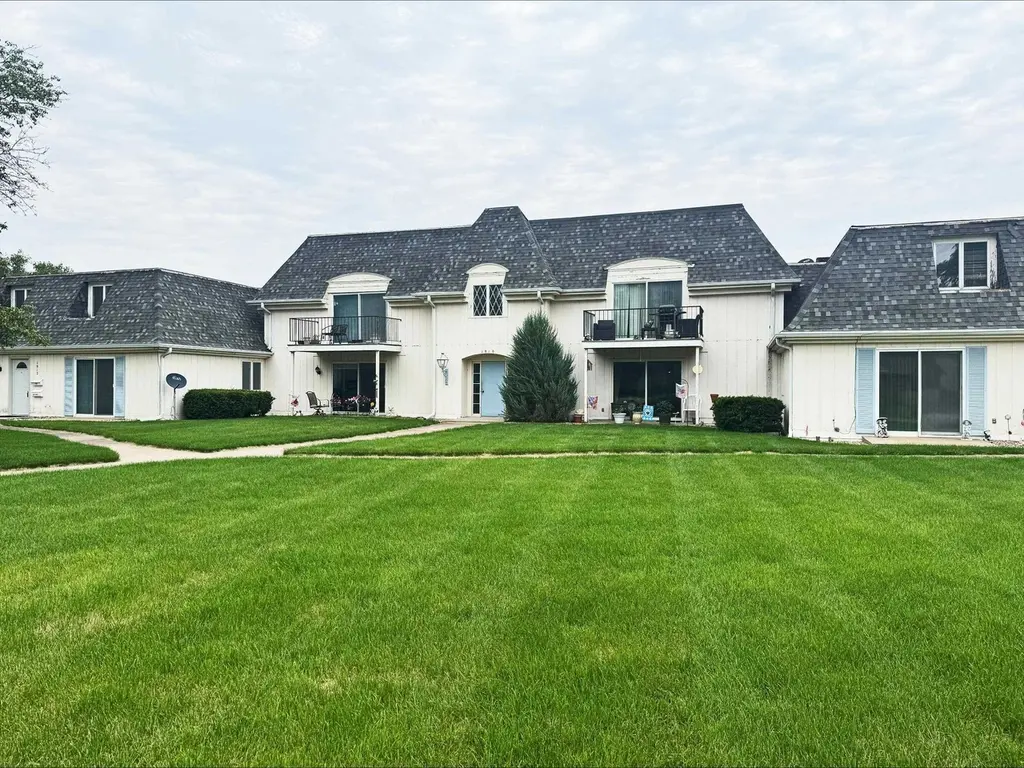
1910 32nd St · Columbus, NE
Flood risk 1/10 · Minimal
- FEMA flood zone
- X
- Chance of flooding over 30 yrs
- 0.0%
- Est. flood insurance / yr
- $507 – $1,088
Fire risk 1/10 · Minimal
- Est. fire insurance / yr
- $1,161 – $2,155
Heat risk 3/10 · Minor
- Hot days now (above 104°F)
- 7 days/yr
- Hot days in 30 yrs
- 16 days/yr
Wind risk 2/10 · Minimal
- Chance of severe wind over 30 yrs
- —
Air-quality risk 1/10 · Minimal
- Unhealthy air days now
- 0 days/yr
- Unhealthy air days in 30 yrs
- 0 days/yr
Risk factors via First Street. Map © Google.
Why this score? — see what drove the D- grade
The composite is a weighted blend of 9 inputs, each scored 0–100. Each bar is that input's sub-score; the figure is the points it added to the 100-point composite (weight × sub-score).
- Cash flow +9.7/30.0
- ARV discount +7.5/15.0
- 1% rule +7.1/10.0
- Livability +4.0/5.0
- Schools +3.5/10.0
- DSCR +2.8/10.0
- Rent growth +2.5/5.0
- Condition / age +2.5/5.0
- Appreciation +0.0/10.0
$105,000
🖨 Deal sheet (PDF) 📄 Offer letter ✓ Due diligence
Listing remarks MLS
Welcome to this spacious 1 bed / 1 bath condo (unit 201) with over 1,000 sq ft of living space! Located on the 2nd floor. The kitchen comes complete with all appliances, and the in-unit washer/dryer stays. The monthly HOA fee of $325 covers water, sewer, trash, lawn care, snow removal, and all common-area maintenance and electricity. You’ll also appreciate the convenience of onsite parking (no garage parking) and low-maintenance living. This unit was recently deep cleaned and carpets professionally cleaned by Service Master.
Key facts
- Bright living area
- Off street parking
- Built 1974
Tags
Property features AI
Finance
- HOA & community: Homeowners association with a $325 monthly fee
Exterior
- Parking: No designated parking
- Security: Smoke detector(s)
- Utilities: Public water; Public sewer; Electricity available
- Home design: Residential single family residence
- Exterior features: Paved road frontage; Publicly maintained road
Interior
- Bedrooms: 1 main-level bedroom
- Heating & cooling: Central air conditioning; Forced air heating (electric)
- Interior features: Walk-in closet(s)
Neighborhood map
What this means for you Summary
Snapshot
- This is a 1-bed/1.0-bath single-family listed at $105k.
Deal economics
- At list price, monthly cash flow is $-69 ($-823/yr) — negative.
- To cash-flow at today's rent, offer at most $93k (11.5% below list).
- Meets the 1% rule at list price ($1k rent vs $105k).
- Recommended offer: $93k (11.5% below list) — sets the bar for cash-flow.
- Cap rate 5.5% vs local median 3.3% in Columbus — top-decile yield for the area; either an underpriced asset or a hidden risk that comps aren't pricing in. Stress-test before assuming the spread holds.
Location & tenants
- Location reads 80/100 on livability (#20 in NE, #1,633 nationally) — a professional / high-income tenant draw. Strengths: crime A+, cost of living A+, housing A+; Watch: amenities D-, commute F.
- Columbus Public Schools (town): math 39% / reading 43% proficiency, ranked #93 of 111 in NE (top 84%) — families likely to look elsewhere, expect single-tenant / working-renter base with shorter leases.
- Zoned schools: North Park Elementary (math 37% / reading 52%, grade F, #289 of 502 statewide, top 63%, 331 students, 54% FRL); Columbus Middle School (math 39% / reading 42%, grade F, #82 of 128 statewide, top 65%, 1,174 students, 55% FRL); Columbus High School (math 38% / reading 39%, grade F, #199 of 261 statewide, top 77%, 1,273 students, 46% FRL).
- Market conditions: 300 active listings in the ZIP; 98 units permitted in Platte County in 2024 (17 in 5+ unit buildings).
Forward outlook
- Local home prices are declining (-3.0%/yr); year-one equity from $726 of loan paydown is wiped out by about $3k of value loss. Plan a longer hold.
- Platte County population projected at +13% by 2050 — modest demand growth; plan on rents tracking national, not racing it.
Negotiation context
- It's been on market 20 days — a 2% lower offer ($103k) is reasonable based on typical stale-listing flexibility.
- 4 sale attempts since 4y ago with the ask held roughly flat each time — persistent listings suggest the price (not the market) is what's stuck; bring a comps-based counter.
Risks & watch-outs
- Watch-outs: HOA is 26% of rent.
Questions for the listing agent
- What do current leases actually rent for vs. the listed asking? Can we see a recent rent roll and the last 12 months of T-12 income?
- Built in 1974 — when were the roof, HVAC, electrical panel, plumbing, and water heater last replaced?
- What does the HOA fee cover, when was the last increase, and are there any pending special assessments or reserve-fund shortfalls?
- Is there a deadline driving the sale (1031 exchange, divorce, estate, relocation)? That informs how much negotiation room exists.
- The area grade is low — what's the realistic commute time and amenity access for the typical tenant pool here? Any planned neighborhood developments (good or bad) we should know about?
- What's the average days-on-market for RENTAL listings here right now (not sales)? A rising rental-DOM trend means longer vacancies and softer asking-rent achievability than the comps imply.
- What's the recent tenant-quality profile in this submarket — average credit score on applications, eviction rate, late-payment / NSF rate, and stable-employment percentage? A property-management company in the area should have these aggregated.
- How much new for-sale + rental construction is in the pipeline within 1–3 miles? Heavy new supply typically softens prices + rents 12–24 months out; constrained supply supports both.
Investment metrics
- 1% rule
- 1.21% ✓
- Cap rate
- 5.51%
- Cash-on-cash
- -2.80%
- DSCR
- 0.88
- GRM
- 6.9
CMA / ARV
- ARV (on-the-fly)
- $224,406
- Comps found
- 2
Show comp detail 2 sales within ~0.75 mi
| Address | Dist | Beds/Ba | Sqft | Sold | Price | $/sf | Match |
|---|---|---|---|---|---|---|---|
| 1910 32nd St | 0.00mi | 1/1.0 | 1,128 (-8%) | 7mo | $90,000 | $80 | 80 |
| 3055 17th Ave | 0.17mi | 2/2.0 (+1) | 1,256 (+2%) | 14mo | $229,000 | $182 | 68 |
Match score weights: distance 35% · size 25% · config 20% · recency 20%. Top-matched comps best support the ARV.
Projected returns pro-forma
-3.0% appreciation · 3.0% rent growth · sell at horizon
- IRR
- -20.7%
- Equity multiple
- 0.28×
- Total profit
- $-21,149
- Equity at exit
- $15,656
- IRR
- -13.3%
- Equity multiple
- 0.21×
- Total profit
- $-23,092
- Equity at exit
- $9,078
Cash invested: $29,400 (down + closing). Projections, not guarantees.
Landlord ↔ Tenant lean methodology
- Overall (STATE)
- 83 Strongly Landlord-Friendly
- State Nebraska
- 83 Strongly Landlord-Friendly · R+13
- County
- — inherits STATE
- City
- — inherits STATE
ZIP-level market 68601
- Home prices YoY
- -22.4%
- Active inventory
- 300
- Price-to-rent
- 6.9×
Monthly cashflow live
- Estimated rent
- $1,273 medium interval (Pro) →
- Mortgage (P&I)
- −$551
- Tax from tax record
- −$155 /mo · $1,863/yr
- Insurance
- −$44
- HOA
- −$325
- Lot rent
- −$0
- Vacancy / Maint / Mgmt
- −$267
- Net cashflow
- $-69
Break-even live
Sensitivity live
| Price | -10% $-9 | -5% $-39 | +0% $-69 | +5% $-98 | +10% $-128 |
|---|---|---|---|---|---|
| Rent | -10% $-169 | -5% $-119 | +0% $-69 | +5% $-18 | +10% $32 |
| Rate | -1.0pp $-16 | -0.5pp $-42 | base $-69 | +0.5pp $-96 | +1.0pp $-123 |
UW: 25.0% down · 7.5% · 30yr · 1.5% tax · 5.0% vac · 8.0% maint · 8.0% mgmt
Financing live
Cash to close
- Down payment
- $26,250
- Closing costs
- $3,150
- Reserves months
- —
- Total cash needed
- —
Loan-product check · same deal, 3 products live
Conventional
25% down · 7.5% · 30yr
- Down + closing
- —
- Monthly P&I
- —
- Monthly cashflow
- —
- DSCR
- —
- Eligible?
- —
Personal DTI + credit; lowest rate.
DSCR
20% down · 8.5% · 30yr
- Down + closing
- —
- Monthly P&I
- —
- Monthly cashflow
- —
- DSCR
- —
- Eligible?
- —
No personal income docs; deal must DSCR.
Hard money
10% down · 12.0% · 12mo
- Down + closing
- —
- Monthly P&I
- —
- Monthly cashflow
- —
- DSCR
- —
- Eligible?
- —
Short-term bridge; refi at stabilization.
HOA detail
- Monthly dues
- $325 · $3,900/yr
- Likely covers
- watersewertrashelectriclandscapingsnow removal
Listing history 15 events
-
2026-06-22days on market $105,000 Active 20 DOM
-
2026-06-21days on market $105,000 Active 19 DOM
-
2026-06-21days on market $105,000 Active 18 DOM
-
2026-06-18days on market $105,000 Active 16 DOM
-
2026-06-17days on market $105,000 Active 15 DOM
-
2026-06-16days on market $105,000 Active 14 DOM
-
2026-06-15days on market $105,000 Active 13 DOM
-
2026-06-13days on market $105,000 Active 11 DOM
-
2026-06-12days on market $105,000 Active 10 DOM
-
2026-06-09days on market $105,000 Active 7 DOM
-
2026-06-08days on market $105,000 Active 6 DOM
-
2026-06-07days on market $105,000 Active 5 DOM
-
2026-06-07days on market $105,000 Active 4 DOM
-
2026-06-03remarks 699-char remark
-
2026-06-03$105,000 Active 1 DOM
ⓘ Source: listings_history table (triggers on properties + properties_extension) + one-shot
backfill from property_details.listing_events for pre-trigger history.
Tax reassessment forecast NE · Resets to sale price
- Current annual tax
- $1,863 · $155/mo
- Projected year-2 tax
- $1,863 · $155/mo
- Expected delta
- $0/yr ($0/mo · 0.0%)
ⓘ Screening estimate from a state-policy table — verify with the county assessor before closing.
Climate risk First Street
- Flood 1/10 Low FEMA zone X · 0% chance over 30 yrs
- Wildfire 1/10 Low
- Heat 3/10 Moderate 7 d/yr ≥104°F today · 16 d/yr by 30 yrs out
- Wind 2/10 Low
- Air quality 1/10 Low 0 unhealthy d/yr today · 0 by 30 yrs out
Nearby sold comps map
Loading sold comps map…
Walkable amenities ~0.75 mi
Loading nearby amenities…
Taxation est. · year 1
- Rental income
- $15,281
- − Mortgage interest
- −$5,882
- − Property taxes
- −$1,863
- − Insurance
- −$525
- − Repairs & maintenance
- −$1,223
- − Management
- −$1,223
- − HOA
- −$3,900
- − Depreciation
- −$3,055
- Taxable loss
- −$2,388
- Est. tax savings @ 24.0%
- +$573
- After-tax cash flow
- $-250/yr
For passive investors: Depreciation is non-cash, so a rental often shows a tax loss while cash-flowing — sheltering income. Rental losses are passive: they offset passive income freely, and up to $25,000/yr can offset ordinary (W-2) income if you actively participate and your MAGI is under $100k (phasing out to $0 by $150k); unused losses carry forward. On sale, claimed depreciation is recaptured at up to 25%, and gains may owe capital-gains tax (a 1031 exchange can defer both). Figures are a year-1 estimate at your 24.0% rate — not tax advice; consult a CPA.
Schools (NCES district)
- District
- Columbus Public Schools
- NCES district ID
- 3105340
- Math proficiency
- 39% ▼ -10.00%
- Reading proficiency
- 43% ▼ -3.00%
- Median HH income
- $51,074
- Composite
- 35.41/100
- National rank
- #4942
- State rank
- #93 of 111 in NE
Livability — Columbus
- Score
- 80/100
- State rank
- #20
- US rank
- #1633
Category grades
Schools grade is shown separately in the Schools card above.
Census & demographics
- Census place
- Columbus, NE
- City population
- 30,619
- Population (ZIP)
- 30,619
Population outlook (Platte County) Hauer SSP2
- Today (2025)
- 34,130 people
- By 2030
- 34,778 · +1.9%
- By 2040
- 36,436 · +6.8%
- By 2050
- 38,648 · +13.2%
- By 2075
- 47,293 · +38.6%
- By 2100
- 57,020 · +67.1%
Race, ethnicity, and origin ACS 2023
- Neighborhood character
- Predominantly White (71%)
- Race & ethnicity
- White 71% Hispanic / Latino 25% Two or more races 14%
- Hispanic origin (detail)
- Mexican 14% Cuban 2%
- Common ancestry
- Romanian 7% Portuguese 2% Lithuanian 1%
- Foreign-born
- 14% · Canada
- Languages at home
- 79% English-only · Spanish 20%
Political lean MEDSL · Platte
- 2024 margin
- Solid R (+58.3) · D 20.4% · R 78.7%
- 2008→2024 swing
- -16.8pp toward R · 2008: -41.5pp · 2024: -58.3pp
- All cycles
- 2024: R+58.3 2020: R+56.8 2016: R+58.8 2012: R+51.8 2008: R+41.5
Not yet ingested
- Civics
- —
Market trends
- HPI YoY
- ▼ -100.37%
- Current HPI
- 347.5063
- Rent YoY
- —
- Metro
- —
- State GDP YoY
- ▲ 0.68%
- F500 in state
- 2
Industry mix (Fortune 500 HQ in NE)
| Industry | F500 HQs | Revenue |
|---|---|---|
| Conglomerate | 1 | $371B |
|
||
Price history
+90.9% since first listed10 events — show timeline
- 2026-06-02 Listed $105,000 CBOR
- 2025-11-17 Sold (Public Records) $92,800 Public Records
- 2025-11-14 Sold (MLS) $90,000 CBOR
- 2025-10-16 Pending — CBOR
- 2025-10-01 Listed $100,000 CBOR
- 2022-07-14 Sold (Public Records) $125,000 Public Records
- 2022-06-30 Sold (MLS) $62,500 CBOR
- 2022-06-30 Sold (MLS) $62,500 CBOR
- 2022-05-19 Listed $55,000 CBOR
- 2022-05-19 Listed $55,000 CBOR
Property tax history
-2.2%/yrLatest (2025): $1,863 · -6.6% YoY. Source: county tax records.
Cash-flow waterfall
monthlySold comps — $/sqft
last 12 mo · ≤1 miLoading sold comps…