 Fourplex
6313 E 32nd Ave · Anchorage, AK
Flood risk 1/10 · Minimal
- FEMA flood zone
- X (unshaded)
- Chance of flooding over 30 yrs
- 0.0%
- Est. flood insurance / yr
- $507 – $1,088
Fire risk No data
- Est. fire insurance / yr
- —
Heat risk No data
- Hot days now (above threshold)
- —
- Hot days in 30 yrs
- —
Wind risk No data
- Chance of severe wind over 30 yrs
- —
Air-quality risk 1/10 · Minimal
- Unhealthy air days now
- —
- Unhealthy air days in 30 yrs
- —
Risk factors via First Street. Map © Google.
Why this score? — see what drove the C grade
The composite is a weighted blend of 9 inputs, each scored 0–100. Each bar is that input's sub-score; the figure is the points it added to the 100-point composite (weight × sub-score).
- Cash flow +20.7/30.0
- ARV discount +9.4/15.0
- DSCR +6.6/10.0
- 1% rule +5.1/10.0
- Livability +3.9/5.0
- Schools +3.7/10.0
- Rent growth +3.1/5.0
- Condition / age +2.5/5.0
- Appreciation +0.0/10.0
$639,000
🖨 Deal sheet (PDF) 📄 Offer letter ✓ Due diligence
Multi-family units
County records classify this as Multi-Family (5+ Unit). Listing-text estimate: 4 units. estimate disagrees with records
5+ unit building — per-unit beds/baths from public records are typically unavailable; the breakdown below (if shown) is an estimate from the listing text.
Listing remarks
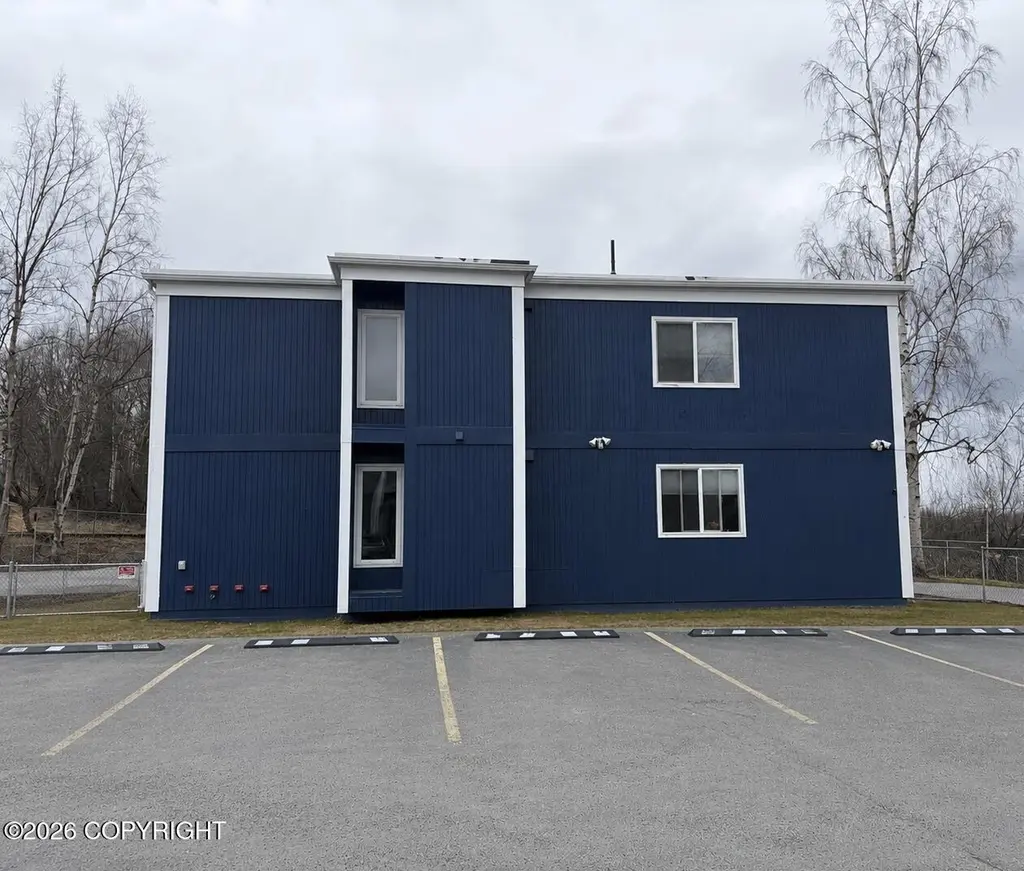
Fantastic opportunity to own a well maintained 4-plex in East Anchorage. Close to parks, trails, schools, and Cheney Lake. Updated paint, flooring, kitchens and additional improvements throughout! This property features spacious and well-kept common areas, shared ground-level laundry, and a fully fenced corner lot offering added privacy and outdoor space. Unit mix includes: Unit 1: 1 bedroom, 1 bathroom Unit 2,3,4: 2 bedroom, 1 bathroom each. An excellent asset for both owner-occupants and investors seeking a turnkey multi-family property in a prime location.
Key facts
- Close to parks
- Close to schools
- Close to cheney lake
Tags
Property features AI
Exterior
- Parking: 5 open parking spaces; No attached garage; No carport
- Utilities: Public sewer
- Home design: Multi-family property; Built in 1971; Wood frame construction; Unknown foundation type
- Construction: Wood frame construction; Built in 1971; Unknown foundation
- Exterior features: Paved road access; Lot is 0.25 acres
Interior
- Bedrooms: 7 bedrooms
- Flooring: Carpet
- Bathrooms: 4 full bathrooms
- Interior features: Carpet flooring
Neighborhood map
What this means for you Summary
Snapshot
- This is a 1×1.0bd/1.0ba + 3×1.75bd/1.0ba units multifamily listed at $639k.
Deal economics
- At list price, monthly cash flow is $864 ($10k/yr) — positive. Per door: $216/mo.
- The deal already cash-flows at list — no discount required.
- Meets the 1% rule at list price ($6k rent vs $639k).
- Cap rate 7.9% vs local median 3.8% in Anchorage — top-decile yield for the area; either an underpriced asset or a hidden risk that comps aren't pricing in. Stress-test before assuming the spread holds.
Location & tenants
- Location reads 78/100 on livability (#6 in AK, #2,553 nationally) — a middle-class / working-renter tenant base. Strengths: amenities A+, commute A+, employment A+; Watch: crime F, cost of living F.
- Anchorage School District (urban): math 37% / reading 43% proficiency, ranked #6 of 21 in AK (top 29%) — families likely to look elsewhere, expect single-tenant / working-renter base with shorter leases.
- Zoned schools: Baxter Elementary (math 32% / reading 27%, grade F, #112 of 156 statewide, top 74%, 269 students, 68% FRL); Wendler Middle School (math 19% / reading 36%, grade F, #29 of 36 statewide, top 80%, 422 students, 60% FRL); Bartlett High School (math 22% / reading 27%, grade F, #42 of 61 statewide, top 82%, 1,373 students, 64% FRL) — zoned schools average 64% FRL vs 38% district-wide (26 pts higher); higher-poverty schools than district average — tighter screening recommended.
- Zoned-school proficiency averages 27% at this address vs 40% district-wide (-13 pts) — the specific schools serving this property underperform the Anchorage School District average; the district grade overstates school quality for this exact location.
- Market conditions: Rents rising (+2.6%/yr); 217 active listings in the ZIP; solid renter incomes; 306 units permitted in Anchorage Municipality in 2024 (90 in 5+ unit buildings).
- At $6,472/mo this rent would consume 90% of the median local household income ($87k/yr) (locally 1052% of renters already pay >50% of income on rent) — very limited rent-growth headroom before tenants either downsize or default.
Forward outlook
- Local home prices are declining (-3.0%/yr); year-one equity from $4k of loan paydown is wiped out by about $19k of value loss. Plan a longer hold.
- Anchorage County population projected at +12% by 2050 — modest demand growth; plan on rents tracking national, not racing it.
Negotiation context
- Only 5 days on market — expect competitive offers; lowballing is unlikely to land.
- 8 sale attempts since 30y ago with the ask held roughly flat each time — persistent listings suggest the price (not the market) is what's stuck; bring a comps-based counter.
Questions for the listing agent
- Can we see the unit-by-unit rent roll, current vacancy, and any below-market leases? What's the average tenancy length?
- What capital expenditures (roof, boiler, parking lot, exteriors) have been made in the last 5 years, and what's planned in the next 2?
- Built in 1971 — when were the roof, HVAC, electrical panel, plumbing, and water heater last replaced?
- Is there a deadline driving the sale (1031 exchange, divorce, estate, relocation)? That informs how much negotiation room exists.
- Schools are B-rated — typically a magnet for longer-tenancy family renters. What's the average tenant stay here, and is there a school-zone premium baked into asking?
- Crime grade is F in this area — have there been break-ins, vandalism, or insurance claims at this property in the last 3 years? What carrier currently insures it and at what premium?
- What's the average days-on-market for RENTAL listings here right now (not sales)? A rising rental-DOM trend means longer vacancies and softer asking-rent achievability than the comps imply.
- What's the recent tenant-quality profile in this submarket — average credit score on applications, eviction rate, late-payment / NSF rate, and stable-employment percentage? A property-management company in the area should have these aggregated.
- How much new apartment / multifamily construction is in the pipeline within 1–3 miles? Heavy new supply (>2% of stock underway) typically softens rents 12–24 months out; light construction supports rent growth.
Investment metrics
- 1% rule
- 1.01% ✓
- Cap rate
- 7.92%
- Cash-on-cash
- 5.80%
- DSCR
- 1.26
- GRM
- 8.2
CMA / ARV
- ARV (on-the-fly)
- $667,024
- Comps found
- 2
Show comp detail 2 sales within ~0.75 mi
| Address | Dist | Beds/Ba | Sqft | Sold | Price | $/sf | Match |
|---|---|---|---|---|---|---|---|
| 4021 Lunar Dr | 0.61mi | 6/4.0 | 3,301 (-7%) | 7mo | $620,000 | $188 | 54 |
| 2430 Tagalak Dr | 0.64mi | 6/3.5 | 3,840 (+8%) | 9mo | $569,000 | $148 | 47 |
Match score weights: distance 35% · size 25% · config 20% · recency 20%. Top-matched comps best support the ARV.
Projected returns pro-forma
-3.0% appreciation · 2.57% rent growth · sell at horizon
- IRR
- -7.8%
- Equity multiple
- 0.71×
- Total profit
- $-51,291
- Equity at exit
- $95,277
- IRR
- 1.2%
- Equity multiple
- 1.08×
- Total profit
- $14,856
- Equity at exit
- $55,249
Cash invested: $178,920 (down + closing). Projections, not guarantees.
Landlord ↔ Tenant lean methodology
- Overall (STATE)
- 80 Strongly Landlord-Friendly
- State Alaska
- 80 Strongly Landlord-Friendly · R+8
- County
- — inherits STATE
- City
- — inherits STATE
ZIP-level market 99504
- Rents YoY
- 2.6%
- Active inventory
- 217
- Price-to-rent
- 32.9×
Monthly cashflow live
- Estimated rent
- $6,472 high interval (Pro) →
- Mortgage (P&I)
- −$3,351
- Tax from tax record
- −$631 /mo · $7,576/yr
- Insurance
- −$266
- HOA
- −$0
- Vacancy / Maint / Mgmt
- −$1,359
- Net cashflow
- $864
Break-even live
Sensitivity live
| Price | -10% $1,226 | -5% $1,045 | +0% $864 | +5% $683 | +10% $503 |
|---|---|---|---|---|---|
| Rent | -10% $353 | -5% $609 | +0% $864 | +5% $1,120 | +10% $1,376 |
| Rate | -1.0pp $1,186 | -0.5pp $1,027 | base $864 | +0.5pp $699 | +1.0pp $530 |
4-unit breakdown (identical units grouped — click to expand)
| Units | Beds | Baths | Est. rent |
|---|---|---|---|
| 1× unit | 1.0 | 1 | $1,618 |
| 3× units | 1.75 | 1 | $4,854 |
| #2 | 1.75 | 1 | $1,618 |
| #3 | 1.75 | 1 | $1,618 |
| #4 | 1.75 | 1 | $1,618 |
| Total (4 units) | $6,472 | ||
UW: 25.0% down · 7.5% · 30yr · 1.5% tax · 5.0% vac · 8.0% maint · 8.0% mgmt
Financing live
Cash to close
- Down payment
- $159,750
- Closing costs
- $19,170
- Reserves months
- —
- Total cash needed
- —
Loan-product check · same deal, 3 products live
Conventional
25% down · 7.5% · 30yr
- Down + closing
- —
- Monthly P&I
- —
- Monthly cashflow
- —
- DSCR
- —
- Eligible?
- —
Personal DTI + credit; lowest rate.
DSCR
20% down · 8.5% · 30yr
- Down + closing
- —
- Monthly P&I
- —
- Monthly cashflow
- —
- DSCR
- —
- Eligible?
- —
No personal income docs; deal must DSCR.
Hard money
10% down · 12.0% · 12mo
- Down + closing
- —
- Monthly P&I
- —
- Monthly cashflow
- —
- DSCR
- —
- Eligible?
- —
Short-term bridge; refi at stabilization.
Listing history 12 events
-
2026-05-21$639,000 Active
-
2020-07-08soldstatus
-
2014-05-27soldstatus
-
2014-02-20$449,900
-
2013-10-29$439,900
-
2013-07-02$439,900
-
2006-08-02soldstatus
-
2000-11-04$270,000
-
2000-07-20$268,900
-
1999-10-14$270,000
-
1998-01-07soldstatus
-
1996-04-02$184,000
ⓘ Source: listings_history table (triggers on properties + properties_extension) + one-shot
backfill from property_details.listing_events for pre-trigger history.
Tax reassessment forecast AK · Partial reset (capped growth)
- Current annual tax
- $7,576 · $631/mo
- Projected year-2 tax
- $7,590 · $633/mo
- Expected delta
- +$14/yr (+$1/mo · 0.2%)
ⓘ Screening estimate from a state-policy table — verify with the county assessor before closing.
Climate risk First Street
- Flood 1/10 Low FEMA zone X (unshaded) · 0% chance over 30 yrs
- Air quality 1/10 Low
Nearby sold comps map
Loading sold comps map…
Walkable amenities ~0.75 mi
Loading nearby amenities…
Taxation est. · year 1
- Rental income
- $77,664
- − Mortgage interest
- −$35,794
- − Property taxes
- −$7,576
- − Insurance
- −$3,195
- − Repairs & maintenance
- −$6,213
- − Management
- −$6,213
- − Depreciation
- −$18,589
- Taxable income
- $84
- Est. tax owed @ 24.0%
- −$20
- After-tax cash flow
- $10,352/yr
For passive investors: Depreciation is non-cash, so a rental often shows a tax loss while cash-flowing — sheltering income. Rental losses are passive: they offset passive income freely, and up to $25,000/yr can offset ordinary (W-2) income if you actively participate and your MAGI is under $100k (phasing out to $0 by $150k); unused losses carry forward. On sale, claimed depreciation is recaptured at up to 25%, and gains may owe capital-gains tax (a 1031 exchange can defer both). Figures are a year-1 estimate at your 24.0% rate — not tax advice; consult a CPA.
Schools (NCES district)
- District
- Anchorage School District
- NCES district ID
- 0200180
- Math proficiency
- 37% ▼ -2.00%
- Reading proficiency
- 43% ▲ 1.00%
- Median HH income
- $76,447
- Composite
- 37.0/100
- National rank
- #4523
- State rank
- #6 of 21 in AK
Livability — Anchorage
- Score
- 78/100
- State rank
- #6
- US rank
- #2553
Category grades
Schools grade is shown separately in the Schools card above.
Census & demographics
- Census place
- Anchorage, AK
- County
- Anchorage Borough · 246,594 people
- City population
- 218,117
- Metro
- Anchorage, AK
- Population (ZIP)
- 42,093
- Household income
- $86,710
- Rent vs Own
- Severe rent burden
- 1052.0
Population outlook (Anchorage County) Hauer SSP2
- Today (2025)
- 314,993 people
- By 2030
- 321,771 · +2.2%
- By 2040
- 335,493 · +6.5%
- By 2050
- 352,799 · +12.0%
- By 2075
- 414,771 · +31.7%
- By 2100
- 474,485 · +50.6%
Race, ethnicity, and origin ACS 2023
- Neighborhood character
- Highly diverse neighborhood (Simpson 0.80)
- Race & ethnicity
- White 41% Two or more races 18% Asian 13% Native American 9% Black 9% Hispanic / Latino 9% Pacific Islander 6%
- Hispanic origin (detail)
- Mexican 3% Puerto Rican 1%
- Common ancestry
- Portuguese 2% Ukrainian 2% Romanian 2%
- Foreign-born
- 12% · Canada, South Korea, Vietnam
- Languages at home
- 76% English-only · Other Asian/Pacific 9% Spanish 4% Tagalog/Filipino 3%
Political lean MEDSL · Anchorage
- 2024 margin
- D (+12.7) · D 56.3% · R 43.7%
- 2016→2024 swing
- +27.9pp toward D · 2016: -15.2pp · 2024: 12.7pp
- All cycles
- 2024: D+12.7 2016: R+15.2
Not yet ingested
- Civics
- —
Market trends
- HPI YoY
- ▼ -184.29%
- Current HPI
- 259.8803
- Rent YoY
- ▲ 2.57%
- Metro
- Anchorage, AK
- State GDP YoY
- —
- F500 in state
- 0
Price history
+247.3% since first listed13 events — show timeline
- 2026-05-27 Pending — AKMLS
- 2026-05-21 Listed $639,000 AKMLS
- 2020-07-08 Sold (Public Records) — Public Records
- 2014-05-27 Sold (Public Records) — Public Records
- 2014-02-20 Listed $449,900 AKMLS
- 2013-10-29 Listed $439,900 AKMLS
- 2013-07-02 Listed $439,900 AKMLS
- 2006-08-02 Sold (Public Records) — Public Records
- 2000-11-04 Listed $270,000 AKMLS
- 2000-07-20 Listed $268,900 AKMLS
- 1999-10-14 Listed $270,000 AKMLS
- 1998-01-07 Sold (Public Records) — Public Records
- 1996-04-02 Listed $184,000 AKMLS
Property tax history
+2.5%/yrLatest (2025): $7,576 · +4.6% YoY. Source: county tax records.
Cash-flow waterfall
monthlySold comps — $/sqft
last 12 mo · ≤1 miLoading sold comps…