310 Southridge Dr · Mount Airy, NC
Flood risk 1/10 · Minimal
- FEMA flood zone
- X (unshaded)
- Chance of flooding over 30 yrs
- 0.0%
- Est. flood insurance / yr
- $507 – $1,088
Fire risk 4/10 · Minor
- Est. fire insurance / yr
- $906 – $1,684
Heat risk 4/10 · Minor
- Hot days now (above 99°F)
- 7 days/yr
- Hot days in 30 yrs
- 19 days/yr
Wind risk 2/10 · Minimal
- Chance of severe wind over 30 yrs
- 2.0%
Air-quality risk 1/10 · Minimal
- Unhealthy air days now
- 0 days/yr
- Unhealthy air days in 30 yrs
- 0 days/yr
Risk factors via First Street. Map © Google.
Why this score? — see what drove the B- grade
The composite is a weighted blend of 9 inputs, each scored 0–100. Each bar is that input's sub-score; the figure is the points it added to the 100-point composite (weight × sub-score).
- Cash flow +29.8/30.0
- DSCR +10.0/10.0
- ARV discount +7.5/15.0
- 1% rule +7.0/10.0
- Schools +4.3/10.0
- Livability +3.1/5.0
- Rent growth +2.5/5.0
- Condition / age +2.5/5.0
- Appreciation +0.0/10.0
$110,000
🖨 Deal sheet 📄 Offer letter ✓ Due diligence
Listing remarks
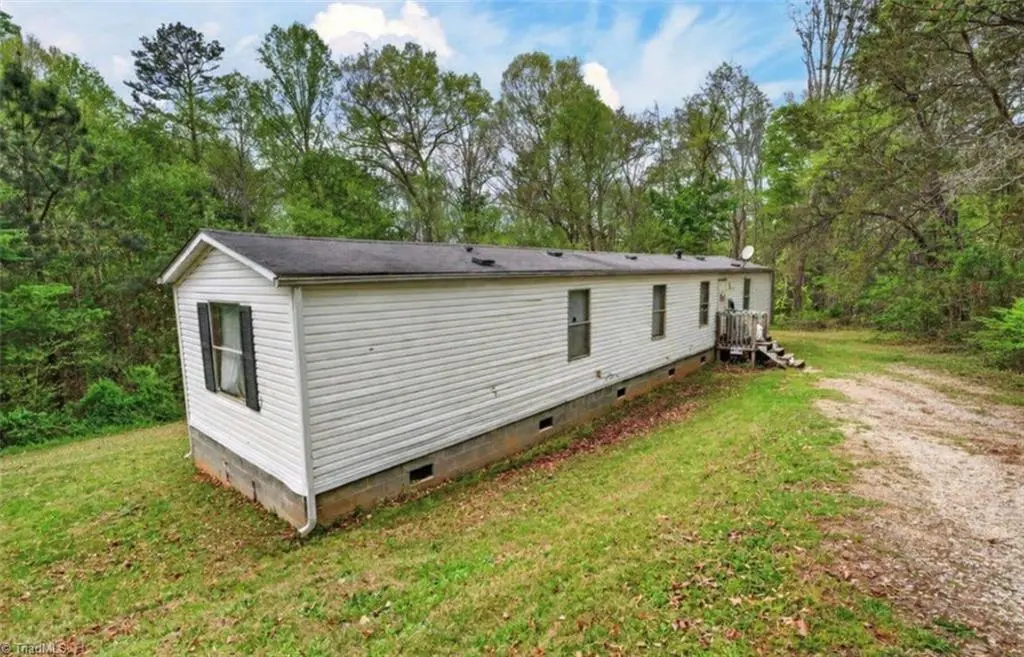
Welcome to 310 Southridge Drive in charming Mount Airy, NC! Nestled on approximately 1.7 acres, this manufactured home offers a peaceful, rural setting with plenty of space to enjoy the outdoors. Built in 1999, the home features 3 bedrooms and 2 bathrooms with a functional layout that provides comfortable everyday living. The property offers a quiet country atmosphere while still being conveniently located to the amenities of Mount Airy. Enjoy open yard space, privacy, and the potential to make this property your own. Seller is open to seller financing. Agent is related to seller.
Key facts
- 1.7 acres
- Open yard space
- 1.75 acre lot
Tags
Property features AI
Finance
- HOA & community: No homeowners association
Exterior
- Parking: Driveway
- Utilities: Septic tank; Electric water heater; Publicly maintained road access
- Home design: Manufactured home (single wide), one story; Built in 1999; Existing structure
- Construction: Block construction
- Exterior features: Cleared, corner lot; No fencing; Shared well
Interior
- Bathrooms: Two full bathrooms
- Heating & cooling: Central air conditioning; Forced air heat with electric heat pump
- Interior features: Primary bedroom located on the main level
Neighborhood map
What this means for you Summary
Snapshot
- This is a 3-bed/2.0-bath manufactured listed at $110k.
Deal economics
- At list price, monthly cash flow is $403 ($5k/yr) — positive.
- The deal already cash-flows at list — no discount required.
- Meets the 1% rule at list price ($1k rent vs $110k).
- Cap rate 10.7% vs local median 3.1% in Mount Airy — top-decile yield for the area; either an underpriced asset or a hidden risk that comps aren't pricing in. Stress-test before assuming the spread holds.
Location & tenants
- Location reads 62/100 on livability (#473 in NC) — a middle-class / working-renter tenant base. Strengths: cost of living A+; Watch: crime D+, amenities F, commute F.
- Surry County Schools (rural): math 52% / reading 52% proficiency, ranked #60 of 178 in NC (top 34%) — acceptable for families but not a draw, mixed tenant base, ~2y average lease.
- Zoned schools: Pilot Mountain Elementary (math 57% / reading 57%, grade C+, #249 of 1,410 statewide, top 20%, 344 students, 58% FRL); Pilot Mountain Middle (math 47% / reading 53%, grade C, #113 of 475 statewide, top 25%, 454 students, 57% FRL); East Surry High (math 62% / reading 67%, grade B-, #164 of 535 statewide, top 32%, 594 students, 45% FRL) — zoned schools at 53% FRL track the district average.
- Market conditions: 213 active listings in the ZIP; 243 units permitted in Surry County in 2024 (0 in 5+ unit buildings).
- This rent runs 34% of the median local income ($46k/yr) — at the standard rent-burdened threshold; future hikes will face affordability resistance.
Forward outlook
- Local home prices are declining (-3.0%/yr); year-one equity from $761 of loan paydown is wiped out by about $3k of value loss. Plan a longer hold.
- Surry County population projected at -22% by 2050 — secular population decline; favor cash flow + early exit over multi-decade hold.
- At projected returns (-3.0% appreciation + 3.0% rent growth), your $31k cash investment doubles in ~8 years — after that, you're playing with house money.
Negotiation context
- Only 14 days on market — expect competitive offers; lowballing is unlikely to land.
- 2 sale attempts with the ask held roughly flat each time — persistent listings suggest the price (not the market) is what's stuck; bring a comps-based counter.
- Current owner paid $52k; list at $110k implies a 112% gain — meaningful room to come down on a strong offer.
Questions for the listing agent
- Is there a deadline driving the sale (1031 exchange, divorce, estate, relocation)? That informs how much negotiation room exists.
- Schools are D-rated, which usually means shorter tenancies and higher turnover. Who's the typical renter profile here, and what's been the actual vacancy rate?
- Crime grade is D in this area — have there been break-ins, vandalism, or insurance claims at this property in the last 3 years? What carrier currently insures it and at what premium?
- What's the average days-on-market for RENTAL listings here right now (not sales)? A rising rental-DOM trend means longer vacancies and softer asking-rent achievability than the comps imply.
- What's the recent tenant-quality profile in this submarket — average credit score on applications, eviction rate, late-payment / NSF rate, and stable-employment percentage? A property-management company in the area should have these aggregated.
- How much new for-sale + rental construction is in the pipeline within 1–3 miles? Heavy new supply typically softens prices + rents 12–24 months out; constrained supply supports both.
Investment metrics
- 1% rule
- 1.20% ✓
- Cap rate
- 10.69%
- Cash-on-cash
- 15.70%
- DSCR
- 1.70
- GRM
- 6.9
CMA / ARV
No comps found within radius.
Projected returns pro-forma
-3.0% appreciation · 3.0% rent growth · sell at horizon
- IRR
- 6.5%
- Equity multiple
- 1.25×
- Total profit
- $7,788
- Equity at exit
- $16,401
- IRR
- 15.8%
- Equity multiple
- 2.29×
- Total profit
- $39,619
- Equity at exit
- $9,511
Cash invested: $30,800 (down + closing). Projections, not guarantees.
Landlord ↔ Tenant lean methodology
- Overall (STATE)
- 85 Strongly Landlord-Friendly
- State North Carolina
- 85 Strongly Landlord-Friendly · R+3
- County
- — inherits STATE
- City
- — inherits STATE
ZIP-level market 27030
- Active inventory
- 213
- Price-to-rent
- 6.9×
Monthly cashflow live
- Estimated rent
- $1,325 medium interval (Pro) →
- Mortgage (P&I)
- −$577
- Tax from tax record
- −$21 /mo · $250/yr
- Insurance
- −$46
- HOA
- −$0
- Vacancy / Maint / Mgmt
- −$278
- Net cashflow
- $403
Break-even live
UW: 25.0% down · 7.5% · 30yr · 1.5% tax · 5.0% vac · 8.0% maint · 8.0% mgmt
Financing live
Cash to close
- Down payment
- $27,500
- Closing costs
- $3,300
- Reserves months
- —
- Total cash needed
- —
Loan-product check · same deal, 3 products live
Conventional
25% down · 7.5% · 30yr
- Down + closing
- —
- Monthly P&I
- —
- Monthly cashflow
- —
- DSCR
- —
- Eligible?
- —
Personal DTI + credit; lowest rate.
DSCR
20% down · 8.5% · 30yr
- Down + closing
- —
- Monthly P&I
- —
- Monthly cashflow
- —
- DSCR
- —
- Eligible?
- —
No personal income docs; deal must DSCR.
Hard money
10% down · 12.0% · 12mo
- Down + closing
- —
- Monthly P&I
- —
- Monthly cashflow
- —
- DSCR
- —
- Eligible?
- —
Short-term bridge; refi at stabilization.
Listing history 10 events
-
2026-06-19days on market $110,000 Active 14 DOM
-
2026-06-18days on market $110,000 Active 13 DOM
-
2026-06-17days on market $110,000 Active 12 DOM
-
2026-06-16days on market $110,000 Active 11 DOM
-
2026-06-15days on market $110,000 Active 10 DOM
-
2026-06-14days on market $110,000 Active 8 DOM
-
2026-06-12days on market $110,000 Active 7 DOM
-
2026-06-09days on market $110,000 Active 4 DOM
-
2026-06-09remarks 587-char remark
-
2026-06-09$110,000 Active 3 DOM
ⓘ Source: listings_history table (triggers on properties + properties_extension) + one-shot
backfill from property_details.listing_events for pre-trigger history.
Tax reassessment forecast NC · Resets to sale price
- Current annual tax
- $250 · $21/mo
- Projected year-2 tax
- $902 · $75/mo
- Expected delta
- +$652/yr (+$54/mo · 260.3%)
ⓘ Screening estimate from a state-policy table — verify with the county assessor before closing.
Climate risk First Street
- Flood 1/10 Low FEMA zone X (unshaded) · 0% chance over 30 yrs
- Wildfire 4/10 Moderate
- Heat 4/10 Moderate 7 d/yr ≥99°F today · 19 d/yr by 30 yrs out
- Wind 2/10 Low 2% chance of damaging wind over 30 yrs
- Air quality 1/10 Low 0 unhealthy d/yr today · 0 by 30 yrs out
Nearby sold comps map
Loading sold comps map…
Walkable amenities ~0.75 mi
Loading nearby amenities…
Taxation est. · year 1
- Rental income
- $15,896
- − Mortgage interest
- −$6,162
- − Property taxes
- −$250
- − Insurance
- −$550
- − Repairs & maintenance
- −$1,272
- − Management
- −$1,272
- − Depreciation
- −$3,200
- Taxable income
- $3,191
- Est. tax owed @ 24.0%
- −$766
- After-tax cash flow
- $4,070/yr
For passive investors: Depreciation is non-cash, so a rental often shows a tax loss while cash-flowing — sheltering income. Rental losses are passive: they offset passive income freely, and up to $25,000/yr can offset ordinary (W-2) income if you actively participate and your MAGI is under $100k (phasing out to $0 by $150k); unused losses carry forward. On sale, claimed depreciation is recaptured at up to 25%, and gains may owe capital-gains tax (a 1031 exchange can defer both). Figures are a year-1 estimate at your 24.0% rate — not tax advice; consult a CPA.
Schools (NCES district)
- District
- Surry County Schools
- NCES district ID
- 3704410
- Math proficiency
- 52% ▲ 4.00%
- Reading proficiency
- 52% ▲ 2.00%
- Median HH income
- $37,488
- Composite
- 43.26/100
- National rank
- #3054
- State rank
- #60 of 178 in NC
Livability — Mount Airy
- Score
- 62/100
- State rank
- #473
- US rank
- #17188
Category grades
Schools grade is shown separately in the Schools card above.
Census & demographics
- County
- Surry County · 36,241 people
- City population
- 36,241
- Metro
- Mount Airy, NC
- Population (ZIP)
- 36,241
- Household income
- $46,377
- Rent vs Own
- Severe rent burden
- 939.0
Population outlook (Surry County) Hauer SSP2
- Today (2025)
- 69,473 people
- By 2030
- 66,964 · -3.6%
- By 2040
- 60,967 · -12.2%
- By 2050
- 54,102 · -22.1%
- By 2075
- 38,806 · -44.1%
- By 2100
- 24,711 · -64.4%
Race, ethnicity, and origin ACS 2023
- Neighborhood character
- Predominantly White (83%)
- Race & ethnicity
- White 83% Hispanic / Latino 9% Two or more races 5% Black 5%
- Hispanic origin (detail)
- Mexican 7%
- Common ancestry
- Serbian 2% Slovak 2% Italian 1%
- Foreign-born
- 4% · Canada
- Languages at home
- 92% English-only · Spanish 6% Other Asian/Pacific 1%
Political lean MEDSL · Surry
- 2024 margin
- Solid R (+53.3) · D 23.0% · R 76.3%
- 2008→2024 swing
- -25.4pp toward R · 2008: -28.0pp · 2024: -53.3pp
- All cycles
- 2024: R+53.3 2020: R+51.4 2016: R+50.7 2012: R+36.9 2008: R+28.0
Not yet ingested
- Civics
- —
Market trends
- HPI YoY
- ▼ -132.64%
- Current HPI
- 177.1549
- Rent YoY
- —
- Metro
- Mount Airy, NC
- State GDP YoY
- ▲ 3.28%
- F500 in state
- 26
Industry mix (Fortune 500 HQ in NC)
| Industry | F500 HQs | Revenue |
|---|---|---|
| Financial Services | 2 | $213B |
|
||
| Retail | 2 | $95B |
|
||
| Industrial Conglomerate | 1 | $38B |
|
||
| Metals / Steel | 1 | $35B |
|
||
| Utilities | 1 | $30B |
|
||
| Industrial Machinery | 1 | $19B |
|
||
Price history
+129.2% since first listed5 events — show timeline
- 2026-06-08 Relisted — Triad MLS
- 2026-04-20 Delisted — Triad MLS
- 2026-04-16 Listed $110,000 Triad MLS
- 2007-05-01 Sold (Public Records) $52,000 Public Records
- 2006-06-01 Sold (Public Records) $48,000 Public Records
Property tax history
+1.0%/yrLatest (2025): $250 · +15.0% YoY. Source: county tax records.
Cash-flow waterfall
monthlySold comps — $/sqft
last 12 mo · ≤1 miLoading sold comps…