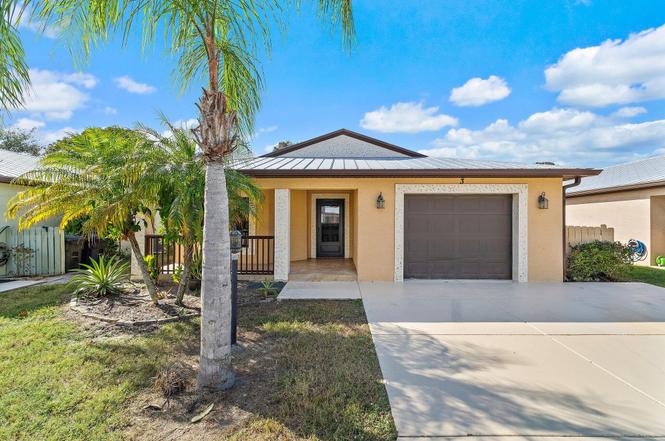
3 S Granada Ln · Port St. Lucie, FL
Flood risk 1/10 · Minimal
- FEMA flood zone
- X (unshaded)
- Chance of flooding over 30 yrs
- 0.0%
- Est. flood insurance / yr
- $507 – $1,088
Fire risk 4/10 · Minor
- Est. fire insurance / yr
- $947 – $1,759
Heat risk 10/10 · Severe
- Hot days now (above 106°F)
- 7 days/yr
- Hot days in 30 yrs
- 24 days/yr
Wind risk 10/10 · Severe
- Chance of severe wind over 30 yrs
- 99.0%
Air-quality risk 2/10 · Minimal
- Unhealthy air days now
- 1 days/yr
- Unhealthy air days in 30 yrs
- 1 days/yr
Risk factors via First Street. Map © Google.
Why this score? — see what drove the B grade
The composite is a weighted blend of 9 inputs, each scored 0–100. Each bar is that input's sub-score; the figure is the points it added to the 100-point composite (weight × sub-score).
- Cash flow +30.0/30.0
- ARV discount +14.6/15.0
- DSCR +10.0/10.0
- 1% rule +7.2/10.0
- Schools +3.7/10.0
- Rent growth +3.0/5.0
- Livability +2.5/5.0
- Condition / age +2.5/5.0
- Appreciation +0.0/10.0
$179,800
🖨 Deal sheet 📄 Offer letter ✓ Due diligence
Listing remarks MLS
PARTLY FURNISHED SINGLEWIDE WITH CARPORT.GOOD CONDITION.QUIET AREA.LOCK BOX ,CALL OFFICE.
Key facts
- Metal roof
- Lake view
- Tile flooring
Tags
Property features AI
Finance
- HOA & community: Senior community; Pets allowed with possible restrictions and limits
Exterior
- Parking: Garage with garage door opener; 1 covered parking space; 1 garage space
- Utilities: Public water; Public sewer; Three-phase electric; Cable available
- Home design: Single-family residence; One story; Facing east; Resale condition
- Construction: Block/Concrete/CBS construction
- Exterior features: Waterfront property; Entry at main living level
Interior
- Kitchen: Electric range; Dishwasher; Microwave; Refrigerator; Electric water heater
- Bedrooms: 2 main-level bedrooms
- Bathrooms: 2 full bathrooms (both on main level)
- Heating & cooling: Central electric heating; Central electric cooling (central air)
- Interior features: Cathedral and vaulted ceilings; Walk-in closet(s); Split bedroom layout
- Laundry & utility: Laundry inside
Neighborhood map
What this means for you Summary
Snapshot
- This is a 3-bed/2.0-bath single-family listed at $180k.
Deal economics
- At list price, monthly cash flow is $674 ($8k/yr) — positive.
- The deal already cash-flows at list — no discount required.
- Meets the 1% rule at list price ($2k rent vs $180k).
- Recommended offer: $158k (12.0% below list) — sets the bar for market timing.
- Cap rate 10.8% vs local median 3.9% in Port St. Lucie — top-decile yield for the area; either an underpriced asset or a hidden risk that comps aren't pricing in. Stress-test before assuming the spread holds.
Location & tenants
- Location reads: area grade B — affects rentability + tenant quality, not the cash-flow math above.
- St. Lucie (urban): math 40% / reading 48% proficiency, ranked #51 of 73 in FL (top 70%) — families likely to look elsewhere, expect single-tenant / working-renter base with shorter leases.
- Zoned schools: Savanna Ridge Elementary School (math 40% / reading 45%, grade F, #1,383 of 2,144 statewide, top 65%, 452 students, 75% FRL); Port St. Lucie High School (math 21% / reading 43%, grade F, #415 of 667 statewide, top 63%, 1,748 students, 67% FRL).
- Market conditions: Rents rising (+1.9%/yr); 639 active listings in the ZIP; 10 comparable units currently listed for rent nearby; rentals at typical pace (median 14d on market — plan ~3-4 weeks tenant-placement turnaround); 4,868 units permitted in St. Lucie County in 2024 (268 in 5+ unit buildings).
- This rent runs 43% of the median local income ($62k/yr) — at the standard rent-burdened threshold; future hikes will face affordability resistance.
Forward outlook
- Local home prices are declining (-3.0%/yr); year-one equity from $1k of loan paydown is wiped out by about $5k of value loss. Plan a longer hold.
- St. Lucie County population projected at +20% by 2050 — long-run rental-demand tailwind backs the buy-and-hold thesis.
- At projected returns (-3.0% appreciation + 1.9% rent growth), your $50k cash investment doubles in ~9 years — after that, you're playing with house money.
Negotiation context
- It's been on market 182 days — a 12% lower offer ($158k) is reasonable based on typical stale-listing flexibility.
- 2 sale attempts since 27y ago; this cycle's ask has dropped $70k (28%) from the opening price — seller is motivated, your offer sets the floor, not the list.
- Current owner paid $4k; list at $180k implies a 4181% gain — meaningful room to come down on a strong offer.
Risks & watch-outs
- Climate carrying-cost: severe wind risk, 99% chance of damaging wind over 30y; extreme-heat days projected 7→24/yr by 2055 (HVAC capex compounding) — expect insurance premiums to compound above CPI over the hold.
Questions for the listing agent
- It's been on market 182 days. Have you received any prior offers? Is the seller open to a 12% concession, seller financing, or rate buy-down credit?
- Why hasn't it sold? Are there any deal-killer items the seller is aware of (foundation, flood, title, zoning, code violations)?
- Is there a deadline driving the sale (1031 exchange, divorce, estate, relocation)? That informs how much negotiation room exists.
- What's the average days-on-market for RENTAL listings here right now (not sales)? A rising rental-DOM trend means longer vacancies and softer asking-rent achievability than the comps imply.
- What's the recent tenant-quality profile in this submarket — average credit score on applications, eviction rate, late-payment / NSF rate, and stable-employment percentage? A property-management company in the area should have these aggregated.
- How much new for-sale + rental construction is in the pipeline within 1–3 miles? Heavy new supply typically softens prices + rents 12–24 months out; constrained supply supports both.
Investment metrics
- 1% rule
- 1.22% ✓
- Cap rate
- 10.79%
- Cash-on-cash
- 16.06%
- DSCR
- 1.71
- GRM
- 6.8
CMA / ARV
- ARV (on-the-fly)
- $213,297
- Comps found
- 8
Show comp detail 8 sales within ~0.75 mi
| Address | Dist | Beds/Ba | Sqft | Sold | Price | $/sf | Match |
|---|---|---|---|---|---|---|---|
| 9 Kachina Ln | 0.15mi | 2/2.0 (-1) | 1,462 (+1%) | 2mo | $259,000 | $177 | 85 |
| 53 El Camino Real | 0.23mi | 2/2.0 (-1) | 1,462 (+1%) | 1mo | $259,000 | $177 | 82 |
| 39 SE Flamenco Way | 0.05mi | 2/2.0 (-1) | 1,357 (-6%) | 6mo | $200,000 | $147 | 77 |
| 45 Florida Way | 0.40mi | 2/2.0 (-1) | 1,451 (0%) | 2mo | $165,000 | $114 | 75 |
| 11 Nogales Way | 0.27mi | 2/2.0 (-1) | 1,451 (0%) | 15mo | $205,000 | $141 | 70 |
| 8 Golf Dr | 0.42mi | 2/2.0 (-1) | 1,427 (-2%) | 13mo | $160,000 | $112 | 62 |
| 8241 Maidencane Pl | 0.13mi | 3/2.0 | 1,656 (+14%) | 12mo | $360,000 | $217 | 60 |
| 45 Huarte Way | 0.40mi | 2/2.0 (-1) | 1,319 (-9%) | 13mo | $142,000 | $108 | 50 |
Match score weights: distance 35% · size 25% · config 20% · recency 20%. Top-matched comps best support the ARV.
Projected returns pro-forma
-3.0% appreciation · 1.92% rent growth · sell at horizon
- IRR
- 5.9%
- Equity multiple
- 1.23×
- Total profit
- $11,338
- Equity at exit
- $26,809
- IRR
- 14.3%
- Equity multiple
- 2.10×
- Total profit
- $55,344
- Equity at exit
- $15,546
Cash invested: $50,344 (down + closing). Projections, not guarantees.
Landlord ↔ Tenant lean methodology
- Overall (STATE)
- 87 Strongly Landlord-Friendly
- State Florida
- 87 Strongly Landlord-Friendly · R+3
- County
- — inherits STATE
- City
- — inherits STATE
ZIP-level market 34952
- Home prices YoY
- -29.6%
- Rents YoY
- 1.9%
- Active inventory
- 639
- Price-to-rent
- 6.8×
Monthly cashflow live
- Estimated rent
- $2,189 high interval (Pro) →
- Mortgage (P&I)
- −$943
- Tax from tax record
- −$38 /mo · $451/yr
- Insurance
- −$75
- HOA
- −$0
- Vacancy / Maint / Mgmt
- −$460
- Net cashflow
- $674
Break-even live
UW: 25.0% down · 7.5% · 30yr · 1.5% tax · 5.0% vac · 8.0% maint · 8.0% mgmt
Financing live
Cash to close
- Down payment
- $44,950
- Closing costs
- $5,394
- Reserves months
- —
- Total cash needed
- —
Loan-product check · same deal, 3 products live
Conventional
25% down · 7.5% · 30yr
- Down + closing
- —
- Monthly P&I
- —
- Monthly cashflow
- —
- DSCR
- —
- Eligible?
- —
Personal DTI + credit; lowest rate.
DSCR
20% down · 8.5% · 30yr
- Down + closing
- —
- Monthly P&I
- —
- Monthly cashflow
- —
- DSCR
- —
- Eligible?
- —
No personal income docs; deal must DSCR.
Hard money
10% down · 12.0% · 12mo
- Down + closing
- —
- Monthly P&I
- —
- Monthly cashflow
- —
- DSCR
- —
- Eligible?
- —
Short-term bridge; refi at stabilization.
Rent comps 10 comps
| Address | Beds | Baths | Sqft | Rent | $/sqft | DOM | Units | Dist |
|---|---|---|---|---|---|---|---|---|
| 1900 Bella Vista Way Port Saint Lucie, FL | 1.0–2.0 | 1.0–2.0 | 995 | $1,764 | $1.77 | 14d | 15 | 0.36mi |
| 71 W Caribbean Port St. Lucie, FL | 2.0 | 2.0 | 1417 | $1,700 | $1.20 | 23d | 1 | 1.14mi |
| 1810 SE Pinewood Trl Port Saint Lucie, FL | 1.0–2.0 | 1.0–2.0 | 1013 | $2,055 | $2.03 | 14d | 7 | 1.16mi |
| 7700 Pine Lakes Blvd Port Saint Lucie, FL | 1.0–3.0 | 1.0–2.0 | 1022 | $2,212 | $2.16 | 14d | 16 | 1.27mi |
| 3784 Sapodilla Ct Port Saint Lucie, FL | 2.0 | 2.0 | 1121 | $2,300 | $2.05 | 23d | 1 | 1.33mi |
| 1811 SE Walton Lakes Dr Port Saint Lucie, FL | 2.0 | 1.0–2.0 | 1117 | $1,926 | $1.72 | 14d | 6 | 1.36mi |
| 805 SE Cavern Ave Port Saint Lucie, FL | 3.0 | 2.0 | 1732 | $2,500 | $1.44 | 23d | 1 | 1.41mi |
| 124 E Arbor Ave Port Saint Lucie, FL | 3.0 | 1.0 | 964 | $2,550 | $2.65 | 14d | 1 | 1.42mi |
| 730 SE White Ave Port Saint Lucie, FL | 2.0 | 2.0 | 1386 | $10,000 | $7.22 | 23d | 1 | 1.43mi |
| 1455 SE Colchester Cir Port Saint Lucie, FL | 2.0 | 2.0 | 921 | $1,795 | $1.95 | 14d | 1 | 1.47mi |
Listing history 20 events
-
2026-06-17days on market $179,800 Active 182 DOM
-
2026-06-16days on market $179,800 Active 181 DOM
-
2026-06-10days on market $179,800 Active 180 DOM
-
2026-06-09days on market $179,800 Active 179 DOM
-
2026-06-08days on market $179,800 Active 178 DOM
-
2026-06-07days on market $179,800 Active 177 DOM
-
2026-06-05days on market $179,800 Active 174 DOM
-
2026-06-03days on market $179,800 Active 173 DOM
-
2026-06-02days on market $179,800 Active 172 DOM
-
2026-06-01days on market $179,800 Active 171 DOM
-
2026-05-31days on market $179,800 Active 170 DOM
-
2026-05-30days on market $179,800 Active 169 DOM
-
2026-04-23price $179,800
-
2026-03-27price $190,000
-
2026-02-12price $205,000
-
2026-01-19price $230,000
-
2025-12-12$250,000 Active
-
1999-07-29soldstatus $4,200 89-char remark
Show marketing remark (89 chars)
PARTLY FURNISHED SINGLEWIDE WITH CARPORT.GOOD CONDITION.QUIET AREA.LOCK BOX ,CALL OFFICE.
-
1999-07-16historical 89-char remark
Show marketing remark (89 chars)
PARTLY FURNISHED SINGLEWIDE WITH CARPORT.GOOD CONDITION.QUIET AREA.LOCK BOX ,CALL OFFICE.
-
1999-01-25$7,000 89-char remark
Show marketing remark (89 chars)
PARTLY FURNISHED SINGLEWIDE WITH CARPORT.GOOD CONDITION.QUIET AREA.LOCK BOX ,CALL OFFICE.
ⓘ Source: listings_history table (triggers on properties + properties_extension) + one-shot
backfill from property_details.listing_events for pre-trigger history.
Tax reassessment forecast FL · Resets to sale price
- Current annual tax
- $451 · $38/mo
- Projected year-2 tax
- $1,492 · $124/mo
- Expected delta
- +$1,041/yr (+$87/mo · 231.0%)
ⓘ Screening estimate from a state-policy table — verify with the county assessor before closing.
Climate risk First Street
- Flood 1/10 Low FEMA zone X (unshaded) · 0% chance over 30 yrs
- Wildfire 4/10 Moderate
- Heat 10/10 Extreme 7 d/yr ≥106°F today · 24 d/yr by 30 yrs out
- Wind 10/10 Extreme 99% chance of damaging wind over 30 yrs
- Air quality 2/10 Low 1 unhealthy d/yr today · 1 by 30 yrs out
Nearby sold comps map
Loading sold comps map…
Walkable amenities ~0.75 mi
Loading nearby amenities…
Taxation est. · year 1
- Rental income
- $26,265
- − Mortgage interest
- −$10,072
- − Property taxes
- −$451
- − Insurance
- −$899
- − Repairs & maintenance
- −$2,101
- − Management
- −$2,101
- − Depreciation
- −$5,231
- Taxable income
- $5,410
- Est. tax owed @ 24.0%
- −$1,298
- After-tax cash flow
- $6,786/yr
For passive investors: Depreciation is non-cash, so a rental often shows a tax loss while cash-flowing — sheltering income. Rental losses are passive: they offset passive income freely, and up to $25,000/yr can offset ordinary (W-2) income if you actively participate and your MAGI is under $100k (phasing out to $0 by $150k); unused losses carry forward. On sale, claimed depreciation is recaptured at up to 25%, and gains may owe capital-gains tax (a 1031 exchange can defer both). Figures are a year-1 estimate at your 24.0% rate — not tax advice; consult a CPA.
Schools (NCES district)
- District
- St. Lucie
- NCES district ID
- 1201770
- Math proficiency
- 40% ▼ -11.00%
- Reading proficiency
- 48% ▼ -4.00%
- Median HH income
- $44,737
- Composite
- 37.28/100
- National rank
- #4449
- State rank
- #51 of 73 in FL
Livability — Port St. Lucie
No livability data for this city. (Only ~50 U.S. cities are tracked.)
Census & demographics
- County
- Saint Lucie County · 337,150 people
- City population
- 221,051
- Metro
- Port St. Lucie, FL
- Population (ZIP)
- 42,655
- Household income
- $61,628
- Rent vs Own
- Severe rent burden
- 1759.0
Population outlook (St. Lucie County) Hauer SSP2
- Today (2025)
- 338,016 people
- By 2030
- 355,687 · +5.2%
- By 2040
- 385,521 · +14.1%
- By 2050
- 406,106 · +20.1%
- By 2075
- 441,054 · +30.5%
- By 2100
- 436,885 · +29.2%
Race, ethnicity, and origin ACS 2023
- Neighborhood character
- Diverse neighborhood (Simpson 0.57)
- Race & ethnicity
- White 62% Hispanic / Latino 19% Two or more races 14% Black 10% Asian 3%
- Hispanic origin (detail)
- Mexican 4% Puerto Rican 4% Cuban 2% Dominican 2%
- Common ancestry
- Romanian 3% Lithuanian 2% Hispanic 1%
- Foreign-born
- 18% · Canada, Jamaica, China
- Languages at home
- 76% English-only · Spanish 16% French/Haitian/Cajun 3% Tagalog/Filipino 2%
Political lean MEDSL · St. Lucie
- 2024 margin
- Lean R (+9.1) · D 45.1% · R 54.2%
- 2008→2024 swing
- -21.2pp toward R · 2008: 12.1pp · 2024: -9.1pp
- All cycles
- 2024: R+9.1 2020: R+1.6 2016: R+2.5 2012: D+7.9 2008: D+12.1
Not yet ingested
- Civics
- —
Market trends
- HPI YoY
- ▼ -155.80%
- Current HPI
- 371.0573
- Rent YoY
- ▲ 1.92%
- Metro
- Port St. Lucie, FL
- State GDP YoY
- ▲ 3.28%
- F500 in state
- 36
Industry mix (Fortune 500 HQ in FL)
| Industry | F500 HQs | Revenue |
|---|---|---|
| Industrial Technology | 2 | $29B |
|
||
| Insurance | 2 | $17B |
|
||
| Retail | 1 | $60B |
|
||
| Technology Distribution | 1 | $58B |
|
||
| Homebuilding | 1 | $35B |
|
||
| Technology Manufacturing | 1 | $35B |
|
||
Price history
+2468.6% since first listed8 events — show timeline
- 2026-04-23 Price Changed $179,800 Beaches MLS
- 2026-03-27 Price Changed $190,000 Beaches MLS
- 2026-02-12 Price Changed $205,000 Beaches MLS
- 2026-01-19 Price Changed $230,000 Beaches MLS
- 2025-12-12 Listed $250,000 Beaches MLS
- 1999-07-29 Sold (MLS) $4,200 Beaches MLS
- 1999-07-16 Listing Removed — Beaches MLS
- 1999-01-25 Listed $7,000 Beaches MLS
Property tax history
+8.2%/yrLatest (2025): $451 · +8.5% YoY. Source: county tax records.
Cash-flow waterfall
monthlySold comps — $/sqft
last 12 mo · ≤1 miLoading sold comps…