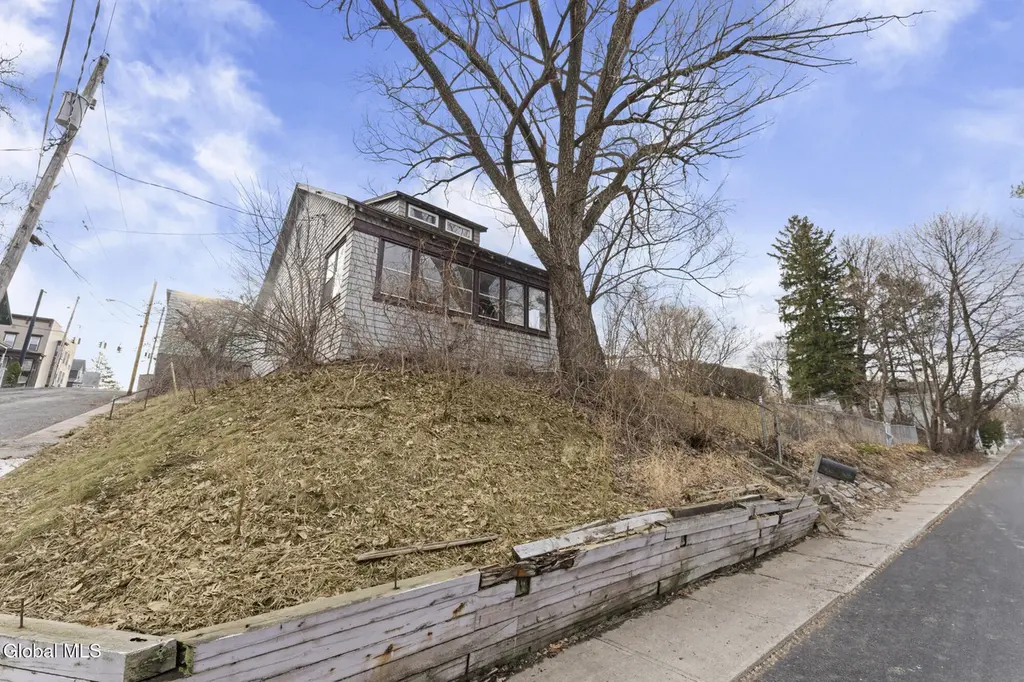
1498 2nd St · Rensselaer, NY
Flood risk 1/10 · Minimal
- FEMA flood zone
- X
- Chance of flooding over 30 yrs
- 0.0%
- Est. flood insurance / yr
- $473 – $860
Fire risk 3/10 · Minor
- Est. fire insurance / yr
- $691 – $1,283
Heat risk 4/10 · Minor
- Hot days now (above 97°F)
- 7 days/yr
- Hot days in 30 yrs
- 16 days/yr
Wind risk 3/10 · Minor
- Chance of severe wind over 30 yrs
- 6.0%
Air-quality risk 2/10 · Minimal
- Unhealthy air days now
- 0 days/yr
- Unhealthy air days in 30 yrs
- 1 days/yr
Risk factors via First Street. Map © Google.
Why this score? — see what drove the B+ grade
The composite is a weighted blend of 9 inputs, each scored 0–100. Each bar is that input's sub-score; the figure is the points it added to the 100-point composite (weight × sub-score).
- Cash flow +30.0/30.0
- ARV discount +15.0/15.0
- 1% rule +10.0/10.0
- DSCR +10.0/10.0
- Livability +3.9/5.0
- Rent growth +2.7/5.0
- Schools +2.7/10.0
- Condition / age +2.5/5.0
- Appreciation +0.0/10.0
$129,900
🖨 Deal sheet (PDF) 📄 Offer letter ✓ Due diligence
Listing remarks MLS
Fix and Save opportunity on a corner lot in Rensselaer. 1498 Second Street offers 4 bedrooms, 1 full bath, and 1,166 SF ready for updates. Layout features a formal dining room, first floor office, and a small deck overlooking the yard. Public water and sewer. Property will not qualify for traditional financing and is best suited for cash buyers or rehab loans. Ideal for investors, flippers, or buyers looking to restore and add value. Property sold as is.
Key facts
- First floor office
- Small deck
- Public sewer
Tags
Neighborhood map
What this means for you Summary
Snapshot
- This is a 4-bed/1.0-bath single-family listed at $130k.
Deal economics
- At list price, monthly cash flow is $697 ($8k/yr) — positive.
- The deal already cash-flows at list — no discount required.
- Meets the 1% rule at list price ($2k rent vs $130k).
- Recommended offer: $118k (9.0% below list) — sets the bar for market timing.
- Cap rate 12.7% vs local median 5.0% in Rensselaer — top-decile yield for the area; either an underpriced asset or a hidden risk that comps aren't pricing in. Stress-test before assuming the spread holds.
Location & tenants
- Location reads 77/100 on livability (#191 in NY, #2,967 nationally) — a middle-class / working-renter tenant base. Strengths: commute A+, housing A+, health & safety A+; Watch: schools C-, crime D+.
- Rensselaer City School District (suburban): math 28% / reading 34% proficiency, ranked #574 of 590 in NY (top 97%) — families likely to look elsewhere, expect single-tenant / working-renter base with shorter leases.
- Market conditions: Rents flat; 102 active listings in the ZIP; 8 comparable units currently listed for rent nearby; rentals at typical pace (median 25d on market — plan ~3-4 weeks tenant-placement turnaround); solid renter incomes; 405 units permitted in Rensselaer County in 2024 (224 in 5+ unit buildings).
Forward outlook
- Local home prices are declining (-3.0%/yr); year-one equity from $898 of loan paydown is wiped out by about $4k of value loss. Plan a longer hold.
- Rensselaer County population projected to shrink 6% by 2050 — rents likely to lag national; underwrite the cash flow, not the appreciation.
- At projected returns (-3.0% appreciation + 0.9% rent growth), your $36k cash investment doubles in ~7 years — after that, you're playing with house money.
Negotiation context
- It's been on market 97 days — a 9% lower offer ($118k) is reasonable based on typical stale-listing flexibility.
- 4 sale attempts since 24y ago; this cycle's ask has dropped $45k (26%) from the opening price — seller is motivated, your offer sets the floor, not the list.
- Current owner paid $112k; 16% above their basis — modest negotiation headroom, anchor on the comps not their cost.
Risks & watch-outs
- Watch-outs: property tax is 2.9% of price; built in 1907 — expect roof / HVAC / electrical / plumbing capex.
Questions for the listing agent
- It's been on market 97 days. Have you received any prior offers? Is the seller open to a 9% concession, seller financing, or rate buy-down credit?
- Built in 1907 — when were the roof, HVAC, electrical panel, plumbing, and water heater last replaced?
- Property tax is high relative to price — has the assessment been appealed recently, and will the sale trigger a re-assessment?
- Why hasn't it sold? Are there any deal-killer items the seller is aware of (foundation, flood, title, zoning, code violations)?
- Is there a deadline driving the sale (1031 exchange, divorce, estate, relocation)? That informs how much negotiation room exists.
- Crime grade is D in this area — have there been break-ins, vandalism, or insurance claims at this property in the last 3 years? What carrier currently insures it and at what premium?
- What's the average days-on-market for RENTAL listings here right now (not sales)? A rising rental-DOM trend means longer vacancies and softer asking-rent achievability than the comps imply.
- What's the recent tenant-quality profile in this submarket — average credit score on applications, eviction rate, late-payment / NSF rate, and stable-employment percentage? A property-management company in the area should have these aggregated.
- How much new for-sale + rental construction is in the pipeline within 1–3 miles? Heavy new supply typically softens prices + rents 12–24 months out; constrained supply supports both.
Investment metrics
- 1% rule
- 1.70% ✓
- Cap rate
- 12.73%
- Cash-on-cash
- 23.00%
- DSCR
- 2.02
- GRM
- 4.9
CMA / ARV
- ARV (median comp)
- $228,021
- List price
- $129,900
- Delta
- -43.03%
- Verdict
- UNDERPRICED
- Comps
- 20 within 1.0 mi
Show comp detail 12 sales within ~0.75 mi
| Address | Dist | Beds/Ba | Sqft | Sold | Price | $/sf | Match |
|---|---|---|---|---|---|---|---|
| 1512 Broadway | 0.11mi | 3/1.0 (-1) | 1,272 (+9%) | 1mo | $215,000 | $169 | 74 |
| 1912 8th St | 0.47mi | 4/1.5 | 1,181 (+1%) | 4mo | $301,500 | $255 | 71 |
| 1212 3rd St | 0.31mi | 3/1.0 (-1) | 1,114 (-4%) | 6mo | $113,000 | $101 | 68 |
| 35 Pine St | 0.32mi | 3/1.0 (-1) | 1,205 (+3%) | 9mo | $259,900 | $216 | 67 |
| 1561 5th St | 0.15mi | 3/2.0 (-1) | 1,148 (-2%) | 18mo | $244,999 | $213 | 67 |
| 1822 7th St | 0.41mi | 3/1.0 (-1) | 1,097 (-6%) | 6mo | $219,900 | $200 | 61 |
| 57 Glen St | 0.39mi | 3/1.5 (-1) | 1,195 (+2%) | 13mo | $228,000 | $191 | 59 |
| 1987 10th St | 0.53mi | 3/1.0 (-1) | 1,152 (-1%) | 16mo | $205,000 | $178 | 55 |
| 1015 1st St | 0.46mi | 3/1.5 (-1) | 1,240 (+6%) | 10mo | $175,000 | $141 | 53 |
| 1929 9th St | 0.50mi | 3/1.0 (-1) | 1,096 (-6%) | 13mo | $230,000 | $210 | 51 |
| 1927 9th St | 0.49mi | 3/1.0 (-1) | 1,100 (-6%) | 18mo | $170,000 | $155 | 47 |
| 2 Patten Ave | 0.34mi | 3/1.0 (-1) | 1,010 (-13%) | 12mo | $171,000 | $169 | 46 |
Match score weights: distance 35% · size 25% · config 20% · recency 20%. Top-matched comps best support the ARV.
Projected returns pro-forma
-3.0% appreciation · 0.9% rent growth · sell at horizon
- IRR
- 13.4%
- Equity multiple
- 1.52×
- Total profit
- $18,893
- Equity at exit
- $19,369
- IRR
- 20.4%
- Equity multiple
- 2.54×
- Total profit
- $56,110
- Equity at exit
- $11,231
Cash invested: $36,372 (down + closing). Projections, not guarantees.
Landlord ↔ Tenant lean methodology
- Overall (STATE)
- 15 Strongly Tenant-Friendly
- State New York
- 15 Strongly Tenant-Friendly · D+10
- County
- — inherits STATE
- City
- — inherits STATE
ZIP-level market 12144
- Home prices YoY
- -33.4%
- Rents YoY
- 0.9%
- Active inventory
- 102
- Price-to-rent
- 4.9×
Monthly cashflow live
- Estimated rent
- $2,215 high interval (Pro) →
- Mortgage (P&I)
- −$681
- Tax from tax record
- −$317 /mo · $3,806/yr
- Insurance
- −$54
- HOA
- −$0
- Vacancy / Maint / Mgmt
- −$465
- Net cashflow
- $697
Break-even live
Sensitivity live
| Price | -10% $771 | -5% $734 | +0% $697 | +5% $660 | +10% $624 |
|---|---|---|---|---|---|
| Rent | -10% $522 | -5% $610 | +0% $697 | +5% $785 | +10% $872 |
| Rate | -1.0pp $762 | -0.5pp $730 | base $697 | +0.5pp $663 | +1.0pp $629 |
UW: 25.0% down · 7.5% · 30yr · 1.5% tax · 5.0% vac · 8.0% maint · 8.0% mgmt
Financing live
Cash to close
- Down payment
- $32,475
- Closing costs
- $3,897
- Reserves months
- —
- Total cash needed
- —
Loan-product check · same deal, 3 products live
Conventional
25% down · 7.5% · 30yr
- Down + closing
- —
- Monthly P&I
- —
- Monthly cashflow
- —
- DSCR
- —
- Eligible?
- —
Personal DTI + credit; lowest rate.
DSCR
20% down · 8.5% · 30yr
- Down + closing
- —
- Monthly P&I
- —
- Monthly cashflow
- —
- DSCR
- —
- Eligible?
- —
No personal income docs; deal must DSCR.
Hard money
10% down · 12.0% · 12mo
- Down + closing
- —
- Monthly P&I
- —
- Monthly cashflow
- —
- DSCR
- —
- Eligible?
- —
Short-term bridge; refi at stabilization.
Rent comps 8 comps
| Address | Beds | Baths | Sqft | Rent | $/sqft | DOM | Units | Dist |
|---|---|---|---|---|---|---|---|---|
| 1444 2nd St Unit 2 Rensselaer, NY | 4.0 | 1.0 | 950 | $1,900 | $2.00 | 45d | 1 | 0.05mi |
| 945 Broadway Rensselaer, NY | 3.0 | 1.0 | 1200 | $1,650 | $1.38 | 24d | 1 | 0.50mi |
| 9 St Josephs Ter Albany, NY | 3.0 | 2.0 | 1000 | $1,850 | $1.85 | 45d | 1 | 1.00mi |
| 168 S Pearl St Albany, NY | 3.0 | 1.5 | 1044 | $1,800 | $1.72 | 24d | 1 | 1.32mi |
| 2 River Chase Rensselaer, NY | 1.0–3.0 | 1.0–2.0 | 1348 | $2,615 | $1.94 | 15d | 34 | 1.38mi |
| 282 Livingston Ave Albany, NY | 3.0 | 1.5 | 1464 | $2,400 | $1.64 | 24d | 1 | 1.44mi |
| 254 Sheridan Ave Unit 2 Albany, NY | 3.0 | 1.0 | 900 | $1,300 | $1.44 | 24d | 1 | 1.45mi |
| 628 N Pearl St Menands, NY | 3.0 | 1.0 | 1088 | $1,500 | $1.38 | 45d | 1 | 1.46mi |
Listing history 30 events
-
2026-06-21days on market $129,900 Active 97 DOM
-
2026-06-19price $129,900 Active 94 DOM
-
2026-06-18days on market $149,900 Active 94 DOM
-
2026-06-17days on market $149,900 Active 93 DOM
-
2026-06-16days on market $149,900 Active 92 DOM
-
2026-06-15days on market $149,900 Active 91 DOM
-
2026-06-14days on market $149,900 Active 89 DOM
-
2026-06-10days on market $149,900 Active 86 DOM
-
2026-06-09days on market $149,900 Active 85 DOM
-
2026-06-08days on market $149,900 Active 84 DOM
-
2026-06-07days on market $149,900 Active 83 DOM
-
2026-06-05days on market $149,900 Active 80 DOM
-
2026-06-03days on market $149,900 Active 79 DOM
-
2026-06-02days on market $149,900 Active 78 DOM
-
2026-06-01days on market $149,900 Active 77 DOM
-
2026-05-31days on market $149,900 Active 76 DOM
-
2026-05-31days on market $149,900 Active 75 DOM
-
2026-05-14price $149,900 458-char remark
Show marketing remark (458 chars)
Fix and Save opportunity on a corner lot in Rensselaer. 1498 Second Street offers 4 bedrooms, 1 full bath, and 1,166 SF ready for updates. Layout features a formal dining room, first floor office, and a small deck overlooking the yard. Public water and sewer. Property will not qualify for traditional financing and is best suited for cash buyers or rehab loans. Ideal for investors, flippers, or buyers looking to restore and add value. Property sold as is.
-
2026-04-17price $164,900 458-char remark
Show marketing remark (458 chars)
Fix and Save opportunity on a corner lot in Rensselaer. 1498 Second Street offers 4 bedrooms, 1 full bath, and 1,166 SF ready for updates. Layout features a formal dining room, first floor office, and a small deck overlooking the yard. Public water and sewer. Property will not qualify for traditional financing and is best suited for cash buyers or rehab loans. Ideal for investors, flippers, or buyers looking to restore and add value. Property sold as is.
-
2026-03-13$174,900 Active 458-char remark
Show marketing remark (458 chars)
Fix and Save opportunity on a corner lot in Rensselaer. 1498 Second Street offers 4 bedrooms, 1 full bath, and 1,166 SF ready for updates. Layout features a formal dining room, first floor office, and a small deck overlooking the yard. Public water and sewer. Property will not qualify for traditional financing and is best suited for cash buyers or rehab loans. Ideal for investors, flippers, or buyers looking to restore and add value. Property sold as is.
-
2026-02-18historical
-
2025-08-20$175,000 Active
-
2007-08-22soldstatus $112,270
-
2007-08-17soldstatus $109,000
-
2007-06-26historical
-
2007-03-31$114,000
-
2002-08-27soldstatus $73,000
-
2002-08-22soldstatus $73,000
-
2002-07-05historical
-
2002-04-29$76,400
ⓘ Source: listings_history table (triggers on properties + properties_extension) + one-shot
backfill from property_details.listing_events for pre-trigger history.
Tax reassessment forecast NY · Partial reset (capped growth)
- Current annual tax
- $3,806 · $317/mo
- Projected year-2 tax
- $3,806 · $317/mo
- Expected delta
- $0/yr ($0/mo · 0.0%)
ⓘ Screening estimate from a state-policy table — verify with the county assessor before closing.
Climate risk First Street
- Flood 1/10 Low FEMA zone X · 0% chance over 30 yrs
- Wildfire 3/10 Moderate
- Heat 4/10 Moderate 7 d/yr ≥97°F today · 16 d/yr by 30 yrs out
- Wind 3/10 Moderate 6% chance of damaging wind over 30 yrs
- Air quality 2/10 Low 0 unhealthy d/yr today · 1 by 30 yrs out
Nearby sold comps map
Loading sold comps map…
Walkable amenities ~0.75 mi
Loading nearby amenities…
Taxation est. · year 1
- Rental income
- $26,576
- − Mortgage interest
- −$7,276
- − Property taxes
- −$3,806
- − Insurance
- −$650
- − Repairs & maintenance
- −$2,126
- − Management
- −$2,126
- − Depreciation
- −$3,779
- Taxable income
- $6,813
- Est. tax owed @ 24.0%
- −$1,635
- After-tax cash flow
- $6,730/yr
For passive investors: Depreciation is non-cash, so a rental often shows a tax loss while cash-flowing — sheltering income. Rental losses are passive: they offset passive income freely, and up to $25,000/yr can offset ordinary (W-2) income if you actively participate and your MAGI is under $100k (phasing out to $0 by $150k); unused losses carry forward. On sale, claimed depreciation is recaptured at up to 25%, and gains may owe capital-gains tax (a 1031 exchange can defer both). Figures are a year-1 estimate at your 24.0% rate — not tax advice; consult a CPA.
Schools (NCES district)
- District
- Rensselaer City School District
- NCES district ID
- 3624450
- Math proficiency
- 28% ▼ -2.00%
- Reading proficiency
- 34% ▼ -1.00%
- Median HH income
- $48,665
- Composite
- 26.89/100
- National rank
- #7096
- State rank
- #574 of 590 in NY
Livability — Rensselaer
- Score
- 77/100
- State rank
- #191
- US rank
- #2967
Category grades
Schools grade is shown separately in the Schools card above.
Census & demographics
- Census place
- Rensselaer, NY
- County
- Rensselaer County · 75,590 people
- City population
- 22,111
- Metro
- Albany-Schenectady-Troy, NY
- Population (ZIP)
- 22,111
- Household income
- $90,738
- Rent vs Own
- Severe rent burden
- 541.0
Population outlook (Rensselaer County) Hauer SSP2
- Today (2025)
- 162,400 people
- By 2030
- 161,746 · -0.4%
- By 2040
- 158,095 · -2.7%
- By 2050
- 152,966 · -5.8%
- By 2075
- 140,767 · -13.3%
- By 2100
- 124,727 · -23.2%
Race, ethnicity, and origin ACS 2023
- Neighborhood character
- Predominantly White (76%)
- Race & ethnicity
- White 76% Two or more races 8% Asian 7% Hispanic / Latino 6% Black 6%
- Hispanic origin (detail)
- Puerto Rican 4%
- Common ancestry
- Romanian 7% Lithuanian 6% Iranian 3%
- Foreign-born
- 7% · Philippines, Canada, China
- Languages at home
- 91% English-only · Other Asian/Pacific 3% Spanish 2% Chinese 1%
Political lean MEDSL · Rensselaer
- 2024 margin
- Toss-up / Even · D 50.7% · R 49.3%
- 2008→2024 swing
- -8.0pp toward R · 2008: 9.3pp · 2024: 1.4pp
- All cycles
- 2024: D+1.4 2020: D+5.6 2016: R+2.9 2012: D+11.8 2008: D+9.3
Not yet ingested
- Civics
- —
Market trends
- HPI YoY
- ▼ -138.26%
- Current HPI
- 276.2239
- Rent YoY
- ▲ 0.90%
- Metro
- Albany-Schenectady-Troy, NY
- State GDP YoY
- ▲ 2.60%
- F500 in state
- 92
Industry mix (Fortune 500 HQ in NY)
| Industry | F500 HQs | Revenue |
|---|---|---|
| Financial Services | 10 | $950B |
|
||
| Consumer Goods | 9 | $162B |
|
||
| Insurance | 4 | $225B |
|
||
| Telecommunications | 2 | $144B |
|
||
| Pharmaceuticals | 2 | $112B |
|
||
| Media / Entertainment | 2 | $69B |
|
||
Price history
+96.2% since first listed13 events — show timeline
- 2026-05-14 Price Changed $149,900 Global MLS
- 2026-04-17 Price Changed $164,900 Global MLS
- 2026-03-13 Listed $174,900 Global MLS
- 2026-02-18 Listing Removed — Global MLS
- 2025-08-20 Listed $175,000 Global MLS
- 2007-08-22 Sold (Public Records) $112,270 Public Records
- 2007-08-17 Sold (MLS) $109,000 Global MLS
- 2007-06-26 Listing Removed — Global MLS
- 2007-03-31 Listed $114,000 Global MLS
- 2002-08-27 Sold (Public Records) $73,000 Public Records
- 2002-08-22 Sold (MLS) $73,000 Global MLS
- 2002-07-05 Listing Removed — Global MLS
- 2002-04-29 Listed $76,400 Global MLS
Property tax history
+10.2%/yrLatest (2025): $3,806 · +1.3% YoY. Source: county tax records.
Cash-flow waterfall
monthlySold comps — $/sqft
last 12 mo · ≤1 miLoading sold comps…