 Duplex
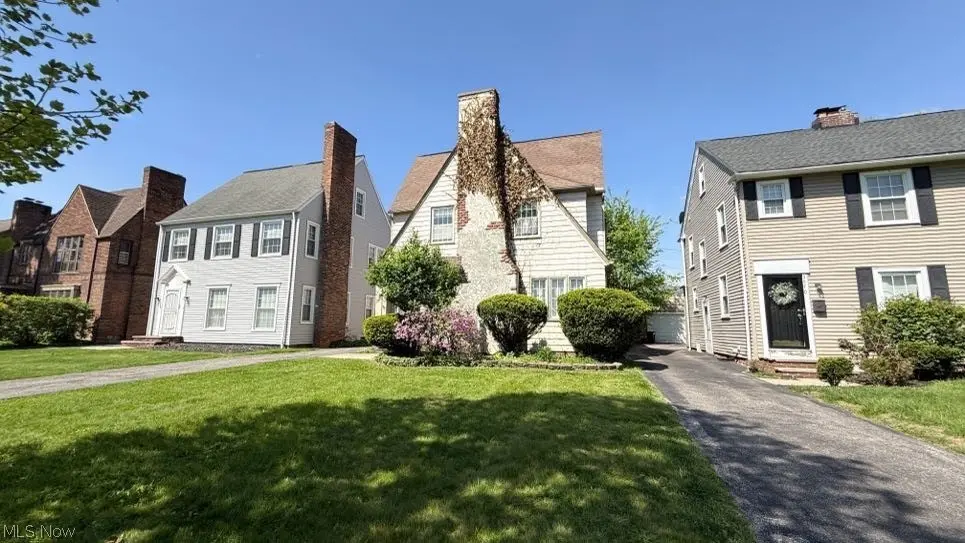
3574 Daleford Rd · Shaker Heights, OH
Flood risk 1/10 · Minimal
- FEMA flood zone
- X (unshaded)
- Chance of flooding over 30 yrs
- 0.0%
- Est. flood insurance / yr
- $473 – $860
Fire risk 1/10 · Minimal
- Est. fire insurance / yr
- $713 – $1,323
Heat risk 2/10 · Minimal
- Hot days now (above 95°F)
- 7 days/yr
- Hot days in 30 yrs
- 16 days/yr
Wind risk 1/10 · Minimal
- Chance of severe wind over 30 yrs
- —
Air-quality risk 3/10 · Minor
- Unhealthy air days now
- 3 days/yr
- Unhealthy air days in 30 yrs
- 5 days/yr
Risk factors via First Street. Map © Google.
Why this score? — see what drove the B+ grade
The composite is a weighted blend of 9 inputs, each scored 0–100. Each bar is that input's sub-score; the figure is the points it added to the 100-point composite (weight × sub-score).
- Cash flow +30.0/30.0
- ARV discount +14.1/15.0
- 1% rule +10.0/10.0
- DSCR +10.0/10.0
- Schools +5.0/10.0
- Livability +4.5/5.0
- Rent growth +3.3/5.0
- Condition / age +2.5/5.0
- Appreciation +0.0/10.0
$198,800
🖨 Deal sheet 📄 Offer letter ✓ Due diligence
Multi-family units
County records classify this as Multi-Family (2-4 Unit). Listing-text estimate: 2 units. confirmed
Listing remarks MLS
Lots Of Potential * * Two Family With Basement And Two Car Detached Garage * * A Pre-approval Letter Must Be Submitted With All Offers * *
Key facts
- Decorative fireplace
- Wood floors
- Stove
Tags
Property features AI
Finance
- Financial info: Owner pays sewer, trash collection, and water; tenants pay electricity and gas
Exterior
- Parking: Detached garage; 2 garage spaces
- Utilities: Public water; Public sewer
- Home design: Single building (multi-unit); Above-grade finished area approximately 2,268 (source: assessor)
- Construction: Frame construction; Asphalt/fiberglass roof
- Exterior features: Lot recorded at 0.11 acres
Interior
- Kitchen: Range; Refrigerator
- Bedrooms: Total of 10 rooms (bedroom count not specified)
- Bathrooms: 2 full bathrooms; 1 half bathroom
- Heating & cooling: Forced air heating
- Interior features: Common full basement
- Laundry & utility: Common area laundry in basement
Neighborhood map
What this means for you Summary
Snapshot
- This is a 2 × 2-bed/1.8-bath units multifamily listed at $199k.
Deal economics
- At list price, monthly cash flow is $822 ($10k/yr) — positive. Per door: $411/mo.
- The deal already cash-flows at list — no discount required.
- Meets the 1% rule at list price ($3k rent vs $199k).
- Cap rate 11.3% vs local median 2.5% in Shaker Heights — top-decile yield for the area; either an underpriced asset or a hidden risk that comps aren't pricing in. Stress-test before assuming the spread holds.
Location & tenants
- Location reads 89/100 on livability (#15 in OH, #134 nationally) — a professional / high-income tenant draw. Strengths: schools A+, crime A+, commute A+; Watch: amenities F.
- Shaker Heights City (suburban): math 50% / reading 63% proficiency, ranked #309 of 656 in OH (top 47%) — acceptable for families but not a draw, mixed tenant base, ~2y average lease.
- Market conditions: Rents rising (+3.3%/yr); 125 active listings in the ZIP; 18 comparable units currently listed for rent nearby; rentals at typical pace (median 17d on market — plan ~3-4 weeks tenant-placement turnaround); 1,441 units permitted in Cuyahoga County in 2024 (700 in 5+ unit buildings).
- At $3,228/mo this rent would consume 82% of the median local household income ($47k/yr) (locally 2289% of renters already pay >50% of income on rent) — very limited rent-growth headroom before tenants either downsize or default.
Forward outlook
- Local home prices are declining (-3.0%/yr); year-one equity from $1k of loan paydown is wiped out by about $6k of value loss. Plan a longer hold.
- Cuyahoga County population projected to shrink 8% by 2050 — rents likely to lag national; underwrite the cash flow, not the appreciation.
- At projected returns (-3.0% appreciation + 3.3% rent growth), your $56k cash investment doubles in ~7 years — after that, you're playing with house money.
Negotiation context
- Only 7 days on market — expect competitive offers; lowballing is unlikely to land.
- 3 sale attempts since 19y ago with the ask held roughly flat each time — persistent listings suggest the price (not the market) is what's stuck; bring a comps-based counter.
- Current owner paid $79k; list at $199k implies a 151% gain — meaningful room to come down on a strong offer.
Risks & watch-outs
- Watch-outs: property tax is 3.6% of price; built in 1923 — expect roof / HVAC / electrical / plumbing capex.
Questions for the listing agent
- Can we see the unit-by-unit rent roll, current vacancy, and any below-market leases? What's the average tenancy length?
- What capital expenditures (roof, boiler, parking lot, exteriors) have been made in the last 5 years, and what's planned in the next 2?
- Built in 1923 — when were the roof, HVAC, electrical panel, plumbing, and water heater last replaced?
- Property tax is high relative to price — has the assessment been appealed recently, and will the sale trigger a re-assessment?
- Is there a deadline driving the sale (1031 exchange, divorce, estate, relocation)? That informs how much negotiation room exists.
- Schools are A-rated — typically a magnet for longer-tenancy family renters. What's the average tenant stay here, and is there a school-zone premium baked into asking?
- What's the average days-on-market for RENTAL listings here right now (not sales)? A rising rental-DOM trend means longer vacancies and softer asking-rent achievability than the comps imply.
- What's the recent tenant-quality profile in this submarket — average credit score on applications, eviction rate, late-payment / NSF rate, and stable-employment percentage? A property-management company in the area should have these aggregated.
- How much new apartment / multifamily construction is in the pipeline within 1–3 miles? Heavy new supply (>2% of stock underway) typically softens rents 12–24 months out; light construction supports rent growth.
Investment metrics
- 1% rule
- 1.62% ✓
- Cap rate
- 11.25%
- Cash-on-cash
- 17.72%
- DSCR
- 1.79
- GRM
- 5.1
CMA / ARV
- ARV (median comp)
- $232,966
- List price
- $198,800
- Delta
- -14.67%
- Verdict
- UNDERPRICED
- Comps
- 20 within 1.0 mi
Show comp detail 12 sales within ~0.75 mi
| Address | Dist | Beds/Ba | Sqft | Sold | Price | $/sf | Match |
|---|---|---|---|---|---|---|---|
| 3550 Daleford Rd | 0.04mi | 4/3.0 | 2,268 (0%) | 4mo | $342,500 | $151 | 91 |
| 3566 Daleford Rd | 0.01mi | 4/2.0 | 2,268 (0%) | 19mo | $187,000 | $82 | 83 |
| 17624 Winslow Rd | 0.23mi | 4/3.0 | 2,268 (0%) | 11mo | $270,000 | $119 | 76 |
| 3643 Lindholm Rd | 0.29mi | 4/3.0 | 2,368 (+4%) | 8mo | $100,000 | $42 | 69 |
| 3619 Strathavon Rd | 0.17mi | 4/3.5 | 2,280 (+0%) | 22mo | $220,000 | $96 | 67 |
| 3625 Ingleside Rd | 0.18mi | 4/2.0 | 2,377 (+5%) | 22mo | $217,500 | $92 | 65 |
| 3653 Hildana Rd | 0.54mi | 4/2.0 | 2,110 (-7%) | 1mo | $102,000 | $48 | 62 |
| 3541 Daleford Rd | 0.07mi | 4/2.0 | 2,608 (+15%) | 14mo | $205,000 | $79 | 60 |
| 3713 Menlo Rd | 0.74mi | 4/2.0 | 2,166 (-4%) | 12mo | $65,000 | $30 | 48 |
| 3654 Hildana Rd | 0.58mi | 4/2.0 | 2,454 (+8%) | 20mo | $200,000 | $81 | 43 |
| 3638 Menlo Rd | 0.74mi | 4/2.0 | 2,554 (+13%) | 6mo | $133,000 | $52 | 39 |
| 18705 Newell Rd | 0.54mi | 4/3.5 | 2,472 (+9%) | 21mo | $252,500 | $102 | 36 |
Match score weights: distance 35% · size 25% · config 20% · recency 20%. Top-matched comps best support the ARV.
Projected returns pro-forma
-3.0% appreciation · 3.34% rent growth · sell at horizon
- IRR
- 9.7%
- Equity multiple
- 1.39×
- Total profit
- $21,500
- Equity at exit
- $29,642
- IRR
- 19.3%
- Equity multiple
- 2.65×
- Total profit
- $91,778
- Equity at exit
- $17,189
Cash invested: $55,664 (down + closing). Projections, not guarantees.
Landlord ↔ Tenant lean methodology
- Overall (STATE)
- 73 Landlord-Friendly
- State Ohio
- 73 Landlord-Friendly · R+6
- County
- — inherits STATE
- City
- — inherits STATE
ZIP-level market 44120
- Rents YoY
- 3.3%
- Active inventory
- 125
- Price-to-rent
- 10.3×
Monthly cashflow live
- Estimated rent
- $3,228 high interval (Pro) →
- Mortgage (P&I)
- −$1,043
- Tax from tax record
- −$603 /mo · $7,236/yr
- Insurance
- −$83
- HOA
- −$0
- Vacancy / Maint / Mgmt
- −$678
- Net cashflow
- $822
Break-even live
2-unit breakdown (identical units grouped — click to expand)
| Units | Beds | Baths | Est. rent |
|---|---|---|---|
| 2× units | 2 | 1.8 | $3,228 |
| #1 | 2 | 1.8 | $1,614 |
| #2 | 2 | 1.8 | $1,614 |
| Total (2 units) | $3,228 | ||
UW: 25.0% down · 7.5% · 30yr · 1.5% tax · 5.0% vac · 8.0% maint · 8.0% mgmt
Financing live
Cash to close
- Down payment
- $49,700
- Closing costs
- $5,964
- Reserves months
- —
- Total cash needed
- —
Loan-product check · same deal, 3 products live
Conventional
25% down · 7.5% · 30yr
- Down + closing
- —
- Monthly P&I
- —
- Monthly cashflow
- —
- DSCR
- —
- Eligible?
- —
Personal DTI + credit; lowest rate.
DSCR
20% down · 8.5% · 30yr
- Down + closing
- —
- Monthly P&I
- —
- Monthly cashflow
- —
- DSCR
- —
- Eligible?
- —
No personal income docs; deal must DSCR.
Hard money
10% down · 12.0% · 12mo
- Down + closing
- —
- Monthly P&I
- —
- Monthly cashflow
- —
- DSCR
- —
- Eligible?
- —
Short-term bridge; refi at stabilization.
Rent comps 18 comps
| Address | Beds | Baths | Sqft | Rent | $/sqft | DOM | Units | Dist |
|---|---|---|---|---|---|---|---|---|
| 3579 Riedham Rd Unit Up Shaker Heights, OH | 4.0 | 2.0 | 1648 | $1,600 | $0.97 | 43d | 1 | 0.10mi |
| 3524 Daleford Rd Cleveland, OH | 3.0 | 1.0 | 1700 | $2,200 | $1.29 | 16d | 1 | 0.12mi |
| 16818 Kenyon Rd Unit 2 Shaker Heights, OH | 4.0 | 1.0 | 1900 | $1,900 | $1.00 | 4d | 1 | 0.21mi |
| 17424 Winslow Rd Cleveland, OH | 4.0 | 2.0 | 1995 | $2,200 | $1.10 | 16d | 1 | 0.23mi |
| 3634 Glencairn Rd Shaker Heights, OH | 4.0 | 1.0 | 1612 | $1,750 | $1.09 | 23d | 1 | 0.32mi |
| 3636 Glencairn Rd Unit 2 Shaker Heights, OH | 4.0 | 1.0 | 1612 | $1,750 | $1.09 | 23d | 1 | 0.32mi |
| 3601 Glencairn Rd Shaker Heights, OH | 3.0 | 1.5 | 1890 | $1,500 | $0.79 | 43d | 1 | 0.34mi |
| 18314 Chagrin Blvd Unit 1 Shaker Heights, OH | 3.0 | 2.0 | 1670 | $1,600 | $0.96 | 17d | 1 | 0.38mi |
| 3578 Latimore Rd Shaker Heights, OH | 3.0 | 1.5 | 2113 | $2,200 | $1.04 | 1d | 1 | 0.43mi |
| 3710 Sudbury Rd Cleveland, OH | 4.0 | 1.5 | 1665 | $1,900 | $1.14 | 43d | 1 | 0.49mi |
| 3653 Winchell Rd Unit 2 Shaker Heights, OH | 5.0 | 3.0 | 1775 | $2,350 | $1.32 | 43d | 1 | 0.54mi |
| 3614 Lynnfield Rd Shaker Heights, OH | 4.0 | 2.0 | 1584 | $1,450 | $0.92 | 16d | 1 | 0.56mi |
| 3665 Lynnfield Rd Unit UP Shaker Heights, OH | 4.0 | 2.0 | 1600 | $1,849 | $1.16 | 43d | 1 | 0.61mi |
| 18801 Invermere Ave Cleveland, OH | 3.0 | 2.5 | 2134 | $2,200 | $1.03 | 1d | 1 | 0.68mi |
| 19406 Wickfield Ave Warrensville Heights, OH | 3.0 | 1.5 | 1934 | $2,650 | $1.37 | 1d | 1 | 0.87mi |
| 19601 Van Aken Blvd Shaker Heights, OH | 1.0–4.0 | 1.0–4.0 | 1977 | $4,400 | $2.23 | 21d | 1 | 0.93mi |
| 2975 Claremont Rd Shaker Heights, OH | 5.0 | 3.0 | 3241 | $3,200 | $0.99 | 11d | 1 | 1.05mi |
| 20005 Farnsleigh Rd Shaker Heights, OH | 1.0–3.0 | 1.0–3.5 | 1407 | $7,815 | $5.55 | 1d | 8 | 1.07mi |
Listing history 11 events
-
2026-05-18status Pending 589-char remark
-
2026-05-08$198,800 Active 589-char remark
-
2024-02-09historical $975
-
2024-01-24$975
-
2023-10-31historical $1,050
-
2023-09-30price $1,050
-
2020-09-04soldstatus $79,082
-
2008-02-15soldstatus $54,000 141-char remark
Show marketing remark (141 chars)
Lots Of Potential * * Two Family With Basement And Two Car Detached Garage * * A Pre-approval Letter Must Be Submitted With All Offers * *
-
2007-09-17$59,900 141-char remark
Show marketing remark (141 chars)
Lots Of Potential * * Two Family With Basement And Two Car Detached Garage * * A Pre-approval Letter Must Be Submitted With All Offers * *
-
2005-02-03soldstatus $180,000
-
1994-06-24soldstatus $90,000
ⓘ Source: listings_history table (triggers on properties + properties_extension) + one-shot
backfill from property_details.listing_events for pre-trigger history.
Tax reassessment forecast OH · Partial reset (capped growth)
- Current annual tax
- $7,236 · $603/mo
- Projected year-2 tax
- $7,236 · $603/mo
- Expected delta
- $0/yr ($0/mo · 0.0%)
ⓘ Screening estimate from a state-policy table — verify with the county assessor before closing.
Climate risk First Street
- Flood 1/10 Low FEMA zone X (unshaded) · 0% chance over 30 yrs
- Wildfire 1/10 Low
- Heat 2/10 Low 7 d/yr ≥95°F today · 16 d/yr by 30 yrs out
- Wind 1/10 Low
- Air quality 3/10 Moderate 3 unhealthy d/yr today · 5 by 30 yrs out
Nearby sold comps map
Loading sold comps map…
Walkable amenities ~0.75 mi
Loading nearby amenities…
Taxation est. · year 1
- Rental income
- $38,736
- − Mortgage interest
- −$11,136
- − Property taxes
- −$7,236
- − Insurance
- −$994
- − Repairs & maintenance
- −$3,099
- − Management
- −$3,099
- − Depreciation
- −$5,783
- Taxable income
- $7,389
- Est. tax owed @ 24.0%
- −$1,773
- After-tax cash flow
- $8,088/yr
For passive investors: Depreciation is non-cash, so a rental often shows a tax loss while cash-flowing — sheltering income. Rental losses are passive: they offset passive income freely, and up to $25,000/yr can offset ordinary (W-2) income if you actively participate and your MAGI is under $100k (phasing out to $0 by $150k); unused losses carry forward. On sale, claimed depreciation is recaptured at up to 25%, and gains may owe capital-gains tax (a 1031 exchange can defer both). Figures are a year-1 estimate at your 24.0% rate — not tax advice; consult a CPA.
Schools (NCES district)
- District
- Shaker Heights City
- NCES district ID
- 3904475
- Math proficiency
- 50% ▼ -16.00%
- Reading proficiency
- 63% ▼ -6.00%
- Median HH income
- $69,421
- Composite
- 49.98/100
- National rank
- #1928
- State rank
- #309 of 656 in OH
Livability — Shaker Heights
- Score
- 89/100
- State rank
- #15
- US rank
- #134
Category grades
Schools grade is shown separately in the Schools card above.
Census & demographics
- Census place
- Shaker Heights, OH
- County
- Cuyahoga County · 1,090,369 people
- City population
- 69,880
- Metro
- Cleveland-Elyria, OH
- Population (ZIP)
- 33,202
- Household income
- $47,126
- Rent vs Own
- Severe rent burden
- 2289.0
Population outlook (Cuyahoga County) Hauer SSP2
- Today (2025)
- 1,244,621 people
- By 2030
- 1,230,093 · -1.2%
- By 2040
- 1,189,108 · -4.5%
- By 2050
- 1,145,706 · -7.9%
- By 2075
- 1,076,557 · -13.5%
- By 2100
- 978,987 · -21.3%
Race, ethnicity, and origin ACS 2023
- Neighborhood character
- Predominantly Black (68%)
- Race & ethnicity
- Black 68% White 21% Two or more races 6% Hispanic / Latino 3% Asian 2%
- Common ancestry
- Romanian 2% Italian 1% Slovak 1%
- Foreign-born
- 5% · China, Canada
- Languages at home
- 93% English-only · Spanish 2% Chinese 1% Other Indo-European 1%
Political lean MEDSL · Cuyahoga
- 2024 margin
- Solid D (+31.5) · D 65.4% · R 33.9%
- 2008→2024 swing
- -7.4pp toward R · 2008: 38.9pp · 2024: 31.5pp
- All cycles
- 2024: D+31.5 2020: D+34.1 2016: D+35.0 2012: D+38.7 2008: D+38.9
Not yet ingested
- Civics
- —
Market trends
- HPI YoY
- ▼ -201.50%
- Current HPI
- 108.2487
- Rent YoY
- ▲ 3.34%
- Metro
- Cleveland-Elyria, OH
- State GDP YoY
- ▲ 1.98%
- F500 in state
- 48
Industry mix (Fortune 500 HQ in OH)
| Industry | F500 HQs | Revenue |
|---|---|---|
| Insurance | 3 | $145B |
|
||
| Industrial Machinery | 3 | $49B |
|
||
| Financial Services | 3 | $24B |
|
||
| Consumer Goods | 2 | $93B |
|
||
| Aerospace / Defense | 2 | $47B |
|
||
| Utilities | 2 | $33B |
|
||
Price history
+120.9% since first listed11 events — show timeline
- 2026-05-18 Pending — MLSNOW
- 2026-05-08 Listed $198,800 MLSNOW
- 2024-02-09 Rental Removed $975 BUILDIUM
- 2024-01-24 Listed for Rent $975 BUILDIUM
- 2023-10-31 Rental Removed $1,050 YESMLS
- 2023-09-30 Price Changed $1,050 YESMLS
- 2020-09-04 Sold (Public Records) $79,082 Public Records
- 2008-02-15 Sold (MLS) $54,000 MLSNOW
- 2007-09-17 Listed $59,900 MLSNOW
- 2005-02-03 Sold (Public Records) $180,000 Public Records
- 1994-06-24 Sold (Public Records) $90,000 Public Records
Property tax history
+2.5%/yrLatest (2025): $7,236 · +13.2% YoY. Source: county tax records.
Cash-flow waterfall
monthlySold comps — $/sqft
last 12 mo · ≤1 miLoading sold comps…