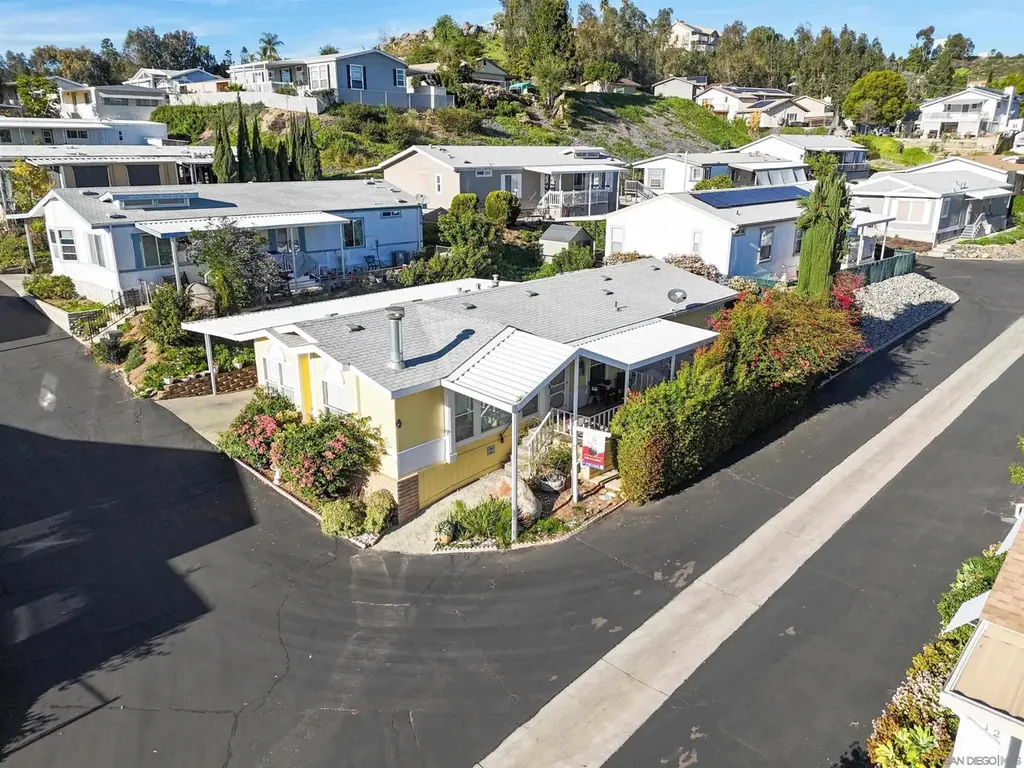
12250 Vista Del Cajon Rd Spc 25 · Winter Gardens, CA
Flood risk 1/10 · Minimal
- FEMA flood zone
- X (unshaded)
- Chance of flooding over 30 yrs
- 0.0%
- Est. flood insurance / yr
- $507 – $1,088
Fire risk 5/10 · Moderate
- Est. fire insurance / yr
- $659 – $1,223
Heat risk 5/10 · Moderate
- Hot days now (above 98°F)
- 4 days/yr
- Hot days in 30 yrs
- 10 days/yr
Wind risk 1/10 · Minimal
- Chance of severe wind over 30 yrs
- —
Air-quality risk 4/10 · Minor
- Unhealthy air days now
- 6 days/yr
- Unhealthy air days in 30 yrs
- 7 days/yr
Risk factors via First Street. Map © Google.
Why this score? — see what drove the C+ grade
The composite is a weighted blend of 9 inputs, each scored 0–100. Each bar is that input's sub-score; the figure is the points it added to the 100-point composite (weight × sub-score).
- Cash flow +30.0/30.0
- DSCR +10.0/10.0
- 1% rule +7.4/10.0
- Schools +4.4/10.0
- Livability +3.1/5.0
- Condition / age +2.5/5.0
- Rent growth +2.3/5.0
- ARV discount +2.2/15.0
- Appreciation +0.0/10.0
$235,000
🖨 Deal sheet (PDF) 📄 Offer letter ✓ Due diligence
Listing remarks
Beautifully Updated Home in an All-Ages Community — Discover a wonderfully maintained home built in 2002, offering comfort, functionality, and fresh updates throughout. This inviting space features 2 bedrooms and 2 bathrooms, including a spacious main bedroom with anadditional flex room—ideal for a home office, hobby space, or relaxation area. Property Highlights • Fresh Interior Touches: New flooring andresurfaced kitchen cabinets paired with stylish quartz countertops. • New Exterior Paint: Clean, updated curb appeal you’ll appreciate from themoment you arrive. • Prime Corner Location: Offers a pleasant sense of openness and added privacy. • Community
Key facts
- Quartz countertops
- New exterior paint
- New flooring
Tags
Property features AI
Finance
- HOA & community: Community pool; located in Vista Del Cajon community
Exterior
- Parking: 3 parking spaces total
- Utilities: Public water; Sewer connected
- Home design: Manufactured home; Single-story
- Construction: Vinyl siding; Shingle roof
- Exterior features: Covered porch; Brick fencing; Community pool; On-site shed(s)
Interior
- Kitchen: Dishwasher; Garbage disposal; Gas range; Range hood; Refrigerator
- Bedrooms: 2 possible bedrooms
- Bathrooms: 2 full bathrooms
- Heating & cooling: Central air conditioning; Forced air heating (natural gas)
- Interior features: Has a living room fireplace
- Laundry & utility: Washer; Dryer
Neighborhood map
What this means for you Summary
Snapshot
- This is a 2-bed/2.0-bath manufactured listed at $235k.
Deal economics
- At list price, monthly cash flow is $932 ($11k/yr) — positive.
- The deal already cash-flows at list — no discount required.
- Meets the 1% rule at list price ($3k rent vs $235k).
- Cap rate 11.1% vs local median 2.7% in Winter Gardens — top-decile yield for the area; either an underpriced asset or a hidden risk that comps aren't pricing in. Stress-test before assuming the spread holds.
Location & tenants
- Location reads 61/100 on livability (#515 in CA) — a middle-class / working-renter tenant base. Strengths: commute A+, employment A-, housing A-; Watch: schools C-, crime D-, amenities F.
- Lakeside Union Elementary (suburban): math 41% / reading 52% proficiency, ranked #480 of 1,400 in CA (top 34%) — families likely to look elsewhere, expect single-tenant / working-renter base with shorter leases.
- Market conditions: Rents soft (-0.8%/yr); 238 active listings in the ZIP; 11 comparable units currently listed for rent nearby; rentals leasing fast (median 2d on market — plan ~1-2 weeks tenant-placement turnaround); 11,759 units permitted in San Diego County in 2024 (7,244 in 5+ unit buildings).
- At $2,918/mo this rent would consume 47% of the median local household income ($74k/yr) (locally 4178% of renters already pay >50% of income on rent) — very limited rent-growth headroom before tenants either downsize or default.
Forward outlook
- Local home prices are declining (-3.0%/yr); year-one equity from $2k of loan paydown is wiped out by about $7k of value loss. Plan a longer hold.
- San Diego County population projected at +20% by 2050 — long-run rental-demand tailwind backs the buy-and-hold thesis.
- At projected returns (-3.0% appreciation + 0.0% rent growth), your $66k cash investment doubles in ~10 years — after that, you're playing with house money.
Negotiation context
- Only 10 days on market — expect competitive offers; lowballing is unlikely to land.
- 6 sale attempts since 2y ago with the ask held roughly flat each time — persistent listings suggest the price (not the market) is what's stuck; bring a comps-based counter.
Risks & watch-outs
- Climate carrying-cost: moderate wildfire risk; extreme-heat days projected 4→10/yr by 2055 (HVAC capex compounding) — expect insurance premiums to compound above CPI over the hold.
Questions for the listing agent
- Is there a deadline driving the sale (1031 exchange, divorce, estate, relocation)? That informs how much negotiation room exists.
- Crime grade is D in this area — have there been break-ins, vandalism, or insurance claims at this property in the last 3 years? What carrier currently insures it and at what premium?
- What's the average days-on-market for RENTAL listings here right now (not sales)? A rising rental-DOM trend means longer vacancies and softer asking-rent achievability than the comps imply.
- What's the recent tenant-quality profile in this submarket — average credit score on applications, eviction rate, late-payment / NSF rate, and stable-employment percentage? A property-management company in the area should have these aggregated.
- How much new for-sale + rental construction is in the pipeline within 1–3 miles? Heavy new supply typically softens prices + rents 12–24 months out; constrained supply supports both.
Investment metrics
- 1% rule
- 1.24% ✓
- Cap rate
- 11.05%
- Cash-on-cash
- 17.00%
- DSCR
- 1.76
- GRM
- 6.7
CMA / ARV
- ARV (on-the-fly)
- $210,375
- Comps found
- 12
Show comp detail 12 sales within ~0.75 mi
| Address | Dist | Beds/Ba | Sqft | Sold | Price | $/sf | Match |
|---|---|---|---|---|---|---|---|
| 12250 Vista Del Cajon Rd Spc 25 | 0.00mi | 2/2.0 | 1,275 (0%) | 1mo | $235,000 | $184 | 99 |
| 12250 Vista Del Cajon Rd Spc 45 | 0.00mi | 3/2.0 (+1) | 1,248 (-2%) | 14mo | $183,000 | $147 | 80 |
| 12250 Vista Del Cajon Rd #17 | 0.06mi | 3/2.0 (+1) | 1,248 (-2%) | 15mo | $275,000 | $220 | 76 |
| 8128 Royal Park Ln | 0.22mi | 2/2.0 | 1,368 (+7%) | 12mo | $150,000 | $110 | 68 |
| 12044 Royal Rd #120 | 0.36mi | 3/2.0 (+1) | 1,325 (+4%) | 14mo | $219,000 | $165 | 60 |
| 1315 Pepper Dr #72 | 0.68mi | 2/2.0 | 1,220 (-4%) | 10mo | $194,000 | $159 | 52 |
| 1351 Pepper Dr #26 | 0.66mi | 2/2.0 | 1,200 (-6%) | 10mo | $160,000 | $133 | 52 |
| 1351 Pepper Dr #18 | 0.66mi | 2/2.0 | 1,140 (-11%) | 3mo | $184,000 | $161 | 49 |
| 1351 Pepper Dr Spc 41 | 0.66mi | 2/2.0 | 1,400 (+10%) | 8mo | $235,000 | $168 | 46 |
| 1315 Pepper Dr #67 | 0.68mi | 3/2.0 (+1) | 1,440 (+13%) | 3mo | $145,000 | $101 | 39 |
| 1315 Pepper Dr #86 | 0.68mi | 3/2.0 (+1) | 1,344 (+5%) | 18mo | $275,000 | $205 | 39 |
| 12690 Jackson Hill Dr Spc 24 | 0.48mi | 3/2.0 (+1) | 1,440 (+13%) | 19mo | $272,000 | $189 | 35 |
Match score weights: distance 35% · size 25% · config 20% · recency 20%. Top-matched comps best support the ARV.
Projected returns pro-forma
-3.0% appreciation · 0.0% rent growth · sell at horizon
- IRR
- 5.1%
- Equity multiple
- 1.19×
- Total profit
- $12,639
- Equity at exit
- $35,039
- IRR
- 11.9%
- Equity multiple
- 1.82×
- Total profit
- $53,971
- Equity at exit
- $20,319
Cash invested: $65,800 (down + closing). Projections, not guarantees.
Landlord ↔ Tenant lean methodology
- Overall (STATE)
- 18 Strongly Tenant-Friendly
- State California
- 18 Strongly Tenant-Friendly · D+13
- County
- — inherits STATE
- City
- — inherits STATE
ZIP-level market 92021
- Rents YoY
- -0.8%
- Active inventory
- 238
- Price-to-rent
- 6.7×
Monthly cashflow live
- Estimated rent
- $2,918 high interval (Pro) →
- Mortgage (P&I)
- −$1,232
- Tax from tax record
- −$43 /mo · $512/yr
- Insurance
- −$98
- HOA
- −$0
- Vacancy / Maint / Mgmt
- −$613
- Net cashflow
- $932
Break-even live
Sensitivity live
| Price | -10% $1,065 | -5% $999 | +0% $932 | +5% $866 | +10% $519 |
|---|---|---|---|---|---|
| Rent | -10% $702 | -5% $817 | +0% $932 | +5% $1,048 | +10% $1,163 |
| Rate | -1.0pp $1,051 | -0.5pp $992 | base $932 | +0.5pp $871 | +1.0pp $809 |
UW: 25.0% down · 7.5% · 30yr · 1.5% tax · 5.0% vac · 8.0% maint · 8.0% mgmt
Financing live
Cash to close
- Down payment
- $58,750
- Closing costs
- $7,050
- Reserves months
- —
- Total cash needed
- —
Loan-product check · same deal, 3 products live
Conventional
25% down · 7.5% · 30yr
- Down + closing
- —
- Monthly P&I
- —
- Monthly cashflow
- —
- DSCR
- —
- Eligible?
- —
Personal DTI + credit; lowest rate.
DSCR
20% down · 8.5% · 30yr
- Down + closing
- —
- Monthly P&I
- —
- Monthly cashflow
- —
- DSCR
- —
- Eligible?
- —
No personal income docs; deal must DSCR.
Hard money
10% down · 12.0% · 12mo
- Down + closing
- —
- Monthly P&I
- —
- Monthly cashflow
- —
- DSCR
- —
- Eligible?
- —
Short-term bridge; refi at stabilization.
Rent comps 11 comps
| Address | Beds | Baths | Sqft | Rent | $/sqft | DOM | Units | Dist |
|---|---|---|---|---|---|---|---|---|
| 8424 Pueblo Rd Unit 8424 Lakeside, CA | 3.0 | 1.0 | 1000 | $2,750 | $2.75 | 2d | 1 | 0.30mi |
| 8031 Winter Gardens Blvd El Cajon, CA | 3.0 | 2.0 | 1124 | $2,995 | $2.66 | 2d | 1 | 0.44mi |
| 2000 E Main St El Cajon, CA | 3.0 | 1.5–2.5 | 1165 | $3,300 | $2.83 | 2d | 1 | 0.83mi |
| 9094 Los Coches Rd Lakeside, CA | 3.0 | 2.5 | 1200 | $4,000 | $3.33 | 2d | 1 | 1.20mi |
| 9092 Los Coches Rd Lakeside, CA | 3.0 | 2.5 | 1300 | $4,000 | $3.08 | 2d | 1 | 1.20mi |
| 1221 Oro St El Cajon, CA | 2.0 | 1.5 | 1020 | $2,575 | $2.52 | 2d | 1 | 1.28mi |
| 8410 Los Coches Rd El Cajon, CA | 2.0 | 2.0 | 900 | $2,239 | $2.49 | 2d | 1 | 1.32mi |
| 9205 Emerald Grove Ave Lakeside, CA | 3.0 | 2.0 | 1652 | $3,650 | $2.21 | 3d | 1 | 1.37mi |
| 1696 Buckeye Dr El Cajon, CA | 3.0 | 1.0 | 942 | $2,900 | $3.08 | 2d | 1 | 1.38mi |
| 1365 Broadway El Cajon, CA | 3.0 | 2.0 | 1000 | $3,478 | $3.48 | 2d | 1 | 1.40mi |
| 1314 5 D Dr Unit 1318 El Cajon, CA | 3.0 | 1.0 | 960 | $2,600 | $2.71 | 24d | 1 | 1.46mi |
Listing history 14 events
-
2026-05-05status Pending
-
2026-04-24$235,000 Active
-
2026-03-26historical
-
2026-01-21$250,000 Active
-
2026-01-21historical
-
2026-01-07price $260,000
-
2025-11-13$264,998 Active
-
2025-04-11soldstatus $243,250 Sold
-
2025-04-01status Pending
-
2025-02-10$249,000 Active
-
2025-02-01historical
-
2025-01-03$289,700 Active
-
2025-01-01historical
-
2024-11-07$299,900 Active
ⓘ Source: listings_history table (triggers on properties + properties_extension) + one-shot
backfill from property_details.listing_events for pre-trigger history.
Tax reassessment forecast CA · Resets to sale price
- Current annual tax
- $512 · $43/mo
- Projected year-2 tax
- $1,786 · $149/mo
- Expected delta
- +$1,274/yr (+$106/mo · 248.8%)
ⓘ Screening estimate from a state-policy table — verify with the county assessor before closing.
Climate risk First Street
- Flood 1/10 Low FEMA zone X (unshaded) · 0% chance over 30 yrs
- Wildfire 5/10 Major
- Heat 5/10 Major 4 d/yr ≥98°F today · 10 d/yr by 30 yrs out
- Wind 1/10 Low
- Air quality 4/10 Moderate 6 unhealthy d/yr today · 7 by 30 yrs out
Nearby sold comps map
Loading sold comps map…
Walkable amenities ~0.75 mi
Loading nearby amenities…
Taxation est. · year 1
- Rental income
- $35,017
- − Mortgage interest
- −$13,164
- − Property taxes
- −$512
- − Insurance
- −$1,175
- − Repairs & maintenance
- −$2,801
- − Management
- −$2,801
- − Depreciation
- −$6,836
- Taxable income
- $7,727
- Est. tax owed @ 24.0%
- −$1,855
- After-tax cash flow
- $9,333/yr
For passive investors: Depreciation is non-cash, so a rental often shows a tax loss while cash-flowing — sheltering income. Rental losses are passive: they offset passive income freely, and up to $25,000/yr can offset ordinary (W-2) income if you actively participate and your MAGI is under $100k (phasing out to $0 by $150k); unused losses carry forward. On sale, claimed depreciation is recaptured at up to 25%, and gains may owe capital-gains tax (a 1031 exchange can defer both). Figures are a year-1 estimate at your 24.0% rate — not tax advice; consult a CPA.
Schools (NCES district)
- District
- Lakeside Union Elementary
- NCES district ID
- 0620790
- Math proficiency
- 41% ▬ 0.00%
- Reading proficiency
- 52% ▼ -1.00%
- Median HH income
- $65,574
- Composite
- 43.51/100
- National rank
- #6453
- State rank
- #480 of 1400 in CA
Livability — Winter Gardens
- Score
- 61/100
- State rank
- #515
- US rank
- #17448
Category grades
Schools grade is shown separately in the Schools card above.
Census & demographics
- Census place
- Winter Gardens, CA
- County
- San Diego County · 3,178,799 people
- Metro
- San Diego-Chula Vista-Carlsbad, CA
- Population (ZIP)
- 70,501
- Household income
- $74,013
- Rent vs Own
- Severe rent burden
- 4178.0
Population outlook (San Diego County) Hauer SSP2
- Today (2025)
- 3,678,185 people
- By 2030
- 3,856,546 · +4.8%
- By 2040
- 4,171,407 · +13.4%
- By 2050
- 4,421,607 · +20.2%
- By 2075
- 4,831,599 · +31.4%
- By 2100
- 4,832,502 · +31.4%
Race, ethnicity, and origin ACS 2023
- Neighborhood character
- Diverse neighborhood (Simpson 0.62)
- Race & ethnicity
- White 54% Hispanic / Latino 28% Two or more races 14% Black 6% Asian 5% Native American 2%
- Hispanic origin (detail)
- Mexican 24%
- Common ancestry
- Arab 6% Italian 2% Lithuanian 2%
- Foreign-born
- 22% · Canada
- Languages at home
- 65% English-only · Spanish 18% Arabic 7% Other Indo-European 3%
Political lean MEDSL · San Diego
- 2024 margin
- D (+16.8) · D 56.9% · R 40.1% · Other 2.9%
- 2008→2024 swing
- +6.6pp toward D · 2008: 10.2pp · 2024: 16.8pp
- All cycles
- 2024: D+16.8 2020: D+22.8 2016: D+17.8 2012: D+5.1 2008: D+10.2
Not yet ingested
- Civics
- —
Market trends
- HPI YoY
- ▼ -654.88%
- Current HPI
- 335.0617
- Rent YoY
- ▼ -0.83%
- Metro
- San Diego-Chula Vista-Carlsbad, CA
- State GDP YoY
- ▲ 3.21%
- F500 in state
- 116
Industry mix (Fortune 500 HQ in CA)
| Industry | F500 HQs | Revenue |
|---|---|---|
| Technology | 27 | $1,492B |
|
||
| Financial Services | 3 | $174B |
|
||
| Retail | 3 | $44B |
|
||
| Insurance | 3 | $26B |
|
||
| Media / Entertainment | 2 | $115B |
|
||
| Pharmaceuticals / Biotech | 2 | $62B |
|
||
Price history
-21.6% since first listed14 events — show timeline
- 2026-05-05 Pending — SDMLS
- 2026-04-24 Listed $235,000 SDMLS
- 2026-03-26 Listing Removed — SDMLS
- 2026-01-21 Listed $250,000 SDMLS
- 2026-01-21 Listing Removed — SDMLS
- 2026-01-07 Price Changed $260,000 SDMLS
- 2025-11-13 Listed $264,998 SDMLS
- 2025-04-11 Sold (MLS) $243,250 SDMLS
- 2025-04-01 Pending — SDMLS
- 2025-02-10 Listed $249,000 SDMLS
- 2025-02-01 Listing Removed — SDMLS
- 2025-01-03 Listed $289,700 SDMLS
- 2025-01-01 Listing Removed — SDMLS
- 2024-11-07 Listed $299,900 SDMLS
Property tax history
-16.2%/yrLatest (2013): $512 · -52.7% YoY. Source: county tax records.
Cash-flow waterfall
monthlySold comps — $/sqft
last 12 mo · ≤1 miLoading sold comps…