25216 Pelican Creek Cir #201 · Bonita Springs, FL
Flood risk 7/10 · Major
- FEMA flood zone
- X (shaded)
- Chance of flooding over 30 yrs
- 0.75%
- Est. flood insurance / yr
- $507 – $1,088
Fire risk 1/10 · Minimal
- Est. fire insurance / yr
- $947 – $1,759
Heat risk 9/10 · Severe
- Hot days now (above 107°F)
- 6 days/yr
- Hot days in 30 yrs
- 26 days/yr
Wind risk 10/10 · Severe
- Chance of severe wind over 30 yrs
- 99.0%
Air-quality risk 3/10 · Minor
- Unhealthy air days now
- 2 days/yr
- Unhealthy air days in 30 yrs
- 2 days/yr
Risk factors via First Street. Map © Google.
Why this score? — see what drove the F grade
The composite is a weighted blend of 9 inputs, each scored 0–100. Each bar is that input's sub-score; the figure is the points it added to the 100-point composite (weight × sub-score).
- ARV discount +7.5/15.0
- Schools +4.1/10.0
- Livability +3.5/5.0
- Rent growth +3.2/5.0
- Condition / age +2.5/5.0
- Cash flow +2.0/30.0
- 1% rule +1.2/10.0
- DSCR +0.0/10.0
- Appreciation +0.0/10.0
$520,000
🖨 Deal sheet 📄 Offer letter ✓ Due diligence
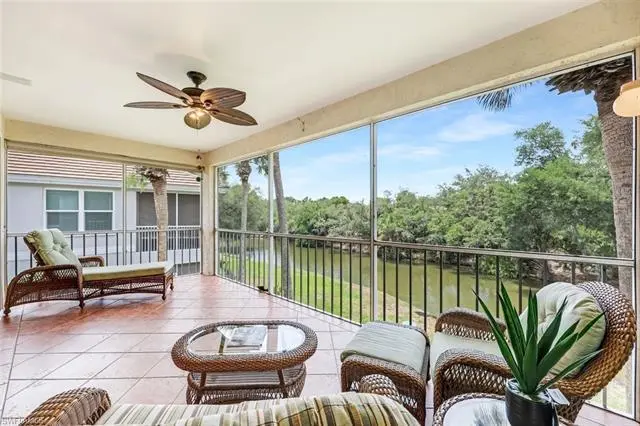
Listing remarks
This is the creek view you’ve been waiting for in Creekside Crossing at Pelican Landing. Completely private and peaceful with no homes visible across the water. Enjoy a nature-filled backdrop from your oversized lanai. This well-maintained 3-bedroom, 2-bath, 2nd floor condo with attached 1-car garage comes with complete peace-of-mind offering brand-new 2026 high-impact sliding glass doors and windows, a 2026 whole-house replumb (no polybutylene pipes), brand-new 2026 hot water heater, and 2016 AC in excellent condition. All roofs in Creekside Crossing are newer, and budget reserves are well-managed. Vaulted ceilings welcome you into a spacious and open floor plan. The creek view
Key facts
- Whole-house replumb
- Newer roofs
- Creek view
Tags
Property features AI
Finance
- Other: Part of Pelican Landing development (Creekside Crossing sub-condo)
- Financial info: One-time other fee applies; Total annual recurring fees noted
- HOA & community: Mandatory HOA; Quarterly condo fee; Annual master HOA fee; Professional management; HOA covers cable, internet/WiFi, irrigation water, lawn/land maintenance, pest control (exterior), recreation facilities, reserves, security, street lights/maintenance, trash removal, water, insurance, legal/accounting, manager; Community amenities include private beach and beach club, community pool and spa, clubhouse and community room, fitness center (attended), golf course (non-equity), community boat dock and slip, pickleball, tennis courts, bocce, playground, BBQ/picnic areas, restaurant, sidewalks, underground utilities
Exterior
- Parking: Attached 1-car garage; Paved driveway; Guest paved parking available
- Security: Gated community; Community security included in maintenance
- Utilities: Central water; Central sewer; Cable available
- Home design: Residential carriage/coach unit in a low-rise building (1–3 stories); Rear exposure faces northwest
- Construction: Built in 1995; Concrete block construction; Stucco exterior; Tile roof; Impact resistant windows and doors
- Exterior features: Screened lanai/porch; Zero lot line; Private paved road access; Two guest parking spaces nearby; Has creek waterfront/view; Dock lease for boat access
Interior
- Kitchen: Pantry; Dishwasher; Range; Microwave; Refrigerator/Freezer; Garbage disposal
- Bedrooms: 3 bedrooms (split bedroom floor plan)
- Flooring: Tile; Vinyl
- Bathrooms: 2 full bathrooms; Master bathroom with dual sinks and shower (no tub)
- Heating & cooling: Central electric heat; Central electric air conditioning; Ceiling fans
- Interior features: Cable pre-wired; High-speed internet available; Foyer; Pantry; Smoke detectors; Vaulted ceiling; Walk-in closet; Turnkey furnished; Exclusions noted
- Laundry & utility: Washer and dryer; Laundry inside the residence; Auto garage door opener
Neighborhood map
What this means for you Summary
Snapshot
- This is a 2-bed/2.0-bath condo listed at $520k.
Deal economics
- At list price, monthly cash flow is $-2k ($-24k/yr) — negative.
- To cash-flow at today's rent, offer at most $170k (67.3% below list).
- To meet the 1% rule (rent ≥ 1% of price), the offer needs to be $322k (38.0% below list).
- Recommended offer: $170k (67.3% below list) — sets the bar for cash-flow.
Location & tenants
- Location reads 70/100 on livability (#428 in FL) — a middle-class / working-renter tenant base. Strengths: crime A+, housing A+, employment A; Watch: schools C-, cost of living C-, health & safety D.
- Lee (suburban): math 47% / reading 50% proficiency, ranked #42 of 73 in FL (top 58%) — families likely to look elsewhere, expect single-tenant / working-renter base with shorter leases.
- Market conditions: Rents rising (+2.9%/yr); 699 active listings in the ZIP; 40 comparable units currently listed for rent nearby; rentals at typical pace (median 24d on market — plan ~3-4 weeks tenant-placement turnaround); high-income renter base; 15,411 units permitted in Lee County in 2024 (4,686 in 5+ unit buildings).
Forward outlook
- Local home prices are declining (-3.0%/yr); year-one equity from $4k of loan paydown is wiped out by about $16k of value loss. Plan a longer hold.
- Lee County population projected at +44% by 2050 — long-run rental-demand tailwind backs the buy-and-hold thesis.
Negotiation context
- It's been on market 35 days — a 3% lower offer ($504k) is reasonable based on typical stale-listing flexibility.
- Current owner paid $215k; list at $520k implies a 142% gain — meaningful room to come down on a strong offer.
Risks & watch-outs
- Watch-outs: flood insurance adds $66/mo; HOA is 32% of rent.
- Climate carrying-cost: major flood risk; severe wind risk, 99% chance of damaging wind over 30y; extreme-heat days projected 6→26/yr by 2055 (HVAC capex compounding) — expect insurance premiums to compound above CPI over the hold.
Questions for the listing agent
- What do current leases actually rent for vs. the listed asking? Can we see a recent rent roll and the last 12 months of T-12 income?
- It's been on market 35 days. Have you received any prior offers? Is the seller open to a 67% concession, seller financing, or rate buy-down credit?
- What's the actual annual flood-insurance premium (NFIP or private), and is the property in a SFHA with mandatory coverage?
- What does the HOA fee cover, when was the last increase, and are there any pending special assessments or reserve-fund shortfalls?
- Any open or pending special assessments — roof, HVAC, plumbing, elevator, façade? What's the per-unit balance and payoff schedule, and is the seller paying it off at close or rolling it to the buyer?
- Is there a deadline driving the sale (1031 exchange, divorce, estate, relocation)? That informs how much negotiation room exists.
- The area grade is low — what's the realistic commute time and amenity access for the typical tenant pool here? Any planned neighborhood developments (good or bad) we should know about?
- What's the average days-on-market for RENTAL listings here right now (not sales)? A rising rental-DOM trend means longer vacancies and softer asking-rent achievability than the comps imply.
- What's the recent tenant-quality profile in this submarket — average credit score on applications, eviction rate, late-payment / NSF rate, and stable-employment percentage? A property-management company in the area should have these aggregated.
- How much new apartment / multifamily construction is in the pipeline within 1–3 miles? Heavy new supply (>2% of stock underway) typically softens rents 12–24 months out; light construction supports rent growth.
Investment metrics
- 1% rule
- 0.62% ✗
- Cap rate
- 1.88%
- Cash-on-cash
- -15.77%
- DSCR
- 0.30
- GRM
- 13.5
CMA / ARV
No comps found within radius.
Projected returns pro-forma
-3.0% appreciation · 2.85% rent growth · sell at horizon
- IRR
- -48.2%
- Equity multiple
- -0.44×
- Total profit
- $-210,261
- Equity at exit
- $77,534
- IRR
- -92.8%
- Equity multiple
- -1.37×
- Total profit
- $-344,972
- Equity at exit
- $44,960
Cash invested: $145,600 (down + closing). Projections, not guarantees.
Landlord ↔ Tenant lean methodology
- Overall (STATE)
- 87 Strongly Landlord-Friendly
- State Florida
- 87 Strongly Landlord-Friendly · R+3
- County
- — inherits STATE
- City
- — inherits STATE
ZIP-level market 34134
- Rents YoY
- 2.9%
- Active inventory
- 699
- Price-to-rent
- 13.5×
Monthly cashflow live
- Estimated rent
- $3,222 medium interval (Pro) →
- Mortgage (P&I)
- −$2,727
- Tax from tax record
- −$474 /mo · $5,692/yr
- Insurance
- −$217
- Flood insurance flood zone
- −$66 /mo · $798/yr
- HOA
- −$1,041
- Vacancy / Maint / Mgmt
- −$677
- Net cashflow
- $-1,980
Break-even live
UW: 25.0% down · 7.5% · 30yr · 1.5% tax · 5.0% vac · 8.0% maint · 8.0% mgmt
Financing live
Cash to close
- Down payment
- $130,000
- Closing costs
- $15,600
- Reserves months
- —
- Total cash needed
- —
Loan-product check · same deal, 3 products live
Conventional
25% down · 7.5% · 30yr
- Down + closing
- —
- Monthly P&I
- —
- Monthly cashflow
- —
- DSCR
- —
- Eligible?
- —
Personal DTI + credit; lowest rate.
DSCR
20% down · 8.5% · 30yr
- Down + closing
- —
- Monthly P&I
- —
- Monthly cashflow
- —
- DSCR
- —
- Eligible?
- —
No personal income docs; deal must DSCR.
Hard money
10% down · 12.0% · 12mo
- Down + closing
- —
- Monthly P&I
- —
- Monthly cashflow
- —
- DSCR
- —
- Eligible?
- —
Short-term bridge; refi at stabilization.
Rent comps 40 comps
| Address | Beds | Baths | Sqft | Rent | $/sqft | DOM | Units | Dist |
|---|---|---|---|---|---|---|---|---|
| 25248 Pelican Creek Cir #102 Bonita Springs, FL | 3.0 | 2.0 | 1458 | $7,000 | $4.80 | 23d | 1 | 0.03mi |
| 25240 Pelican Creek Cir #202 Bonita Springs, FL | 2.0 | 2.0 | 1846 | $6,500 | $3.52 | 16d | 1 | 0.07mi |
| 25240 Pelican Creek Cir #202 Bonita Springs, FL | 2.0 | 2.0 | 1846 | $6,500 | $3.52 | 23d | 1 | 0.07mi |
| 25232 Pelican Creek Cir #202 Bonita Springs, FL | 3.0 | 2.0 | 1646 | $6,500 | $3.95 | 23d | 1 | 0.07mi |
| 3421 Marbella Ct Bonita Springs, FL | 3.0 | 3.5 | 2073 | $10,000 | $4.82 | 23d | 1 | 0.27mi |
| 3460 Pointe Creek Ct #102 Bonita Springs, FL | 3.0 | 2.0 | 1622 | $6,800 | $4.19 | 23d | 1 | 0.30mi |
| 3461 Pointe Creek Ct #306 Bonita Springs, FL | 3.0 | 2.0 | 1650 | $3,150 | $1.91 | 23d | 1 | 0.32mi |
| 3442 Pointe Creek Ct #201 Bonita Springs, FL | 3.0 | 2.0 | 1673 | $7,000 | $4.18 | 3d | 1 | 0.36mi |
| 3401 Tralee Ct #202 Bonita Springs, FL | 3.0 | 2.0 | 2184 | $7,500 | $3.43 | 23d | 1 | 0.38mi |
| 3412 Pointe Creek Ct #102 Bonita Springs, FL | 3.0 | 2.0 | 1622 | $6,250 | $3.85 | 23d | 1 | 0.39mi |
| 3431 Pointe Creek Ct Bonita Springs, FL | 2.0–3.0 | 2.0 | 1414 | $2,365 | $1.67 | 19d | 2 | 0.40mi |
| 3451 Ballybridge Cir #103 Bonita Springs, FL | 3.0 | 2.0 | 1703 | $6,500 | $3.82 | 23d | 1 | 0.41mi |
| 8861 Colonnades Ct W #216 Bonita Springs, FL | 3.0 | 2.0 | 1207 | $2,200 | $1.82 | 23d | 1 | 0.46mi |
| 24821 Lakemont Cove Ln #101 Bonita Springs, FL | 2.0 | 2.0 | 1203 | $6,500 | $5.40 | 23d | 1 | 0.66mi |
| 24821 Lakemont Cove Ln #201 Bonita Springs, FL | 3.0 | 2.0 | 1633 | $7,000 | $4.29 | 23d | 1 | 0.66mi |
| 24821 Lakemont Cove Ln #202 Bonita Springs, FL | 3.0 | 2.0 | 1658 | $5,000 | $3.02 | 21d | 1 | 0.66mi |
| 24827 Lakemont Cove Ln #101 Bonita Springs, FL | 2.0 | 2.0 | 1552 | $6,750 | $4.35 | 23d | 1 | 0.67mi |
| 25130 Sandpiper Greens Ct #104 Bonita Springs, FL | 2.0 | 2.0 | 1392 | $6,500 | $4.67 | 23d | 1 | 0.77mi |
| 9061 Isla Bella Cir Bonita Springs, FL | 3.0 | 2.0 | 1929 | $7,900 | $4.10 | 23d | 1 | 0.90mi |
| 4200 Sawgrass Point Dr #101 Bonita Springs, FL | 2.0 | 2.0 | 1445 | $5,250 | $3.63 | 23d | 1 | 0.92mi |
| 4161 Sawgrass Point Dr #101 Bonita Springs, FL | 2.0 | 2.0 | 1445 | $5,500 | $3.81 | 23d | 1 | 0.95mi |
| 4161 Sawgrass Point Dr #101 Bonita Springs, FL | 2.0 | 2.0 | 1445 | $5,500 | $3.81 | 21d | 1 | 0.95mi |
| 4201 Sawgrass Point Dr #102 Bonita Springs, FL | 2.0 | 2.0 | 1319 | $5,000 | $3.79 | 23d | 1 | 0.98mi |
| 26310 Coco Cay Cir Unit 201 Bonita Springs, FL | 3.0 | 3.5 | 1840 | $3,195 | $1.74 | 23d | 1 | 1.02mi |
| 25151 Bay Cedar Dr Bonita Springs, FL | 2.0 | 2.0 | 1738 | $11,000 | $6.33 | 2d | 1 | 1.03mi |
| 26331 Coco Cay Cir Unit 103 Bonita Springs, FL | 2.0 | 2.5 | 1520 | $2,100 | $1.38 | 21d | 1 | 1.05mi |
| 26331 Coco Cay Cir #203 Bonita Springs, FL | 3.0 | 3.5 | 2027 | $3,500 | $1.73 | 23d | 1 | 1.05mi |
| 26390 Coco Cay Cir #101 Bonita Springs, FL | 2.0 | 2.5 | 1498 | $2,700 | $1.80 | 23d | 1 | 1.10mi |
| 26343 Clarkston Dr Bonita Springs, FL | 3.0 | 2.0 | 2148 | $9,500 | $4.42 | 23d | 1 | 1.10mi |
| 3321 Glen Cairn Ct #102 Bonita Springs, FL | 3.0 | 2.5 | 1912 | $9,000 | $4.71 | 23d | 1 | 1.11mi |
| 9251 Isla Bella Cir Bonita Springs, FL | 2.0 | 3.0 | 2070 | $6,000 | $2.90 | 23d | 1 | 1.14mi |
| 24420 Reserve Ct #202 Bonita Springs, FL | 3.0 | 2.0 | 2244 | $8,000 | $3.57 | 23d | 1 | 1.16mi |
| 25356 Pinson Dr Bonita Springs, FL | 3.0 | 2.0 | 1454 | $3,800 | $2.61 | 23d | 1 | 1.17mi |
| 25356 Pinson Dr Bonita Springs, FL | 3.0 | 2.0 | 1454 | $3,800 | $2.61 | 3d | 1 | 1.17mi |
| 24360 Sandpiper Isle Way #101 Bonita Springs, FL | 2.0 | 2.0 | 1666 | $6,500 | $3.90 | 23d | 1 | 1.20mi |
| 25925 Pebblecreek Dr Bonita Springs, FL | 2.0 | 2.0 | 1498 | $3,400 | $2.27 | 21d | 1 | 1.23mi |
| 24361 Sandpiper Isle Way #401 Bonita Springs, FL | 2.0 | 2.0 | 1807 | $8,000 | $4.43 | 23d | 1 | 1.24mi |
| 4709 Kon Tiki Ln Bonita Springs, FL | 2.0 | 2.0 | 1475 | $1,500 | $1.02 | 23d | 1 | 1.25mi |
| 9304 Lake Abby Ln Bonita Springs, FL | 3.0 | 2.0 | 1631 | $3,700 | $2.27 | 3d | 1 | 1.25mi |
| 9371 Lake Abby Ln Bonita Springs, FL | 3.0 | 2.0 | 1796 | $2,850 | $1.59 | 23d | 1 | 1.26mi |
HOA detail condo
- Monthly dues
- $1,041 · $12,492/yr
- Likely covers
- water
- Assessments
- None detected in remarks — confirm with the listing agent.
Listing history 16 events
-
2026-06-17days on market $520,000 Active 35 DOM
-
2026-06-16days on market $520,000 Active 34 DOM
-
2026-06-15days on market $520,000 Active 33 DOM
-
2026-06-13days on market $520,000 Active 31 DOM
-
2026-06-10days on market $520,000 Active 28 DOM
-
2026-06-09days on market $520,000 Active 27 DOM
-
2026-06-08days on market $520,000 Active 26 DOM
-
2026-06-07days on market $520,000 Active 25 DOM
-
2026-06-03days on market $520,000 Active 21 DOM
-
2026-06-02days on market $520,000 Active 20 DOM
-
2026-06-01days on market $520,000 Active 19 DOM
-
2026-05-31days on market $520,000 Active 18 DOM
-
2026-05-13$520,000 Active
-
2001-11-06soldstatus $215,000
-
2001-09-17soldstatus $210,000
-
1995-04-01soldstatus $196,000
ⓘ Source: listings_history table (triggers on properties + properties_extension) + one-shot
backfill from property_details.listing_events for pre-trigger history.
Tax reassessment forecast FL · Resets to sale price
- Current annual tax
- $5,692 · $474/mo
- Projected year-2 tax
- $5,692 · $474/mo
- Expected delta
- $0/yr ($0/mo · 0.0%)
ⓘ Screening estimate from a state-policy table — verify with the county assessor before closing.
Climate risk First Street
- Flood 7/10 Severe FEMA zone X (shaded) · 75% chance over 30 yrs
- Wildfire 1/10 Low
- Heat 9/10 Extreme 6 d/yr ≥107°F today · 26 d/yr by 30 yrs out
- Wind 10/10 Extreme 99% chance of damaging wind over 30 yrs
- Air quality 3/10 Moderate 2 unhealthy d/yr today · 2 by 30 yrs out
Nearby sold comps map
Loading sold comps map…
Walkable amenities ~0.75 mi
Loading nearby amenities…
Taxation est. · year 1
- Rental income
- $38,658
- − Mortgage interest
- −$29,128
- − Property taxes
- −$5,692
- − Insurance
- −$3,398
- − Repairs & maintenance
- −$3,093
- − Management
- −$3,093
- − HOA
- −$12,492
- − Depreciation
- −$15,127
- Taxable loss
- −$33,364
- Est. tax savings @ 24.0%
- +$8,007
- After-tax cash flow
- $-15,758/yr
For passive investors: Depreciation is non-cash, so a rental often shows a tax loss while cash-flowing — sheltering income. Rental losses are passive: they offset passive income freely, and up to $25,000/yr can offset ordinary (W-2) income if you actively participate and your MAGI is under $100k (phasing out to $0 by $150k); unused losses carry forward. On sale, claimed depreciation is recaptured at up to 25%, and gains may owe capital-gains tax (a 1031 exchange can defer both). Figures are a year-1 estimate at your 24.0% rate — not tax advice; consult a CPA.
Schools (NCES district)
- District
- Lee
- NCES district ID
- 1201080
- Math proficiency
- 47% ▼ -11.00%
- Reading proficiency
- 50% ▼ -4.00%
- Median HH income
- $49,518
- Composite
- 41.49/100
- National rank
- #3458
- State rank
- #42 of 73 in FL
Livability — Bonita Springs
- Score
- 70/100
- State rank
- #428
- US rank
- #7576
Category grades
Schools grade is shown separately in the Schools card above.
Census & demographics
- Census place
- Bonita Springs, FL
- County
- Lee County · 788,662 people
- City population
- 64,727
- Metro
- Cape Coral-Fort Myers, FL
- Population (ZIP)
- 16,475
- Household income
- $130,719
- Rent vs Own
- Severe rent burden
- 554.0
Population outlook (Lee County) Hauer SSP2
- Today (2025)
- 871,946 people
- By 2030
- 955,468 · +9.6%
- By 2040
- 1,113,587 · +27.7%
- By 2050
- 1,256,891 · +44.1%
- By 2075
- 1,560,270 · +78.9%
- By 2100
- 1,726,848 · +98.0%
Race, ethnicity, and origin ACS 2023
- Neighborhood character
- Predominantly White (91%)
- Race & ethnicity
- White 91% Hispanic / Latino 5% Two or more races 3% Asian 1%
- Common ancestry
- Slovak 5% Romanian 4% Serbian 2%
- Foreign-born
- 10% · Canada, Jamaica
- Languages at home
- 91% English-only · Spanish 4% German/W. Germanic 1% Other Indo-European 1%
Political lean MEDSL · Lee
- 2024 margin
- Strong R (+28.4) · D 35.5% · R 63.9%
- 2008→2024 swing
- -18.0pp toward R · 2008: -10.4pp · 2024: -28.4pp
- All cycles
- 2024: R+28.4 2020: R+19.2 2016: R+20.4 2012: R+16.6 2008: R+10.4
Not yet ingested
- Civics
- —
Market trends
- HPI YoY
- ▼ -236.48%
- Current HPI
- 237.4416
- Rent YoY
- ▲ 2.85%
- Metro
- Cape Coral-Fort Myers, FL
- State GDP YoY
- ▲ 3.28%
- F500 in state
- 36
Industry mix (Fortune 500 HQ in FL)
| Industry | F500 HQs | Revenue |
|---|---|---|
| Industrial Technology | 2 | $29B |
|
||
| Insurance | 2 | $17B |
|
||
| Retail | 1 | $60B |
|
||
| Technology Distribution | 1 | $58B |
|
||
| Homebuilding | 1 | $35B |
|
||
| Technology Manufacturing | 1 | $35B |
|
||
Price history
+165.3% since first listed4 events — show timeline
- 2026-05-13 Listed $520,000 BEARMLS
- 2001-11-06 Sold (Public Records) $215,000 Public Records
- 2001-09-17 Sold (Public Records) $210,000 Public Records
- 1995-04-01 Sold (Public Records) $196,000 Public Records
Property tax history
+2.5%/yrLatest (2025): $5,692 · -9.8% YoY. Source: county tax records.
Cash-flow waterfall
monthlySold comps — $/sqft
last 12 mo · ≤1 miLoading sold comps…