3221 25th St N · Birmingham, AL
Flood risk 1/10 · Minimal
- FEMA flood zone
- X (unshaded)
- Chance of flooding over 30 yrs
- 0.0%
- Est. flood insurance / yr
- $507 – $1,088
Fire risk 3/10 · Minor
- Est. fire insurance / yr
- $916 – $1,700
Heat risk 7/10 · Major
- Hot days now (above 106°F)
- 7 days/yr
- Hot days in 30 yrs
- 21 days/yr
Wind risk 6/10 · Moderate
- Chance of severe wind over 30 yrs
- 27.0%
Air-quality risk 5/10 · Moderate
- Unhealthy air days now
- 9 days/yr
- Unhealthy air days in 30 yrs
- 10 days/yr
Risk factors via First Street. Map © Google.
Why this score? — see what drove the C+ grade
The composite is a weighted blend of 9 inputs, each scored 0–100. Each bar is that input's sub-score; the figure is the points it added to the 100-point composite (weight × sub-score).
- Cash flow +23.5/30.0
- Appreciation +10.0/10.0
- DSCR +7.6/10.0
- ARV discount +7.5/15.0
- 1% rule +5.5/10.0
- Livability +3.4/5.0
- Rent growth +2.5/5.0
- Condition / age +2.5/5.0
- Schools +0.9/10.0
$95,000
🖨 Deal sheet (PDF) 📄 Offer letter ✓ Due diligence
Listing remarks MLS
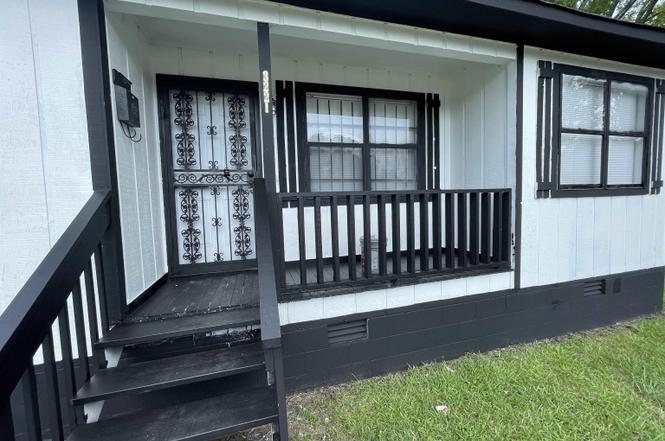
CHECK OUT THIS GREAT STARTER HOME, INVESTOR OR RENTAL PROPERTY. 3BR 2 FULL BATHS, EAT IN KITCHEN, LAUNDRY ROOM AND NEW HVAC. HOME IS BEING SOLD AS IS. COME TAKE A LOOK
Key facts
- Functional layout
- Newer hvac system
- 6,969 sq ft lot
Tags
Neighborhood map
What this means for you Summary
Snapshot
- This is a 3-bed/1.0-bath single-family listed at $95k.
Deal economics
- At list price, monthly cash flow is $178 ($2k/yr) — positive.
- The deal already cash-flows at list — no discount required.
- Meets the 1% rule at list price ($996 rent vs $95k).
- Cap rate 8.5% vs local median 6.2% in Birmingham — top-decile yield for the area; either an underpriced asset or a hidden risk that comps aren't pricing in. Stress-test before assuming the spread holds.
Location & tenants
- Location reads 67/100 on livability (#78 in AL) — a middle-class / working-renter tenant base. Strengths: commute A+, cost of living A+, housing A+; Watch: amenities C-, crime F, employment F.
- Birmingham City (urban): math 4% / reading 20% proficiency, ranked #116 of 129 in AL (top 90%) — low school quality limits family demand, transient renter base, plan for 1-2y turnover; 82% free/reduced lunch — lower-income household profile, screen leases tightly.
- Zoned schools: Hudson Keight School (math 0% / reading 7%, grade F, #627 of 627 statewide, top 100%, 633 students, 94% FRL); George Washington Carver High School (math 2% / reading 17%, grade F, #252 of 305 statewide, top 84%, 531 students, 87% FRL).
- Market conditions: 42 active listings in the ZIP; 40 comparable units currently listed for rent nearby; rentals at typical pace (median 25d on market — plan ~3-4 weeks tenant-placement turnaround); 2,114 units permitted in Jefferson County in 2024 (556 in 5+ unit buildings).
Forward outlook
- In year one you build about $10k of equity ($657 loan paydown + $10k appreciation (10.0% local appreciation)).
- Jefferson County population projected to shrink 4% by 2050 — rents likely to lag national; underwrite the cash flow, not the appreciation.
- At projected returns (10.0% appreciation + 3.0% rent growth), your $27k cash investment doubles in ~3 years — after that, you're playing with house money.
- By year 4, paydown + projected appreciation supports a ~$36k cash-out refi (75% LTV) — recoverable capital for the next deal without selling this one.
Negotiation context
- Only 7 days on market — expect competitive offers; lowballing is unlikely to land.
- 2 sale attempts since 3y ago with the ask held roughly flat each time — persistent listings suggest the price (not the market) is what's stuck; bring a comps-based counter.
- Current owner paid $64k; 50% above their basis — modest negotiation headroom, anchor on the comps not their cost.
Risks & watch-outs
- Climate carrying-cost: major wind risk, 27% chance of damaging wind over 30y; extreme-heat days projected 7→21/yr by 2055 (HVAC capex compounding) — expect insurance premiums to compound above CPI over the hold.
Questions for the listing agent
- Is there a deadline driving the sale (1031 exchange, divorce, estate, relocation)? That informs how much negotiation room exists.
- Schools are F-rated, which usually means shorter tenancies and higher turnover. Who's the typical renter profile here, and what's been the actual vacancy rate?
- Crime grade is F in this area — have there been break-ins, vandalism, or insurance claims at this property in the last 3 years? What carrier currently insures it and at what premium?
- What's the average days-on-market for RENTAL listings here right now (not sales)? A rising rental-DOM trend means longer vacancies and softer asking-rent achievability than the comps imply.
- What's the recent tenant-quality profile in this submarket — average credit score on applications, eviction rate, late-payment / NSF rate, and stable-employment percentage? A property-management company in the area should have these aggregated.
- How much new for-sale + rental construction is in the pipeline within 1–3 miles? Heavy new supply typically softens prices + rents 12–24 months out; constrained supply supports both.
Investment metrics
- 1% rule
- 1.05% ✓
- Cap rate
- 8.54%
- Cash-on-cash
- 8.03%
- DSCR
- 1.36
- GRM
- 8.0
CMA / ARV
- ARV (on-the-fly)
- $57,024
- Comps found
- 8
Show comp detail 8 sales within ~0.75 mi
| Address | Dist | Beds/Ba | Sqft | Sold | Price | $/sf | Match |
|---|---|---|---|---|---|---|---|
| 2129 N 30th Ave | 0.36mi | 3/1.5 | 1,042 (-1%) | 9mo | $45,000 | $43 | 72 |
| 2312 32nd Ave | 0.16mi | 3/2.0 | 1,102 (+4%) | 12mo | $159,000 | $144 | 71 |
| 2700 24th St | 0.42mi | 3/1.0 | 1,056 (0%) | 20mo | $82,500 | $78 | 64 |
| 3120 24th St | 0.13mi | 3/1.0 | 925 (-12%) | 15mo | $50,000 | $54 | 61 |
| 2115 32nd Ave N | 0.33mi | 3/2.0 | 1,144 (+8%) | 17mo | $99,000 | $87 | 52 |
| 1925 33rd Ave N | 0.47mi | 3/1.0 | 1,156 (+10%) | 17mo | $32,000 | $28 | 48 |
| 2808 38th Ave N | 0.49mi | 3/2.0 | 1,176 (+11%) | 11mo | $20,000 | $17 | 45 |
| 2418 Finley Blvd | 0.59mi | 3/1.0 | 1,144 (+8%) | 20mo | $50,000 | $44 | 42 |
Match score weights: distance 35% · size 25% · config 20% · recency 20%. Top-matched comps best support the ARV.
Projected returns pro-forma
10.0% appreciation · 3.0% rent growth · sell at horizon
- IRR
- 30.1%
- Equity multiple
- 3.37×
- Total profit
- $63,062
- Equity at exit
- $85,584
- IRR
- 26.1%
- Equity multiple
- 7.65×
- Total profit
- $176,763
- Equity at exit
- $184,564
Cash invested: $26,600 (down + closing). Projections, not guarantees.
Landlord ↔ Tenant lean methodology
- Overall (STATE)
- 90 Strongly Landlord-Friendly
- State Alabama
- 90 Strongly Landlord-Friendly · R+15
- County
- — inherits STATE
- City
- — inherits STATE
ZIP-level market 35207
- Home prices YoY
- 18.7%
- Active inventory
- 42
- Price-to-rent
- 8.0×
Monthly cashflow live
- Estimated rent
- $996 high interval (Pro) →
- Mortgage (P&I)
- −$498
- Tax from tax record
- −$71 /mo · $850/yr
- Insurance
- −$40
- HOA
- −$0
- Vacancy / Maint / Mgmt
- −$209
- Net cashflow
- $178
Break-even live
Sensitivity live
| Price | -10% $232 | -5% $205 | +0% $178 | +5% $151 | +10% $124 |
|---|---|---|---|---|---|
| Rent | -10% $99 | -5% $139 | +0% $178 | +5% $217 | +10% $257 |
| Rate | -1.0pp $226 | -0.5pp $202 | base $178 | +0.5pp $153 | +1.0pp $128 |
UW: 25.0% down · 7.5% · 30yr · 1.5% tax · 5.0% vac · 8.0% maint · 8.0% mgmt
Financing live
Cash to close
- Down payment
- $23,750
- Closing costs
- $2,850
- Reserves months
- —
- Total cash needed
- —
Loan-product check · same deal, 3 products live
Conventional
25% down · 7.5% · 30yr
- Down + closing
- —
- Monthly P&I
- —
- Monthly cashflow
- —
- DSCR
- —
- Eligible?
- —
Personal DTI + credit; lowest rate.
DSCR
20% down · 8.5% · 30yr
- Down + closing
- —
- Monthly P&I
- —
- Monthly cashflow
- —
- DSCR
- —
- Eligible?
- —
No personal income docs; deal must DSCR.
Hard money
10% down · 12.0% · 12mo
- Down + closing
- —
- Monthly P&I
- —
- Monthly cashflow
- —
- DSCR
- —
- Eligible?
- —
Short-term bridge; refi at stabilization.
Rent comps 40 comps
| Address | Beds | Baths | Sqft | Rent | $/sqft | DOM | Units | Dist |
|---|---|---|---|---|---|---|---|---|
| 2129 30th Ave N Birmingham, AL | 3.0 | 1.0 | 1042 | $1,000 | $0.96 | 44d | 1 | 0.37mi |
| 2015 36th Ave N Birmingham, AL | 3.0 | 1.0 | 1468 | $1,190 | $0.81 | 24d | 1 | 0.49mi |
| 1721 35th Ave N Birmingham, AL | 2.0 | 1.0 | 1184 | $875 | $0.74 | 44d | 1 | 0.70mi |
| 3016 33rd Ct N Birmingham, AL | 3.0 | 1.0 | 1012 | $1,100 | $1.09 | 44d | 1 | 0.70mi |
| 1709 36th Ave N Birmingham, AL | 3.0 | 1.0 | 970 | $1,350 | $1.39 | 44d | 1 | 0.72mi |
| 2129 30th Pl N Birmingham, AL | 3.0 | 1.0 | 1042 | $1,000 | $0.96 | 24d | 1 | 0.74mi |
| 1625 29th Ave N Birmingham, AL | 3.0 | 2.0 | 1140 | $1,200 | $1.05 | 16d | 1 | 0.80mi |
| 2428 21st Ave N Birmingham, AL | 2.0 | 1.0 | 700 | $975 | $1.39 | 11d | 1 | 0.95mi |
| 2428 21st Ave N Birmingham, AL | 2.0 | 1.0 | 700 | $975 | $1.39 | 3d | 1 | 0.95mi |
| 2428 21st Ave N Birmingham, AL | 2.0 | 1.0 | 700 | $975 | $1.39 | 2d | 1 | 0.95mi |
| 2108 25th St N Birmingham, AL | 4.0 | 2.0 | 1446 | $1,300 | $0.90 | 44d | 1 | 0.96mi |
| 2300 21st Ave N Birmingham, AL | 2.0 | 1.0 | 700 | $880 | $1.26 | 44d | 2 | 0.99mi |
| 2608 20th Ave N Unit 5 Birmingham, AL | 2.0 | 1.0 | 750 | $875 | $1.17 | 44d | 1 | 1.01mi |
| 2608 20th Ave N Birmingham, AL | 2.0 | 1.0 | 750 | $895 | $1.19 | 44d | 1 | 1.01mi |
| 2000 Stouts Rd Birmingham, AL | 2.0 | 1.0 | 700 | $880 | $1.26 | 44d | 2 | 1.07mi |
| 2400 19th Ave N Unit B Birmingham, AL | 2.0 | 1.0 | 750 | $850 | $1.13 | 22d | 1 | 1.09mi |
| 2212 20th St N Birmingham, AL | 3.0 | 1.0 | 1141 | $895 | $0.78 | 44d | 1 | 1.13mi |
| 1911 19th Ct N Apt 1 Birmingham, AL | 2.0 | 1.0 | 750 | $845 | $1.13 | 12d | 1 | 1.18mi |
| 1917 18th Pl N Birmingham, AL | 2.0 | 1.0 | 900 | $799 | $0.89 | 15d | 1 | 1.22mi |
| 2012 18th Pl N Birmingham, AL | 2.0 | 1.0 | 900 | $799 | $0.89 | 11d | 1 | 1.22mi |
| 2010 18th Pl N Birmingham, AL | 2.0 | 1.0 | 900 | $799 | $0.89 | 11d | 1 | 1.22mi |
| 2004 18th Pl N Unit 2004 Birmingham, AL | 2.0 | 1.0 | 900 | $799 | $0.89 | 15d | 1 | 1.22mi |
| 1994 18th Pl N Birmingham, AL | 2.0 | 1.0 | 900 | $799 | $0.89 | 15d | 1 | 1.22mi |
| 3373 33rd Pl N Birmingham, AL | 3.0 | 1.0 | 912 | $1,150 | $1.26 | 4d | 1 | 1.23mi |
| 1954 18th Pl N Birmingham, AL | 2.0 | 1.0 | 900 | $975 | $1.08 | 44d | 1 | 1.23mi |
| 1940 18th Pl N Unit 1940 Birmingham, AL | 2.0 | 1.0 | 900 | $799 | $0.89 | 15d | 1 | 1.23mi |
| 1938 18th Pl N Unit 1938 Birmingham, AL | 2.0 | 1.0 | 900 | $799 | $0.89 | 15d | 1 | 1.23mi |
| 3732 4th St W Birmingham, AL | 4.0 | 1.0 | 1185 | $900 | $0.76 | 44d | 1 | 1.23mi |
| 1909 18th St N Unit 1909 Birmingham, AL | 2.0 | 1.0 | 900 | $799 | $0.89 | 15d | 1 | 1.25mi |
| 1906 18th Pl N Birmingham, AL | 2.0 | 1.0 | 900 | $799 | $0.89 | 15d | 1 | 1.27mi |
| 3376 34th St N Birmingham, AL | 3.0 | 1.0 | 928 | $1,200 | $1.29 | 12d | 1 | 1.27mi |
| 3376 34th St N Birmingham, AL | 3.0 | 2.0 | 928 | $1,200 | $1.29 | 24d | 1 | 1.27mi |
| 3001 Norwood Blvd Birmingham, AL | 2.0 | 2.0 | 1092 | $1,500 | $1.37 | 4d | 1 | 1.28mi |
| 3417 4th St W Birmingham, AL | 3.0 | 2.0 | 1275 | $1,000 | $0.78 | 44d | 1 | 1.33mi |
| 1576 20th St N Apt D Birmingham, AL | 2.0 | 1.0 | 900 | $725 | $0.81 | 44d | 1 | 1.37mi |
| 1742 17th St N Unit 2 Birmingham, AL | 3.0 | 2.0 | 1300 | $1,500 | $1.15 | 16d | 1 | 1.40mi |
| 3311 16th Ave N Unit 3321 Birmingham, AL | 2.0 | 1.0 | 750 | $850 | $1.13 | 24d | 1 | 1.41mi |
| 3311 16th Ave N Unit 3317 Birmingham, AL | 2.0 | 1.0 | 750 | $850 | $1.13 | 44d | 1 | 1.41mi |
| 3311 16th Ave N Unit 3323 Birmingham, AL | 2.0 | 1.0 | 750 | $850 | $1.13 | 2d | 1 | 1.41mi |
| 424 34th Ave W Birmingham, AL | 3.0 | 2.0 | 969 | $1,050 | $1.08 | 24d | 1 | 1.42mi |
Listing history 6 events
-
2025-08-06status Pending
-
2025-07-30$95,000 Active
-
2023-04-10soldstatus $63,500
-
2023-04-06soldstatus $63,500 Sold 167-char remark
Show marketing remark (167 chars)
CHECK OUT THIS GREAT STARTER HOME, INVESTOR OR RENTAL PROPERTY. 3BR 2 FULL BATHS, EAT IN KITCHEN, LAUNDRY ROOM AND NEW HVAC. HOME IS BEING SOLD AS IS. COME TAKE A LOOK
-
2023-03-15historical Contingent 167-char remark
Show marketing remark (167 chars)
CHECK OUT THIS GREAT STARTER HOME, INVESTOR OR RENTAL PROPERTY. 3BR 2 FULL BATHS, EAT IN KITCHEN, LAUNDRY ROOM AND NEW HVAC. HOME IS BEING SOLD AS IS. COME TAKE A LOOK
-
2023-03-13$63,500 Active 167-char remark
Show marketing remark (167 chars)
CHECK OUT THIS GREAT STARTER HOME, INVESTOR OR RENTAL PROPERTY. 3BR 2 FULL BATHS, EAT IN KITCHEN, LAUNDRY ROOM AND NEW HVAC. HOME IS BEING SOLD AS IS. COME TAKE A LOOK
ⓘ Source: listings_history table (triggers on properties + properties_extension) + one-shot
backfill from property_details.listing_events for pre-trigger history.
Tax reassessment forecast AL · Resets to sale price
- Current annual tax
- $850 · $71/mo
- Projected year-2 tax
- $850 · $71/mo
- Expected delta
- $0/yr ($0/mo · 0.0%)
ⓘ Screening estimate from a state-policy table — verify with the county assessor before closing.
Climate risk First Street
- Flood 1/10 Low FEMA zone X (unshaded) · 0% chance over 30 yrs
- Wildfire 3/10 Moderate
- Heat 7/10 Severe 7 d/yr ≥106°F today · 21 d/yr by 30 yrs out
- Wind 6/10 Major 27% chance of damaging wind over 30 yrs
- Air quality 5/10 Major 9 unhealthy d/yr today · 10 by 30 yrs out
Nearby sold comps map
Loading sold comps map…
Walkable amenities ~0.75 mi
Loading nearby amenities…
Taxation est. · year 1
- Rental income
- $11,948
- − Mortgage interest
- −$5,321
- − Property taxes
- −$850
- − Insurance
- −$475
- − Repairs & maintenance
- −$956
- − Management
- −$956
- − Depreciation
- −$2,764
- Taxable income
- $627
- Est. tax owed @ 24.0%
- −$150
- After-tax cash flow
- $1,986/yr
For passive investors: Depreciation is non-cash, so a rental often shows a tax loss while cash-flowing — sheltering income. Rental losses are passive: they offset passive income freely, and up to $25,000/yr can offset ordinary (W-2) income if you actively participate and your MAGI is under $100k (phasing out to $0 by $150k); unused losses carry forward. On sale, claimed depreciation is recaptured at up to 25%, and gains may owe capital-gains tax (a 1031 exchange can defer both). Figures are a year-1 estimate at your 24.0% rate — not tax advice; consult a CPA.
Schools (NCES district)
- District
- Birmingham City
- NCES district ID
- 0100390
- Math proficiency
- 4% ▼ -17.00%
- Reading proficiency
- 20% ▼ -4.00%
- Median HH income
- $31,988
- Composite
- 9.49/100
- National rank
- #9850
- State rank
- #116 of 129 in AL
Livability — Birmingham
- Score
- 67/100
- State rank
- #78
- US rank
- #10412
Category grades
Schools grade is shown separately in the Schools card above.
Census & demographics
- Census place
- Birmingham, AL
- City population
- 210,422
- Population (ZIP)
- 6,824
Population outlook (Jefferson County) Hauer SSP2
- Today (2025)
- 669,185 people
- By 2030
- 669,694 · +0.1%
- By 2040
- 661,388 · -1.2%
- By 2050
- 643,086 · -3.9%
- By 2075
- 577,267 · -13.7%
- By 2100
- 474,758 · -29.1%
Race, ethnicity, and origin ACS 2023
- Neighborhood character
- Predominantly Black (86%)
- Race & ethnicity
- Black 86% White 7% Hispanic / Latino 6%
- Hispanic origin (detail)
- Mexican 5%
- Common ancestry
- Romanian 1% Hispanic 1%
- Foreign-born
- 3% · Canada
- Languages at home
- 92% English-only · Spanish 6% French/Haitian/Cajun 1%
Political lean MEDSL · Jefferson
- 2024 margin
- D (+10.4) · D 54.6% · R 44.2% · Other 1.2%
- 2008→2024 swing
- +5.4pp toward D · 2008: 5.1pp · 2024: 10.4pp
- All cycles
- 2024: D+10.4 2020: D+13.2 2016: D+7.2 2012: D+6.0 2008: D+5.1
Not yet ingested
- Civics
- —
Market trends
- HPI YoY
- ▲ 35.95%
- Current HPI
- 228.5664
- Rent YoY
- —
- Metro
- —
- State GDP YoY
- ▲ 2.94%
- F500 in state
- 4
Industry mix (Fortune 500 HQ in AL)
| Industry | F500 HQs | Revenue |
|---|---|---|
| Financial Services | 1 | $8B |
|
||
| Healthcare | 1 | $5B |
|
||
Price history
+49.6% since first listed6 events — show timeline
- 2025-08-06 Pending — Greater Alabama MLS
- 2025-07-30 Listed $95,000 Greater Alabama MLS
- 2023-04-10 Sold (Public Records) $63,500 Public Records
- 2023-04-06 Sold (MLS) $63,500 Greater Alabama MLS
- 2023-03-15 Contingent — Greater Alabama MLS
- 2023-03-13 Listed $63,500 Greater Alabama MLS
Property tax history
+8.3%/yrLatest (2025): $850 · -1.8% YoY. Source: county tax records.
Cash-flow waterfall
monthlySold comps — $/sqft
last 12 mo · ≤1 miLoading sold comps…