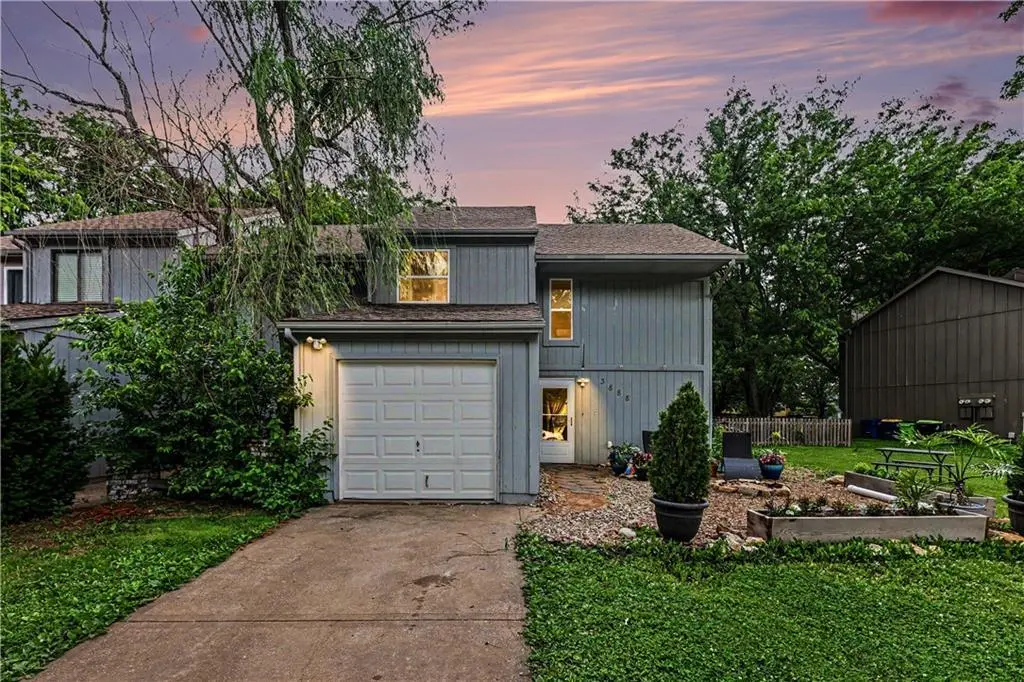
3888 SW Harbor Dr · Lee's Summit, MO
Flood risk 1/10 · Minimal
- FEMA flood zone
- X (unshaded)
- Chance of flooding over 30 yrs
- 0.0%
- Est. flood insurance / yr
- $507 – $1,088
Fire risk 3/10 · Minor
- Est. fire insurance / yr
- $1,054 – $1,958
Heat risk 4/10 · Minor
- Hot days now (above 107°F)
- 7 days/yr
- Hot days in 30 yrs
- 17 days/yr
Wind risk 2/10 · Minimal
- Chance of severe wind over 30 yrs
- —
Air-quality risk 2/10 · Minimal
- Unhealthy air days now
- 1 days/yr
- Unhealthy air days in 30 yrs
- 2 days/yr
Risk factors via First Street. Map © Google.
Why this score? — see what drove the C+ grade
The composite is a weighted blend of 9 inputs, each scored 0–100. Each bar is that input's sub-score; the figure is the points it added to the 100-point composite (weight × sub-score).
- Cash flow +20.5/30.0
- ARV discount +15.0/15.0
- DSCR +6.5/10.0
- 1% rule +4.9/10.0
- Schools +4.6/10.0
- Rent growth +4.3/5.0
- Livability +2.5/5.0
- Condition / age +2.5/5.0
- Appreciation +0.0/10.0
$200,000
🖨 Deal sheet 📄 Offer letter ✓ Due diligence
Listing remarks MLS
Come enjoy life at Raintree Lake, Cozy and updated townhome. Lots of new in this home. Flooring, windows, newer roof newer appliances, bathrooms, kitchen. And wait til you see this huge fenced backyard! Just a short distance to the water! Life is great in Raintree! Put your boat on the water and fish or just have fun in the sun!
Key facts
- Play area
- Lake privileges
- Access for your boat
Tags
Property features AI
Finance
- HOA & community: Community clubhouse; Community pool
Exterior
- Parking: Attached garage with garage door opener (garage faces front); 1-car garage
- Security: Smoke detector(s)
- Utilities: Public water; Public sewer
- Home design: Attached townhouse; 2 stories; Residential property
- Construction: Frame construction; Composition roof
- Exterior features: Level lot; Wood fencing; Lake access
Interior
- Kitchen: Dishwasher; Disposal; Microwave
- Bedrooms: 3 bedrooms
- Flooring: Wood flooring
- Bathrooms: 1 full bath; 1 half bath
- Heating & cooling: Electric heating; Electric cooling (central air)
- Interior features: Balcony/Loft; Smoke detector(s)
- Laundry & utility: Washer; Dryer; Laundry located off the kitchen
Neighborhood map
What this means for you Summary
Snapshot
- This is a 3-bed/1.0-bath townhouse listed at $200k.
Deal economics
- At list price, monthly cash flow is $262 ($3k/yr) — positive.
- The deal already cash-flows at list — no discount required.
- To meet the 1% rule (rent ≥ 1% of price), the offer needs to be $199k (0.7% below list).
- Recommended offer: $199k (0.7% below list) — sets the bar for 1% rule.
- Cap rate 7.9% vs local median 2.6% in Lee's Summit — top-decile yield for the area; either an underpriced asset or a hidden risk that comps aren't pricing in. Stress-test before assuming the spread holds.
Location & tenants
- Location reads: area grade C — affects rentability + tenant quality, not the cash-flow math above.
- Lee'S Summit R-VII (suburban): math 46% / reading 55% proficiency, ranked #23 of 324 in MO (top 7%) — acceptable for families but not a draw, mixed tenant base, ~2y average lease; only 16% free/reduced lunch — higher-income household profile.
- Market conditions: Rents rising fast (+7.2%/yr); 193 active listings in the ZIP; 3 comparable units currently listed for rent nearby; rentals lingering (median 44d on market — plan ~5-8 weeks vacancy on turnover, expect pricing pressure); 67% of comp listings sitting > 30 days — soft ceiling on asking rent; high-income renter base; 4,002 units permitted in Jackson County in 2024 (2,271 in 5+ unit buildings).
Forward outlook
- Local home prices are declining (-3.0%/yr); year-one equity from $1k of loan paydown is wiped out by about $6k of value loss. Plan a longer hold.
- Jackson County population projected at +4% by 2050 — modest demand growth; plan on rents tracking national, not racing it.
- At projected returns (-3.0% appreciation + 7.2% rent growth), your $56k cash investment doubles in ~10 years — after that, you're playing with house money.
Negotiation context
- Only 3 days on market — expect competitive offers; lowballing is unlikely to land.
- 4 sale attempts since 20y ago with the ask held roughly flat each time — persistent listings suggest the price (not the market) is what's stuck; bring a comps-based counter.
Questions for the listing agent
- Is there a deadline driving the sale (1031 exchange, divorce, estate, relocation)? That informs how much negotiation room exists.
- What's the average days-on-market for RENTAL listings here right now (not sales)? A rising rental-DOM trend means longer vacancies and softer asking-rent achievability than the comps imply.
- What's the recent tenant-quality profile in this submarket — average credit score on applications, eviction rate, late-payment / NSF rate, and stable-employment percentage? A property-management company in the area should have these aggregated.
- How much new for-sale + rental construction is in the pipeline within 1–3 miles? Heavy new supply typically softens prices + rents 12–24 months out; constrained supply supports both.
Investment metrics
- 1% rule
- 0.99% ✗
- Cap rate
- 7.86%
- Cash-on-cash
- 5.61%
- DSCR
- 1.25
- GRM
- 8.4
CMA / ARV
- ARV (on-the-fly)
- $268,088
- Comps found
- 12
Show comp detail 12 sales within ~0.75 mi
| Address | Dist | Beds/Ba | Sqft | Sold | Price | $/sf | Match |
|---|---|---|---|---|---|---|---|
| 1209 SW Wysteria Dr | 0.74mi | 3/2.0 | 1,394 (-2%) | 2mo | $275,000 | $197 | 56 |
| 1142 SW Arborfair Dr | 0.69mi | 2/2.0 (-1) | 1,435 (+1%) | 6mo | $255,000 | $178 | 52 |
| 3486 SW Wysteria Ter | 0.55mi | 2/2.5 (-1) | 1,379 (-3%) | 10mo | $230,000 | $167 | 49 |
| 1162 Arbormill Ter | 0.65mi | 2/2.0 (-1) | 1,450 (+2%) | 11mo | $285,000 | $197 | 48 |
| 206 SW Chartwell Dr | 0.67mi | 2/2.0 (-1) | 1,381 (-3%) | 11mo | $260,000 | $188 | 45 |
| 1108 SW Wysteria Dr | 0.70mi | 3/2.0 | 1,424 (-0%) | 22mo | $260,000 | $183 | 45 |
| 1100 SW Arborfair Dr | 0.68mi | 3/2.0 | 1,542 (+8%) | 8mo | $275,000 | $178 | 44 |
| 3470 SW Wysteria Ter | 0.58mi | 2/2.5 (-1) | 1,386 (-3%) | 19mo | $225,000 | $162 | 41 |
| 3452 SW Arborway Dr | 0.61mi | 2/2.5 (-1) | 1,467 (+3%) | 18mo | $210,000 | $143 | 40 |
| 326 Raintree Dr | 0.75mi | 2/2.5 (-1) | 1,387 (-3%) | 15mo | $279,900 | $202 | 37 |
| 1040 SW Wysteria Dr | 0.66mi | 2/2.0 (-1) | 1,290 (-10%) | 18mo | $260,000 | $202 | 29 |
| 1042 SW Wysteria Dr | 0.67mi | 2/2.5 (-1) | 1,256 (-12%) | 12mo | $270,000 | $215 | 28 |
Match score weights: distance 35% · size 25% · config 20% · recency 20%. Top-matched comps best support the ARV.
Projected returns pro-forma
-3.0% appreciation · 7.23% rent growth · sell at horizon
- IRR
- -3.2%
- Equity multiple
- 0.88×
- Total profit
- $-6,936
- Equity at exit
- $29,821
- IRR
- 10.6%
- Equity multiple
- 1.98×
- Total profit
- $54,832
- Equity at exit
- $17,292
Cash invested: $56,000 (down + closing). Projections, not guarantees.
Landlord ↔ Tenant lean methodology
- Overall (STATE)
- 81 Strongly Landlord-Friendly
- State Missouri
- 81 Strongly Landlord-Friendly · R+10
- County
- — inherits STATE
- City
- — inherits STATE
ZIP-level market 64082
- Rents YoY
- 7.2%
- Active inventory
- 193
- Price-to-rent
- 8.4×
Monthly cashflow live
- Estimated rent
- $1,986 medium interval (Pro) →
- Mortgage (P&I)
- −$1,049
- Tax from tax record
- −$175 /mo · $2,101/yr
- Insurance
- −$83
- HOA
- −$0
- Vacancy / Maint / Mgmt
- −$417
- Net cashflow
- $262
Break-even live
UW: 25.0% down · 7.5% · 30yr · 1.5% tax · 5.0% vac · 8.0% maint · 8.0% mgmt
Financing live
Cash to close
- Down payment
- $50,000
- Closing costs
- $6,000
- Reserves months
- —
- Total cash needed
- —
Loan-product check · same deal, 3 products live
Conventional
25% down · 7.5% · 30yr
- Down + closing
- —
- Monthly P&I
- —
- Monthly cashflow
- —
- DSCR
- —
- Eligible?
- —
Personal DTI + credit; lowest rate.
DSCR
20% down · 8.5% · 30yr
- Down + closing
- —
- Monthly P&I
- —
- Monthly cashflow
- —
- DSCR
- —
- Eligible?
- —
No personal income docs; deal must DSCR.
Hard money
10% down · 12.0% · 12mo
- Down + closing
- —
- Monthly P&I
- —
- Monthly cashflow
- —
- DSCR
- —
- Eligible?
- —
Short-term bridge; refi at stabilization.
Rent comps 3 comps
| Address | Beds | Baths | Sqft | Rent | $/sqft | DOM | Units | Dist |
|---|---|---|---|---|---|---|---|---|
| 731 SW Lemans Ln Lee's Summit, MO | 3.0 | 2.5 | 1300 | $1,760 | $1.35 | 1d | 3 | 0.17mi |
| 2026 SW Holdbrooks Dr Lees Summit, MO | 3.0 | 3.0 | 1801 | $2,295 | $1.27 | 43d | 1 | 1.44mi |
| 3722 SW Knoxville Ct Lees Summit, MO | 4.0 | 3.0 | 1857 | $2,445 | $1.32 | 43d | 1 | 1.46mi |
Listing history 5 events
-
2026-06-16status $200,000 Pending 3 DOM
-
2026-06-15remarks 628-char remark
-
2026-06-15days on market $200,000 Active 3 DOM
-
2026-06-13remarks 481-char remark
-
2026-06-13$200,000 Active 1 DOM
ⓘ Source: listings_history table (triggers on properties + properties_extension) + one-shot
backfill from property_details.listing_events for pre-trigger history.
Tax reassessment forecast MO · Resets to sale price
- Current annual tax
- $2,101 · $175/mo
- Projected year-2 tax
- $2,101 · $175/mo
- Expected delta
- $0/yr ($0/mo · 0.0%)
ⓘ Screening estimate from a state-policy table — verify with the county assessor before closing.
Climate risk First Street
- Flood 1/10 Low FEMA zone X (unshaded) · 0% chance over 30 yrs
- Wildfire 3/10 Moderate
- Heat 4/10 Moderate 7 d/yr ≥107°F today · 17 d/yr by 30 yrs out
- Wind 2/10 Low
- Air quality 2/10 Low 1 unhealthy d/yr today · 2 by 30 yrs out
Nearby sold comps map
Loading sold comps map…
Walkable amenities ~0.75 mi
Loading nearby amenities…
Taxation est. · year 1
- Rental income
- $23,834
- − Mortgage interest
- −$11,203
- − Property taxes
- −$2,101
- − Insurance
- −$1,000
- − Repairs & maintenance
- −$1,907
- − Management
- −$1,907
- − Depreciation
- −$5,818
- Taxable loss
- −$102
- Est. tax savings @ 24.0%
- +$24
- After-tax cash flow
- $3,166/yr
For passive investors: Depreciation is non-cash, so a rental often shows a tax loss while cash-flowing — sheltering income. Rental losses are passive: they offset passive income freely, and up to $25,000/yr can offset ordinary (W-2) income if you actively participate and your MAGI is under $100k (phasing out to $0 by $150k); unused losses carry forward. On sale, claimed depreciation is recaptured at up to 25%, and gains may owe capital-gains tax (a 1031 exchange can defer both). Figures are a year-1 estimate at your 24.0% rate — not tax advice; consult a CPA.
Schools (NCES district)
- District
- Lee'S Summit R-VII
- NCES district ID
- 2918300
- Math proficiency
- 46% ▼ -12.00%
- Reading proficiency
- 55% ▼ -6.00%
- Median HH income
- $77,031
- Composite
- 45.75/100
- National rank
- #2570
- State rank
- #23 of 324 in MO
Livability — Lee's Summit
No livability data for this city. (Only ~50 U.S. cities are tracked.)
Census & demographics
- Census place
- Lee's Summit, MO
- County
- Jackson County · 687,798 people
- City population
- 86,407
- Metro
- Kansas City, MO-KS
- Population (ZIP)
- 20,068
- Household income
- $131,453
- Rent vs Own
- Severe rent burden
- 77.0
Population outlook (Jackson County) Hauer SSP2
- Today (2025)
- 719,589 people
- By 2030
- 731,456 · +1.6%
- By 2040
- 746,689 · +3.8%
- By 2050
- 749,289 · +4.1%
- By 2075
- 736,227 · +2.3%
- By 2100
- 668,210 · -7.1%
Race, ethnicity, and origin ACS 2023
- Neighborhood character
- Predominantly White (77%)
- Race & ethnicity
- White 77% Black 12% Two or more races 7% Hispanic / Latino 5% Asian 2%
- Common ancestry
- Italian 5% Lithuanian 4% Romanian 2%
- Foreign-born
- 4% · Canada, Vietnam
- Languages at home
- 95% English-only · Spanish 2% Vietnamese 1% Other Asian/Pacific 1%
Political lean MEDSL · Jackson
- 2024 margin
- D (+19.3) · D 58.9% · R 39.5% · Other 1.6%
- 2008→2024 swing
- -6.1pp toward R · 2008: 25.4pp · 2024: 19.3pp
- All cycles
- 2024: D+19.3 2020: D+22.0 2016: D+16.6 2012: D+19.0 2008: D+25.4
Not yet ingested
- Civics
- —
Market trends
- HPI YoY
- ▼ -177.50%
- Current HPI
- 227.525
- Rent YoY
- ▲ 7.23%
- Metro
- Kansas City, MO-KS
- State GDP YoY
- ▲ 1.84%
- F500 in state
- 20
Industry mix (Fortune 500 HQ in MO)
| Industry | F500 HQs | Revenue |
|---|---|---|
| Healthcare | 1 | $163B |
|
||
| Insurance | 1 | $21B |
|
||
| Industrial Technology | 1 | $17B |
|
||
| Retail | 1 | $16B |
|
||
| Industrial Distribution | 1 | $10B |
|
||
| Utilities | 1 | $9B |
|
||
Price history
+74.1% since first listed14 events — show timeline
- 2026-06-12 Listed $200,000 Heartland MLS as Distributed by MLS Grid
- 2017-04-27 Sold (Public Records) — Public Records
- 2015-10-13 Listing Removed — Heartland MLS as Distributed by MLS Grid
- 2015-07-29 Listed $112,000 Heartland MLS as Distributed by MLS Grid
- 2014-06-11 Sold (Public Records) — Public Records
- 2014-06-11 Sold (Public Records) — Public Records
- 2014-06-09 Sold (MLS) — Heartland MLS as Distributed by MLS Grid
- 2014-04-30 Listed $115,000 Heartland MLS as Distributed by MLS Grid
- 2008-07-16 Sold (Public Records) — Public Records
- 2006-08-14 Sold (Public Records) — Public Records
- 2006-08-10 Sold (MLS) — Heartland MLS as Distributed by MLS Grid
- 2006-06-12 Listed $114,900 Heartland MLS as Distributed by MLS Grid
- 1997-08-28 Sold (Public Records) — Public Records
- 1990-09-09 Sold (Public Records) — Public Records
Property tax history
+2.6%/yrLatest (2025): $2,101 · -17.2% YoY. Source: county tax records.
Cash-flow waterfall
monthlySold comps — $/sqft
last 12 mo · ≤1 miLoading sold comps…