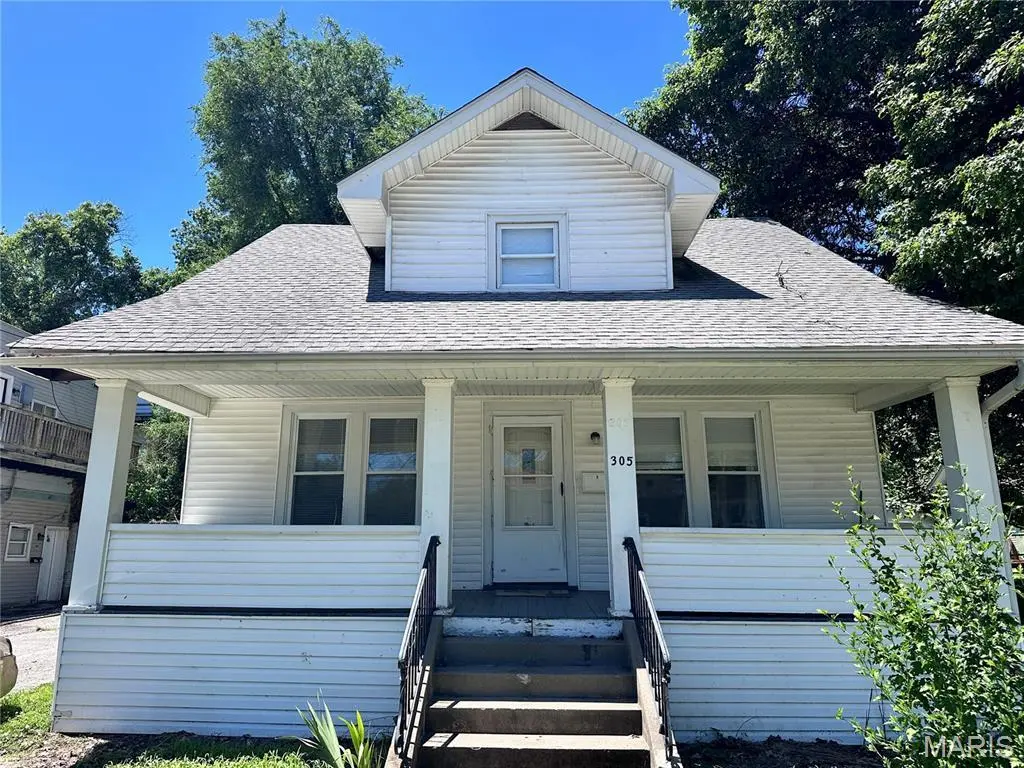
305 Grand Ave · Hannibal, MO
Flood risk 9/10 · Severe
- FEMA flood zone
- X (unshaded)
- Chance of flooding over 30 yrs
- 0.99%
- Est. flood insurance / yr
- $473 – $860
Fire risk 1/10 · Minimal
- Est. fire insurance / yr
- $1,054 – $1,958
Heat risk 4/10 · Minor
- Hot days now (above 106°F)
- 7 days/yr
- Hot days in 30 yrs
- 18 days/yr
Wind risk 2/10 · Minimal
- Chance of severe wind over 30 yrs
- —
Air-quality risk 2/10 · Minimal
- Unhealthy air days now
- 1 days/yr
- Unhealthy air days in 30 yrs
- 1 days/yr
Risk factors via First Street. Map © Google.
Why this score? — see what drove the D+ grade
The composite is a weighted blend of 9 inputs, each scored 0–100. Each bar is that input's sub-score; the figure is the points it added to the 100-point composite (weight × sub-score).
- Cash flow +16.8/30.0
- ARV discount +7.5/15.0
- DSCR +5.2/10.0
- Livability +3.7/5.0
- 1% rule +3.6/10.0
- Schools +3.4/10.0
- Rent growth +2.5/5.0
- Condition / age +2.5/5.0
- Appreciation +0.0/10.0
$125,000
🖨 Deal sheet 📄 Offer letter ✓ Due diligence
Listing remarks MLS
Welcome Home! Affordable met HGTV in this charming 1 1/2 story bungalow. Staged to showcase the best of old and new, with fresh paint and décor complimenting the hardwood flooring, classic woodwork, and comfortable character of this appealing home. The main level offers the living room, dining room, kitchen, full bath, and a den that would work well as a third bedroom. The kitchen has freshly painted cabinets, newer countertop and backsplash, newer flooring, and the appliances stay. The upstairs has two spacious bedrooms with newer luxury vinyl plank flooring, a full bath, and great built in storage. Additional improvements include updated main level bath, vinyl siding, replacement windows, and a newer (2018) roof. The level lot has a detached two car garage. Call today!
Key facts
- Private backyard
- Updated roof
- Spacious basement
Tags
Property features AI
Finance
- Other: Living area reported as 1,450 (source: assessor/public records); Lot dimensions approximately 54 x 96 (about 0.119 acres)
- HOA & community: No association fees
Exterior
- Parking: Detached 2-car garage (approximately 22 x 22)
- Utilities: Public water; Public sewer; 220V electric service; Cable connected; Electricity connected; Natural gas connected
- Home design: Single family residence; House with one and one-half levels; Private ownership
- Construction: Frame construction with vinyl siding
- Exterior features: Covered porch/patio; Storm doors; Level lot; Asphalt road frontage on a city street
Interior
- Kitchen: Range; Refrigerator; Pantry
- Bedrooms: 2 bedrooms (both on the upper level)
- Flooring: Hardwood
- Bathrooms: 2 full bathrooms (1 full bathroom on the main level, 1 full bathroom on the upper level)
- Heating & cooling: Natural gas forced air heating; Central electric air conditioning
- Interior features: Pantry; Open floor plan; Insulated windows; Window treatments
- Laundry & utility: Washer; Dryer; Gas water heater
Neighborhood map
What this means for you Summary
Snapshot
- This is a 2-bed/2.0-bath other listed at $125k.
Deal economics
- At list price, monthly cash flow is $24 ($283/yr) — positive.
- The deal already cash-flows at list — no discount required.
- To meet the 1% rule (rent ≥ 1% of price), the offer needs to be $108k (14.0% below list).
- Recommended offer: $108k (14.0% below list) — sets the bar for 1% rule.
- Cap rate 7.1% vs local median 3.4% in Hannibal — top-decile yield for the area; either an underpriced asset or a hidden risk that comps aren't pricing in. Stress-test before assuming the spread holds.
Location & tenants
- Location reads 73/100 on livability (#81 in MO) — a middle-class / working-renter tenant base. Strengths: cost of living A+, housing A+, health & safety A+; Watch: crime D, employment D, amenities F.
- Hannibal 60 (town): math 38% / reading 44% proficiency, ranked #142 of 324 in MO (top 44%) — families likely to look elsewhere, expect single-tenant / working-renter base with shorter leases.
- Zoned schools: Veterans Elem. (math 32% / reading 47%, grade F, #537 of 1,115 statewide, top 53%, 429 students, 60% FRL); Hannibal Sr. High (math 29% / reading 37%, grade F, #351 of 521 statewide, top 68%, 1,052 students, 49% FRL) — zoned schools at 54% FRL track the district average.
- Market conditions: 108 active listings in the ZIP; 38 units permitted in Marion County in 2024 (0 in 5+ unit buildings).
Forward outlook
- Local home prices are declining (-3.0%/yr); year-one equity from $864 of loan paydown is wiped out by about $4k of value loss. Plan a longer hold.
- Marion County population projected to shrink 8% by 2050 — rents likely to lag national; underwrite the cash flow, not the appreciation.
Negotiation context
- Only 1 days on market — expect competitive offers; lowballing is unlikely to land.
- 3 sale attempts since 7y ago with the ask held roughly flat each time — persistent listings suggest the price (not the market) is what's stuck; bring a comps-based counter.
Risks & watch-outs
- Watch-outs: flood insurance adds $56/mo; built in 1930 — expect roof / HVAC / electrical / plumbing capex.
- Climate carrying-cost: severe flood risk — expect insurance premiums to compound above CPI over the hold.
Questions for the listing agent
- Built in 1930 — when were the roof, HVAC, electrical panel, plumbing, and water heater last replaced?
- What's the actual annual flood-insurance premium (NFIP or private), and is the property in a SFHA with mandatory coverage?
- Is there a deadline driving the sale (1031 exchange, divorce, estate, relocation)? That informs how much negotiation room exists.
- Crime grade is D in this area — have there been break-ins, vandalism, or insurance claims at this property in the last 3 years? What carrier currently insures it and at what premium?
- The area grade is low — what's the realistic commute time and amenity access for the typical tenant pool here? Any planned neighborhood developments (good or bad) we should know about?
- What's the average days-on-market for RENTAL listings here right now (not sales)? A rising rental-DOM trend means longer vacancies and softer asking-rent achievability than the comps imply.
- What's the recent tenant-quality profile in this submarket — average credit score on applications, eviction rate, late-payment / NSF rate, and stable-employment percentage? A property-management company in the area should have these aggregated.
- How much new for-sale + rental construction is in the pipeline within 1–3 miles? Heavy new supply typically softens prices + rents 12–24 months out; constrained supply supports both.
Investment metrics
- 1% rule
- 0.86% ✗
- Cap rate
- 7.05%
- Cash-on-cash
- 2.71%
- DSCR
- 1.12
- GRM
- 9.7
CMA / ARV
No comps found within radius.
Projected returns pro-forma
-3.0% appreciation · 3.0% rent growth · sell at horizon
- IRR
- -15.0%
- Equity multiple
- 0.46×
- Total profit
- $-18,761
- Equity at exit
- $18,638
- IRR
- -6.4%
- Equity multiple
- 0.59×
- Total profit
- $-14,433
- Equity at exit
- $10,808
Cash invested: $35,000 (down + closing). Projections, not guarantees.
Landlord ↔ Tenant lean methodology
- Overall (STATE)
- 81 Strongly Landlord-Friendly
- State Missouri
- 81 Strongly Landlord-Friendly · R+10
- County
- — inherits STATE
- City
- — inherits STATE
ZIP-level market 63401
- Home prices YoY
- -32.9%
- Active inventory
- 108
- Price-to-rent
- 9.7×
Monthly cashflow live
- Estimated rent
- $1,075 medium interval (Pro) →
- Mortgage (P&I)
- −$656
- Tax from tax record
- −$63 /mo · $751/yr
- Insurance
- −$52
- Flood insurance flood zone
- −$56 /mo · $666/yr
- HOA
- −$0
- Vacancy / Maint / Mgmt
- −$226
- Net cashflow
- $24
Break-even live
UW: 25.0% down · 7.5% · 30yr · 1.5% tax · 5.0% vac · 8.0% maint · 8.0% mgmt
Financing live
Cash to close
- Down payment
- $31,250
- Closing costs
- $3,750
- Reserves months
- —
- Total cash needed
- —
Loan-product check · same deal, 3 products live
Conventional
25% down · 7.5% · 30yr
- Down + closing
- —
- Monthly P&I
- —
- Monthly cashflow
- —
- DSCR
- —
- Eligible?
- —
Personal DTI + credit; lowest rate.
DSCR
20% down · 8.5% · 30yr
- Down + closing
- —
- Monthly P&I
- —
- Monthly cashflow
- —
- DSCR
- —
- Eligible?
- —
No personal income docs; deal must DSCR.
Hard money
10% down · 12.0% · 12mo
- Down + closing
- —
- Monthly P&I
- —
- Monthly cashflow
- —
- DSCR
- —
- Eligible?
- —
Short-term bridge; refi at stabilization.
Listing history 2 events
-
2026-06-18remarks 699-char remark
-
2026-06-18$125,000 Active 1 DOM
ⓘ Source: listings_history table (triggers on properties + properties_extension) + one-shot
backfill from property_details.listing_events for pre-trigger history.
Tax reassessment forecast MO · Resets to sale price
- Current annual tax
- $751 · $63/mo
- Projected year-2 tax
- $1,212 · $101/mo
- Expected delta
- +$461/yr (+$38/mo · 61.4%)
ⓘ Screening estimate from a state-policy table — verify with the county assessor before closing.
Climate risk First Street
- Flood 9/10 Extreme FEMA zone X (unshaded) · 99% chance over 30 yrs
- Wildfire 1/10 Low
- Heat 4/10 Moderate 7 d/yr ≥106°F today · 18 d/yr by 30 yrs out
- Wind 2/10 Low
- Air quality 2/10 Low 1 unhealthy d/yr today · 1 by 30 yrs out
Nearby sold comps map
Loading sold comps map…
Walkable amenities ~0.75 mi
Loading nearby amenities…
Taxation est. · year 1
- Rental income
- $12,901
- − Mortgage interest
- −$7,002
- − Property taxes
- −$751
- − Insurance
- −$1,292
- − Repairs & maintenance
- −$1,032
- − Management
- −$1,032
- − Depreciation
- −$3,636
- Taxable loss
- −$1,844
- Est. tax savings @ 24.0%
- +$443
- After-tax cash flow
- $725/yr
For passive investors: Depreciation is non-cash, so a rental often shows a tax loss while cash-flowing — sheltering income. Rental losses are passive: they offset passive income freely, and up to $25,000/yr can offset ordinary (W-2) income if you actively participate and your MAGI is under $100k (phasing out to $0 by $150k); unused losses carry forward. On sale, claimed depreciation is recaptured at up to 25%, and gains may owe capital-gains tax (a 1031 exchange can defer both). Figures are a year-1 estimate at your 24.0% rate — not tax advice; consult a CPA.
Schools (NCES district)
- District
- Hannibal 60
- NCES district ID
- 2913650
- Math proficiency
- 38% ▼ -8.00%
- Reading proficiency
- 44% ▼ -5.00%
- Median HH income
- $40,349
- Composite
- 34.39/100
- National rank
- #5208
- State rank
- #142 of 324 in MO
Livability — Hannibal
- Score
- 73/100
- State rank
- #81
- US rank
- #5358
Category grades
Schools grade is shown separately in the Schools card above.
Census & demographics
- Census place
- Hannibal, MO
- Population (ZIP)
- 21,125
Population outlook (Marion County) Hauer SSP2
- Today (2025)
- 28,640 people
- By 2030
- 28,432 · -0.7%
- By 2040
- 27,597 · -3.6%
- By 2050
- 26,203 · -8.5%
- By 2075
- 21,931 · -23.4%
- By 2100
- 15,765 · -45.0%
Race, ethnicity, and origin ACS 2023
- Neighborhood character
- Predominantly White (88%)
- Race & ethnicity
- White 88% Black 6% Two or more races 4% Hispanic / Latino 3%
- Common ancestry
- Lithuanian 2% Romanian 1% Italian 1%
- Foreign-born
- 1% · Canada
Political lean MEDSL · Marion
- 2024 margin
- Solid R (+52.9) · D 23.1% · R 76.0%
- 2008→2024 swing
- -29.0pp toward R · 2008: -23.9pp · 2024: -52.9pp
- All cycles
- 2024: R+52.9 2020: R+50.3 2016: R+49.8 2012: R+32.0 2008: R+23.9
Not yet ingested
- Civics
- —
Market trends
- HPI YoY
- ▼ -93.01%
- Current HPI
- 189.6907
- Rent YoY
- —
- Metro
- —
- State GDP YoY
- ▲ 1.84%
- F500 in state
- 20
Industry mix (Fortune 500 HQ in MO)
| Industry | F500 HQs | Revenue |
|---|---|---|
| Healthcare | 1 | $163B |
|
||
| Insurance | 1 | $21B |
|
||
| Industrial Technology | 1 | $17B |
|
||
| Retail | 1 | $16B |
|
||
| Industrial Distribution | 1 | $10B |
|
||
| Utilities | 1 | $9B |
|
||
Price history
+70.1% since first listed9 events — show timeline
- 2026-06-17 Listed $125,000 MARIS as Distributed by MLS Grid
- 2019-07-22 Sold (Public Records) — Public Records
- 2019-07-19 Sold (MLS) — MARIS as Distributed by MLS Grid
- 2019-07-12 Pending — MARIS as Distributed by MLS Grid
- 2019-07-01 Contingent — MARIS as Distributed by MLS Grid
- 2019-06-21 Relisted — MARIS as Distributed by MLS Grid
- 2019-06-17 Contingent — MARIS as Distributed by MLS Grid
- 2019-06-14 Listed $73,500 MARIS as Distributed by MLS Grid
- 2017-08-17 Sold (Public Records) — Public Records
Property tax history
+2.8%/yrLatest (2025): $751 · +6.6% YoY. Source: county tax records.
Cash-flow waterfall
monthlySold comps — $/sqft
last 12 mo · ≤1 miLoading sold comps…