 Duplex
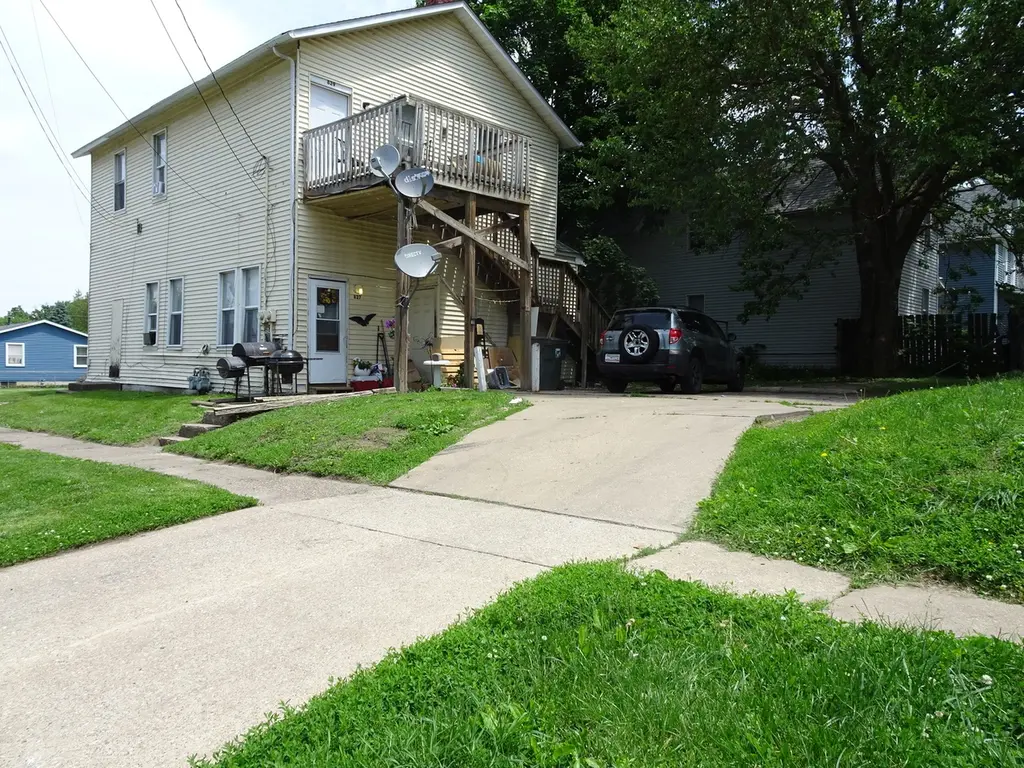
827-829 W 15th St · Davenport, IA
Flood risk 1/10 · Minimal
- FEMA flood zone
- X (unshaded)
- Chance of flooding over 30 yrs
- 0.0%
- Est. flood insurance / yr
- $473 – $860
Fire risk 1/10 · Minimal
- Est. fire insurance / yr
- $902 – $1,676
Heat risk 3/10 · Minor
- Hot days now (above 103°F)
- 7 days/yr
- Hot days in 30 yrs
- 16 days/yr
Wind risk 2/10 · Minimal
- Chance of severe wind over 30 yrs
- —
Air-quality risk 3/10 · Minor
- Unhealthy air days now
- 2 days/yr
- Unhealthy air days in 30 yrs
- 3 days/yr
Risk factors via First Street. Map © Google.
Why this score? — see what drove the B grade
The composite is a weighted blend of 9 inputs, each scored 0–100. Each bar is that input's sub-score; the figure is the points it added to the 100-point composite (weight × sub-score).
- Cash flow +30.0/30.0
- 1% rule +10.0/10.0
- DSCR +10.0/10.0
- ARV discount +7.5/15.0
- Livability +4.0/5.0
- Schools +3.9/10.0
- Rent growth +3.5/5.0
- Condition / age +2.5/5.0
- Appreciation +0.0/10.0
$89,900
🖨 Deal sheet (PDF) 📄 Offer letter ✓ Due diligence
Multi-family units
County records classify this as Multi-Family (2-4 Unit). Listing-text estimate: 2 units. confirmed
Listing remarks
Excellent investment opportunity in central Davenport! this up/down duplex features 2 2 bedroom units with recent leases at $825 a month. Seller would like to sell as a package with 1704 w 55th st, 1705 w 55th st and 1621 Gaines.
Key facts
- 3,484 sq ft lot
- 2 parking spots
- Built 1900
Neighborhood map
What this means for you Summary
Snapshot
- This is a 2 × 2-bed/1.0-bath units multifamily listed at $90k.
Deal economics
- At list price, monthly cash flow is $962 ($12k/yr) — positive. Per door: $481/mo.
- The deal already cash-flows at list — no discount required.
- Meets the 1% rule at list price ($2k rent vs $90k).
- Recommended offer: $89k (1.5% below list) — sets the bar for market timing.
- Cap rate 19.1% vs local median 4.4% in Davenport — top-decile yield for the area; either an underpriced asset or a hidden risk that comps aren't pricing in. Stress-test before assuming the spread holds.
Location & tenants
- Location reads 79/100 on livability (#126 in IA, #2,312 nationally) — a middle-class / working-renter tenant base. Strengths: cost of living A+, housing A+, health & safety A+; Watch: employment C-, crime F.
- Davenport Community School District (urban): math 43% / reading 50% proficiency, ranked #288 of 289 in IA (top 100%) — families likely to look elsewhere, expect single-tenant / working-renter base with shorter leases.
- Market conditions: Rents rising (+4.0%/yr); 161 active listings in the ZIP; 16 comparable units currently listed for rent nearby; rentals lingering (median 45d on market — plan ~5-8 weeks vacancy on turnover, expect pricing pressure); 50% of comp listings sitting > 30 days — soft ceiling on asking rent; 805 units permitted in Scott County in 2024 (479 in 5+ unit buildings).
- This rent runs 36% of the median local income ($66k/yr) — at the standard rent-burdened threshold; future hikes will face affordability resistance.
Forward outlook
- Local home prices are declining (-3.0%/yr); year-one equity from $622 of loan paydown is wiped out by about $3k of value loss. Plan a longer hold.
- Scott County population projected at +19% by 2050 — long-run rental-demand tailwind backs the buy-and-hold thesis.
- At projected returns (-3.0% appreciation + 4.0% rent growth), your $25k cash investment doubles in ~3 years — after that, you're playing with house money.
Negotiation context
- It's been on market 27 days — a 2% lower offer ($89k) is reasonable based on typical stale-listing flexibility.
- 4 sale attempts since 7y ago with the ask held roughly flat each time — persistent listings suggest the price (not the market) is what's stuck; bring a comps-based counter.
- Current owner paid $62k; 44% above their basis — modest negotiation headroom, anchor on the comps not their cost.
Risks & watch-outs
- Watch-outs: built in 1900 — expect roof / HVAC / electrical / plumbing capex.
Questions for the listing agent
- Can we see the unit-by-unit rent roll, current vacancy, and any below-market leases? What's the average tenancy length?
- What capital expenditures (roof, boiler, parking lot, exteriors) have been made in the last 5 years, and what's planned in the next 2?
- Built in 1900 — when were the roof, HVAC, electrical panel, plumbing, and water heater last replaced?
- Is there a deadline driving the sale (1031 exchange, divorce, estate, relocation)? That informs how much negotiation room exists.
- Crime grade is F in this area — have there been break-ins, vandalism, or insurance claims at this property in the last 3 years? What carrier currently insures it and at what premium?
- What's the average days-on-market for RENTAL listings here right now (not sales)? A rising rental-DOM trend means longer vacancies and softer asking-rent achievability than the comps imply.
- What's the recent tenant-quality profile in this submarket — average credit score on applications, eviction rate, late-payment / NSF rate, and stable-employment percentage? A property-management company in the area should have these aggregated.
- How much new apartment / multifamily construction is in the pipeline within 1–3 miles? Heavy new supply (>2% of stock underway) typically softens rents 12–24 months out; light construction supports rent growth.
Investment metrics
- 1% rule
- 2.21% ✓
- Cap rate
- 19.14%
- Cash-on-cash
- 45.87%
- DSCR
- 3.04
- GRM
- 3.8
CMA / ARV
No comps found within radius.
Projected returns pro-forma
-3.0% appreciation · 3.99% rent growth · sell at horizon
- IRR
- 44.2%
- Equity multiple
- 2.94×
- Total profit
- $48,735
- Equity at exit
- $13,404
- IRR
- 50.6%
- Equity multiple
- 6.16×
- Total profit
- $129,796
- Equity at exit
- $7,773
Cash invested: $25,172 (down + closing). Projections, not guarantees.
Landlord ↔ Tenant lean methodology
- Overall (STATE)
- 83 Strongly Landlord-Friendly
- State Iowa
- 83 Strongly Landlord-Friendly · R+6
- County
- — inherits STATE
- City
- — inherits STATE
ZIP-level market 52804
- Home prices YoY
- -25.3%
- Rents YoY
- 4.0%
- Active inventory
- 161
- Price-to-rent
- 7.5×
Monthly cashflow live
- Estimated rent
- $1,985 high interval (Pro) →
- Mortgage (P&I)
- −$471
- Tax from tax record
- −$97 /mo · $1,164/yr
- Insurance
- −$37
- HOA
- −$0
- Vacancy / Maint / Mgmt
- −$417
- Net cashflow
- $962
Break-even live
Sensitivity live
| Price | -10% $1,013 | -5% $988 | +0% $962 | +5% $937 | +10% $911 |
|---|---|---|---|---|---|
| Rent | -10% $805 | -5% $884 | +0% $962 | +5% $1,041 | +10% $1,119 |
| Rate | -1.0pp $1,008 | -0.5pp $985 | base $962 | +0.5pp $939 | +1.0pp $915 |
2-unit breakdown (identical units grouped — click to expand)
| Units | Beds | Baths | Est. rent |
|---|---|---|---|
| 2× units | 2 | 1 | $1,984 |
| #1 | 2 | 1 | $992 |
| #2 | 2 | 1 | $992 |
| Total (2 units) | $1,985 | ||
UW: 25.0% down · 7.5% · 30yr · 1.5% tax · 5.0% vac · 8.0% maint · 8.0% mgmt
Financing live
Cash to close
- Down payment
- $22,475
- Closing costs
- $2,697
- Reserves months
- —
- Total cash needed
- —
Loan-product check · same deal, 3 products live
Conventional
25% down · 7.5% · 30yr
- Down + closing
- —
- Monthly P&I
- —
- Monthly cashflow
- —
- DSCR
- —
- Eligible?
- —
Personal DTI + credit; lowest rate.
DSCR
20% down · 8.5% · 30yr
- Down + closing
- —
- Monthly P&I
- —
- Monthly cashflow
- —
- DSCR
- —
- Eligible?
- —
No personal income docs; deal must DSCR.
Hard money
10% down · 12.0% · 12mo
- Down + closing
- —
- Monthly P&I
- —
- Monthly cashflow
- —
- DSCR
- —
- Eligible?
- —
Short-term bridge; refi at stabilization.
Rent comps 16 comps
| Address | Beds | Baths | Sqft | Rent | $/sqft | DOM | Units | Dist |
|---|---|---|---|---|---|---|---|---|
| 915 W 14th St Davenport, IA | 3.0 | 1.0 | 1390 | $900 | $0.65 | 44d | 1 | 0.09mi |
| 1315 Brown St Unit 2 Davenport, IA | 3.0 | 1.0 | 1300 | $1,250 | $0.96 | 22d | 1 | 0.14mi |
| 621 W 15th St Davenport, IA | 4.0 | 2.0 | 1833 | $1,500 | $0.82 | 14d | 1 | 0.19mi |
| 1323 N Gaines St Davenport, IA | 4.0 | 2.0 | 1733 | $1,350 | $0.78 | 22d | 1 | 0.20mi |
| 537 W 16th St Davenport, IA | 3.0 | 1.0 | 1311 | $1,400 | $1.07 | 44d | 1 | 0.25mi |
| 1511 N Ripley St Davenport, IA | 4.0 | 2.0 | 1872 | $1,450 | $0.77 | 22d | 1 | 0.40mi |
| 1421 N Main St #2 Davenport, IA | 3.0 | 1.0 | 1350 | $1,095 | $0.81 | 44d | 1 | 0.56mi |
| 119 E 13th St Davenport, IA | 3.0 | 1.0 | 1728 | $1,495 | $0.87 | 44d | 1 | 0.68mi |
| 1723 W Locust St Davenport, IA | 3.0 | 1.0 | 1690 | $1,395 | $0.83 | 44d | 1 | 0.87mi |
| 1716 W 7th St Davenport, IA | 4.0 | 1.0 | 1278 | $1,712 | $1.34 | 14d | 1 | 0.93mi |
| 511 Pershing Ave Unit 106E Davenport, IA | 3.0 | 2.0 | 1349 | $1,996 | $1.48 | 44d | 1 | 1.05mi |
| 511 Pershing Ave Unit 301E Davenport, IA | 3.0 | 2.0 | 1429 | $2,126 | $1.49 | 44d | 1 | 1.05mi |
| 427 Pershing Ave Davenport, IA | 3.0 | 2.0 | 1438 | $2,288 | $1.59 | 14d | 3 | 1.08mi |
| 212 N Brady St Davenport, IA | 2.0–3.0 | 2.0–3.0 | 1428 | $2,600 | $1.82 | 14d | 4 | 1.09mi |
| 616 E 6th St Davenport, IA | 4.0 | 1.0 | 1578 | $1,712 | $1.08 | 44d | 1 | 1.21mi |
| 736 Federal St Davenport, IA | 1.0–3.0 | 1.0–2.0 | 1186 | $1,868 | $1.57 | 22d | 1 | 1.35mi |
Listing history 23 events
-
2026-06-18days on market $89,900 Active 27 DOM
-
2026-06-17days on market $89,900 Active 26 DOM
-
2026-06-16days on market $89,900 Active 25 DOM
-
2026-06-15days on market $89,900 Active 24 DOM
-
2026-06-14days on market $89,900 Active 22 DOM
-
2026-06-13days on market $89,900 Active 21 DOM
-
2026-06-10days on market $89,900 Active 19 DOM
-
2026-06-09days on market $89,900 Active 18 DOM
-
2026-06-08days on market $89,900 Active 17 DOM
-
2026-06-07days on market $89,900 Active 16 DOM
-
2026-06-03days on market $89,900 Active 12 DOM
-
2026-06-02days on market $89,900 Active 11 DOM
-
2026-06-01days on market $89,900 Active 10 DOM
-
2026-05-31days on market $89,900 Active 9 DOM
-
2026-05-30days on market $89,900 Active 8 DOM
-
2026-05-22$89,900 Active
-
2025-09-27historical $825
-
2025-09-25$825
-
2020-01-15soldstatus $62,500
-
2019-12-20soldstatus $62,500
-
2019-12-20soldstatus $62,500
-
2019-11-22$65,000
-
2019-11-22$65,000
ⓘ Source: listings_history table (triggers on properties + properties_extension) + one-shot
backfill from property_details.listing_events for pre-trigger history.
Tax reassessment forecast IA · Partial reset (capped growth)
- Current annual tax
- $1,164 · $97/mo
- Projected year-2 tax
- $1,288 · $107/mo
- Expected delta
- +$124/yr (+$10/mo · 10.6%)
ⓘ Screening estimate from a state-policy table — verify with the county assessor before closing.
Climate risk First Street
- Flood 1/10 Low FEMA zone X (unshaded) · 0% chance over 30 yrs
- Wildfire 1/10 Low
- Heat 3/10 Moderate 7 d/yr ≥103°F today · 16 d/yr by 30 yrs out
- Wind 2/10 Low
- Air quality 3/10 Moderate 2 unhealthy d/yr today · 3 by 30 yrs out
Nearby sold comps map
Loading sold comps map…
Walkable amenities ~0.75 mi
Loading nearby amenities…
Taxation est. · year 1
- Rental income
- $23,820
- − Mortgage interest
- −$5,036
- − Property taxes
- −$1,164
- − Insurance
- −$450
- − Repairs & maintenance
- −$1,906
- − Management
- −$1,906
- − Depreciation
- −$2,615
- Taxable income
- $10,744
- Est. tax owed @ 24.0%
- −$2,579
- After-tax cash flow
- $8,968/yr
For passive investors: Depreciation is non-cash, so a rental often shows a tax loss while cash-flowing — sheltering income. Rental losses are passive: they offset passive income freely, and up to $25,000/yr can offset ordinary (W-2) income if you actively participate and your MAGI is under $100k (phasing out to $0 by $150k); unused losses carry forward. On sale, claimed depreciation is recaptured at up to 25%, and gains may owe capital-gains tax (a 1031 exchange can defer both). Figures are a year-1 estimate at your 24.0% rate — not tax advice; consult a CPA.
Schools (NCES district)
- District
- Davenport Community School District
- NCES district ID
- 1908580
- Math proficiency
- 43% ▼ -11.00%
- Reading proficiency
- 50% ▼ -3.00%
- Median HH income
- $46,157
- Composite
- 39.49/100
- National rank
- #3951
- State rank
- #288 of 289 in IA
Livability — Davenport
- Score
- 79/100
- State rank
- #126
- US rank
- #2312
Category grades
Schools grade is shown separately in the Schools card above.
Census & demographics
- Census place
- Davenport, IA
- County
- Scott County · 144,583 people
- City population
- 103,319
- Metro
- Davenport-Moline-Rock Island, IA-IL
- Population (ZIP)
- 26,835
- Household income
- $65,849
- Rent vs Own
- Severe rent burden
- 830.0
Population outlook (Scott County) Hauer SSP2
- Today (2025)
- 188,878 people
- By 2030
- 196,648 · +4.1%
- By 2040
- 210,860 · +11.6%
- By 2050
- 224,359 · +18.8%
- By 2075
- 258,884 · +37.1%
- By 2100
- 286,447 · +51.7%
Race, ethnicity, and origin ACS 2023
- Neighborhood character
- Predominantly White (71%)
- Race & ethnicity
- White 71% Black 10% Hispanic / Latino 10% Two or more races 9% Asian 2%
- Hispanic origin (detail)
- Mexican 8%
- Common ancestry
- Iranian 2% Romanian 2% Portuguese 1%
- Foreign-born
- 4% · Canada, China, Vietnam
- Languages at home
- 94% English-only · Spanish 3% Russian/Polish/Slavic 1% Chinese 1%
Political lean MEDSL · Scott
- 2024 margin
- Toss-up / Even · D 47.3% · R 51.2% · Other 1.4%
- 2008→2024 swing
- -18.4pp toward R · 2008: 14.6pp · 2024: -3.9pp
- All cycles
- 2024: R+3.9 2020: D+3.5 2016: D+1.4 2012: D+13.8 2008: D+14.6
Not yet ingested
- Civics
- —
Market trends
- HPI YoY
- ▼ -66.50%
- Current HPI
- 196.2267
- Rent YoY
- ▲ 3.99%
- Metro
- Davenport-Moline-Rock Island, IA-IL
- State GDP YoY
- ▲ 2.48%
- F500 in state
- 4
Industry mix (Fortune 500 HQ in IA)
| Industry | F500 HQs | Revenue |
|---|---|---|
| Financial Services | 1 | $16B |
|
||
| Retail / Convenience | 1 | $15B |
|
||
Price history
+38.3% since first listed8 events — show timeline
- 2026-05-22 Listed $89,900 MRED as Distributed by MLS Grid
- 2025-09-27 Rental Removed $825 APPFOLIO
- 2025-09-25 Listed for Rent $825 APPFOLIO
- 2020-01-15 Sold (Public Records) $62,500 Public Records
- 2019-12-20 Sold (MLS) $62,500 MRED as Distributed by MLS Grid
- 2019-12-20 Sold (MLS) $62,500 RMLSA as Distributed by MLS Grid
- 2019-11-22 Listed $65,000 MRED as Distributed by MLS Grid
- 2019-11-22 Listed $65,000 RMLSA as Distributed by MLS Grid
Property tax history
+1.3%/yrLatest (2025): $1,164 · -11.7% YoY. Source: county tax records.
Cash-flow waterfall
monthlySold comps — $/sqft
last 12 mo · ≤1 miLoading sold comps…