96 Monterey Ln · Folsom, CA
Flood risk 1/10 · Minimal
- FEMA flood zone
- X (unshaded)
- Chance of flooding over 30 yrs
- 0.0%
- Est. flood insurance / yr
- $507 – $1,088
Fire risk 3/10 · Minor
- Est. fire insurance / yr
- $659 – $1,223
Heat risk 7/10 · Major
- Hot days now (above 103°F)
- 7 days/yr
- Hot days in 30 yrs
- 16 days/yr
Wind risk 1/10 · Minimal
- Chance of severe wind over 30 yrs
- —
Air-quality risk 10/10 · Severe
- Unhealthy air days now
- 30 days/yr
- Unhealthy air days in 30 yrs
- 38 days/yr
Risk factors via First Street. Map © Google.
Why this score? — see what drove the B- grade
The composite is a weighted blend of 9 inputs, each scored 0–100. Each bar is that input's sub-score; the figure is the points it added to the 100-point composite (weight × sub-score).
- Cash flow +30.0/30.0
- 1% rule +10.0/10.0
- DSCR +10.0/10.0
- ARV discount +7.5/15.0
- Livability +3.6/5.0
- Rent growth +2.9/5.0
- Condition / age +2.5/5.0
- Schools +2.4/10.0
- Appreciation +0.0/10.0
$120,000
🖨 Deal sheet (PDF) 📄 Offer letter ✓ Due diligence
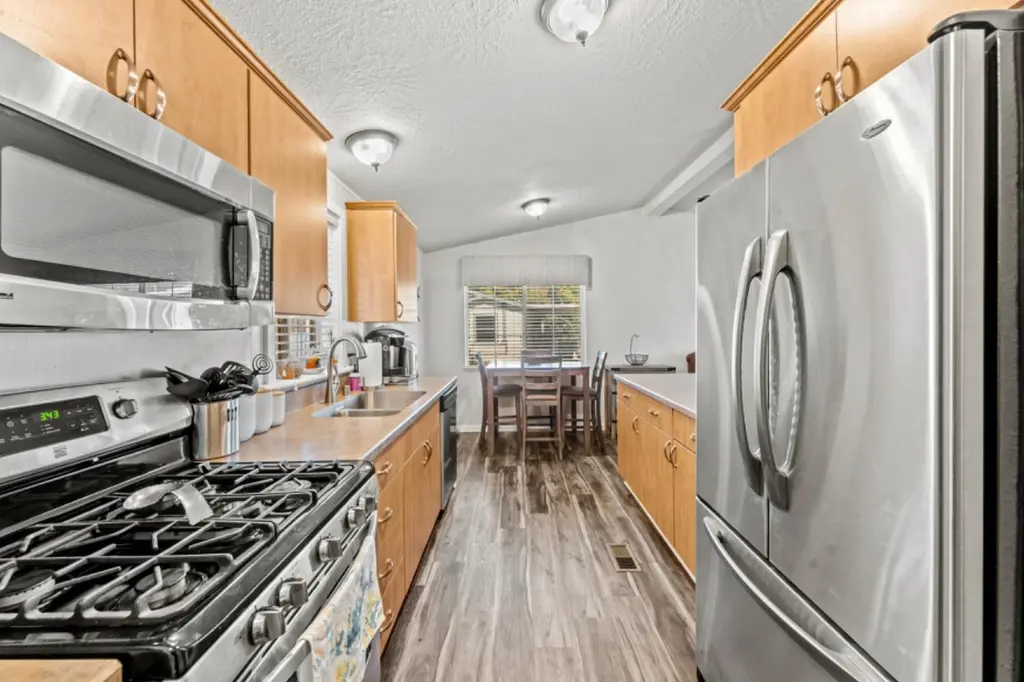
Listing remarks
Welcome to this beautifully upgraded home in the highly desirable 55+ senior community of Lake Park Estates. Perfectly situated near Folsom Lake, shopping, dining, and recreational trails, this property offers both convenience and a vibrant lifestyle. Step inside to find an immaculate interior that has been thoughtfully updated throughout. Enjoy peace of mind with a newer roof and tasteful finishes that make this home truly move-in ready. The light-filled living spaces flow seamlessly, creating a warm and inviting atmosphere. Outside, you'll appreciate the well-maintained grounds and access to fantastic community amenities, including a sparkling swimming poolperfect for staying active or so
Key facts
- Upgraded home
- Community amenities
- Near folsom lake
Tags
Neighborhood map
What this means for you Summary
Snapshot
- This is a 2-bed/1.0-bath manufactured listed at $120k.
Deal economics
- At list price, monthly cash flow is $889 ($11k/yr) — positive.
- The deal already cash-flows at list — no discount required.
- Meets the 1% rule at list price ($2k rent vs $120k).
- Recommended offer: $109k (9.0% below list) — sets the bar for market timing.
- Cap rate 15.2% vs local median 2.5% in Folsom — top-decile yield for the area; either an underpriced asset or a hidden risk that comps aren't pricing in. Stress-test before assuming the spread holds.
Location & tenants
- Location reads 72/100 on livability (#190 in CA) — a middle-class / working-renter tenant base. Strengths: employment A+, housing A+, schools A; Watch: amenities D, commute F, cost of living F.
- Folsom-Cordova Unified (urban): math 25% / reading 25% proficiency, ranked #365 of 517 in CA (top 71%) — low school quality limits family demand, transient renter base, plan for 1-2y turnover.
- Market conditions: Rents rising (+1.7%/yr); 422 active listings in the ZIP; 6 comparable units currently listed for rent nearby; rentals leasing fast (median 3d on market — plan ~1-2 weeks tenant-placement turnaround); high-income renter base; 6,825 units permitted in Sacramento County in 2024 (1,752 in 5+ unit buildings).
Forward outlook
- Local home prices are declining (-3.0%/yr); year-one equity from $830 of loan paydown is wiped out by about $4k of value loss. Plan a longer hold.
- Sacramento County population projected at +17% by 2050 — long-run rental-demand tailwind backs the buy-and-hold thesis.
- At projected returns (-3.0% appreciation + 1.7% rent growth), your $34k cash investment doubles in ~4 years — after that, you're playing with house money.
Negotiation context
- It's been on market 105 days — a 9% lower offer ($109k) is reasonable based on typical stale-listing flexibility.
Risks & watch-outs
- Climate carrying-cost: extreme-heat days projected 7→16/yr by 2055 (HVAC capex compounding) — expect insurance premiums to compound above CPI over the hold.
Questions for the listing agent
- It's been on market 105 days. Have you received any prior offers? Is the seller open to a 9% concession, seller financing, or rate buy-down credit?
- Why hasn't it sold? Are there any deal-killer items the seller is aware of (foundation, flood, title, zoning, code violations)?
- Is there a deadline driving the sale (1031 exchange, divorce, estate, relocation)? That informs how much negotiation room exists.
- Schools are A-rated — typically a magnet for longer-tenancy family renters. What's the average tenant stay here, and is there a school-zone premium baked into asking?
- What's the average days-on-market for RENTAL listings here right now (not sales)? A rising rental-DOM trend means longer vacancies and softer asking-rent achievability than the comps imply.
- What's the recent tenant-quality profile in this submarket — average credit score on applications, eviction rate, late-payment / NSF rate, and stable-employment percentage? A property-management company in the area should have these aggregated.
- How much new for-sale + rental construction is in the pipeline within 1–3 miles? Heavy new supply typically softens prices + rents 12–24 months out; constrained supply supports both.
Investment metrics
- 1% rule
- 1.81% ✓
- Cap rate
- 15.18%
- Cash-on-cash
- 31.74%
- DSCR
- 2.41
- GRM
- 4.6
CMA / ARV
- ARV (median comp)
- $72,931
- List price
- $120,000
- Delta
- 64.54%
- Verdict
- OVERPRICED
- Comps
- 8 within 1.0 mi
Show comp detail 10 sales within ~0.75 mi
| Address | Dist | Beds/Ba | Sqft | Sold | Price | $/sf | Match |
|---|---|---|---|---|---|---|---|
| 3 Shady Oaks Dr | 0.06mi | 2/1.0 | 800 (0%) | 12mo | $69,000 | $86 | 87 |
| 208 Bluebird Ln | 0.14mi | 2/1.0 | 780 (-2%) | 15mo | $136,500 | $175 | 77 |
| 60 Birch Ln | 0.11mi | 1/0.5 (-1) | 852 (+6%) | 3mo | $47,500 | $56 | 75 |
| 40 Shady Oaks Dr | 0.14mi | 2/1.0 | 832 (+4%) | 21mo | $139,800 | $168 | 69 |
| 36 Shady Oaks Dr | 0.12mi | 2/1.0 | 736 (-8%) | 17mo | $117,000 | $159 | 67 |
| 248 Lark Ln #248 | 0.16mi | 2/1.0 | 720 (-10%) | 23mo | $74,000 | $103 | 57 |
| 210 Danielle Way #2 | 0.32mi | 2/1.0 | 684 (-14%) | 6mo | $90,000 | $132 | 56 |
| 302 Raymond Ln #102 | 0.40mi | 2/2.0 | 848 (+6%) | 17mo | $75,000 | $88 | 53 |
| 20 Shady Oaks Dr | 0.11mi | 1/1.0 (-1) | 700 (-12%) | 20mo | $82,000 | $117 | 53 |
| 166 Pinebrook | 0.75mi | 2/1.5 | 720 (-10%) | 14mo | $139,000 | $193 | 35 |
Match score weights: distance 35% · size 25% · config 20% · recency 20%. Top-matched comps best support the ARV.
Projected returns pro-forma
-3.0% appreciation · 1.72% rent growth · sell at horizon
- IRR
- 25.2%
- Equity multiple
- 2.02×
- Total profit
- $34,433
- Equity at exit
- $17,892
- IRR
- 32.2%
- Equity multiple
- 3.74×
- Total profit
- $91,953
- Equity at exit
- $10,375
Cash invested: $33,600 (down + closing). Projections, not guarantees.
Landlord ↔ Tenant lean methodology
- Overall (STATE)
- 18 Strongly Tenant-Friendly
- State California
- 18 Strongly Tenant-Friendly · D+13
- County
- — inherits STATE
- City
- — inherits STATE
ZIP-level market 95630
- Rents YoY
- 1.7%
- Active inventory
- 422
- Price-to-rent
- 4.6×
Monthly cashflow live
- Estimated rent
- $2,175 high interval (Pro) →
- Mortgage (P&I)
- −$629
- Tax est. 1.5%
- −$150 /mo · $1,800/yr
- Insurance
- −$50
- HOA
- −$0
- Vacancy / Maint / Mgmt
- −$457
- Net cashflow
- $889
Break-even live
Sensitivity live
| Price | -10% $972 | -5% $930 | +0% $889 | +5% $847 | +10% $806 |
|---|---|---|---|---|---|
| Rent | -10% $717 | -5% $803 | +0% $889 | +5% $975 | +10% $1,061 |
| Rate | -1.0pp $949 | -0.5pp $919 | base $889 | +0.5pp $858 | +1.0pp $826 |
UW: 25.0% down · 7.5% · 30yr · 1.5% tax · 5.0% vac · 8.0% maint · 8.0% mgmt
Financing live
Cash to close
- Down payment
- $30,000
- Closing costs
- $3,600
- Reserves months
- —
- Total cash needed
- —
Loan-product check · same deal, 3 products live
Conventional
25% down · 7.5% · 30yr
- Down + closing
- —
- Monthly P&I
- —
- Monthly cashflow
- —
- DSCR
- —
- Eligible?
- —
Personal DTI + credit; lowest rate.
DSCR
20% down · 8.5% · 30yr
- Down + closing
- —
- Monthly P&I
- —
- Monthly cashflow
- —
- DSCR
- —
- Eligible?
- —
No personal income docs; deal must DSCR.
Hard money
10% down · 12.0% · 12mo
- Down + closing
- —
- Monthly P&I
- —
- Monthly cashflow
- —
- DSCR
- —
- Eligible?
- —
Short-term bridge; refi at stabilization.
Rent comps 6 comps
| Address | Beds | Baths | Sqft | Rent | $/sqft | DOM | Units | Dist |
|---|---|---|---|---|---|---|---|---|
| 7550 Folsom Auburn Rd Folsom, CA | 1.0 | 1.0 | 674 | $1,990 | $2.95 | 3d | 3 | 0.24mi |
| 1600 Canyon Terrace Ln Folsom, CA | 1.0–3.0 | 1.0–2.0 | 955 | $2,348 | $2.46 | 2d | 18 | 1.14mi |
| 1000 Folsom Ranch Dr Folsom, CA | 1.0–2.0 | 1.0–2.0 | 830 | $2,399 | $2.89 | 2d | 18 | 1.17mi |
| 308 Figueroa St Folsom, CA | 1.0 | 1.0 | 549 | $1,600 | $2.91 | 24d | 1 | 1.45mi |
| 113 Mormon St Unit B Folsom, CA | 2.0 | 1.0 | 728 | $2,095 | $2.88 | 2d | 1 | 1.46mi |
| 106 Natoma St Folsom, CA | 1.0 | 1.0 | 550 | $1,425 | $2.59 | 17d | 1 | 1.48mi |
Listing history 14 events
-
2026-06-18days on market $120,000 Active 105 DOM
-
2026-06-17days on market $120,000 Active 104 DOM
-
2026-06-16days on market $120,000 Active 103 DOM
-
2026-06-15days on market $120,000 Active 102 DOM
-
2026-06-13days on market $120,000 Active 100 DOM
-
2026-06-13days on market $120,000 Active 99 DOM
-
2026-06-09pricedays on market $120,000 Active 96 DOM
-
2026-06-08days on market $135,000 Active 95 DOM
-
2026-06-07days on market $135,000 Active 94 DOM
-
2026-06-05days on market $135,000 Active 91 DOM
-
2026-06-03days on market $135,000 Active 90 DOM
-
2026-06-02days on market $135,000 Active 89 DOM
-
2026-06-01days on market $135,000 Active 88 DOM
-
2026-05-31days on market $135,000 Active 87 DOM
ⓘ Source: listings_history table (triggers on properties + properties_extension) + one-shot
backfill from property_details.listing_events for pre-trigger history.
Climate risk First Street
- Flood 1/10 Low FEMA zone X (unshaded) · 0% chance over 30 yrs
- Wildfire 3/10 Moderate
- Heat 7/10 Severe 7 d/yr ≥103°F today · 16 d/yr by 30 yrs out
- Wind 1/10 Low
- Air quality 10/10 Extreme 30 unhealthy d/yr today · 38 by 30 yrs out
Nearby sold comps map
Loading sold comps map…
Walkable amenities ~0.75 mi
Loading nearby amenities…
Taxation est. · year 1
- Rental income
- $26,098
- − Mortgage interest
- −$6,722
- − Property taxes
- −$1,800
- − Insurance
- −$600
- − Repairs & maintenance
- −$2,088
- − Management
- −$2,088
- − Depreciation
- −$3,491
- Taxable income
- $9,310
- Est. tax owed @ 24.0%
- −$2,234
- After-tax cash flow
- $8,432/yr
For passive investors: Depreciation is non-cash, so a rental often shows a tax loss while cash-flowing — sheltering income. Rental losses are passive: they offset passive income freely, and up to $25,000/yr can offset ordinary (W-2) income if you actively participate and your MAGI is under $100k (phasing out to $0 by $150k); unused losses carry forward. On sale, claimed depreciation is recaptured at up to 25%, and gains may owe capital-gains tax (a 1031 exchange can defer both). Figures are a year-1 estimate at your 24.0% rate — not tax advice; consult a CPA.
Schools (NCES district)
- District
- Folsom-Cordova Unified
- NCES district ID
- 0613890
- Math proficiency
- 25% ▼ -27.00%
- Reading proficiency
- 25% ▼ -38.00%
- Median HH income
- $75,408
- Composite
- 24.49/100
- National rank
- #7656
- State rank
- #365 of 517 in CA
Livability — Folsom
- Score
- 72/100
- State rank
- #190
- US rank
- #6125
Category grades
Schools grade is shown separately in the Schools card above.
Census & demographics
- Census place
- Folsom, CA
- County
- Sacramento County · 1,539,646 people
- City population
- 79,484
- Metro
- Sacramento-Roseville-Folsom, CA
- Population (ZIP)
- 79,484
- Household income
- $139,642
- Rent vs Own
- Severe rent burden
- 1651.0
Population outlook (Sacramento County) Hauer SSP2
- Today (2025)
- 1,660,763 people
- By 2030
- 1,732,990 · +4.3%
- By 2040
- 1,855,755 · +11.7%
- By 2050
- 1,941,335 · +16.9%
- By 2075
- 2,046,162 · +23.2%
- By 2100
- 1,961,444 · +18.1%
Race, ethnicity, and origin ACS 2023
- Neighborhood character
- Diverse neighborhood (Simpson 0.61)
- Race & ethnicity
- White 58% Asian 20% Hispanic / Latino 13% Two or more races 11% Black 3%
- Hispanic origin (detail)
- Mexican 9% Puerto Rican 1%
- Common ancestry
- Italian 4% Slovak 2% Portuguese 2%
- Foreign-born
- 20% · Canada, China, Vietnam
- Languages at home
- 75% English-only · Other Indo-European 7% Spanish 5% Other Asian/Pacific 5%
Political lean MEDSL · Sacramento
- 2024 margin
- D (+19.7) · D 58.1% · R 38.4% · Other 3.5%
- 2008→2024 swing
- +0.7pp no change · 2008: 19.0pp · 2024: 19.7pp
- All cycles
- 2024: D+19.7 2020: D+25.3 2016: D+23.7 2012: D+16.3 2008: D+19.0
Not yet ingested
- Civics
- —
Market trends
- HPI YoY
- ▼ -240.39%
- Current HPI
- 286.0579
- Rent YoY
- ▲ 1.72%
- Metro
- Sacramento-Roseville-Folsom, CA
- State GDP YoY
- ▲ 3.21%
- F500 in state
- 116
Industry mix (Fortune 500 HQ in CA)
| Industry | F500 HQs | Revenue |
|---|---|---|
| Technology | 27 | $1,492B |
|
||
| Financial Services | 3 | $174B |
|
||
| Retail | 3 | $44B |
|
||
| Insurance | 3 | $26B |
|
||
| Media / Entertainment | 2 | $115B |
|
||
| Pharmaceuticals / Biotech | 2 | $62B |
|
||
Property tax history
-1.7%/yrLatest (2025): $103 · -1.6% YoY. Source: county tax records.
Cash-flow waterfall
monthlySold comps — $/sqft
last 12 mo · ≤1 miLoading sold comps…