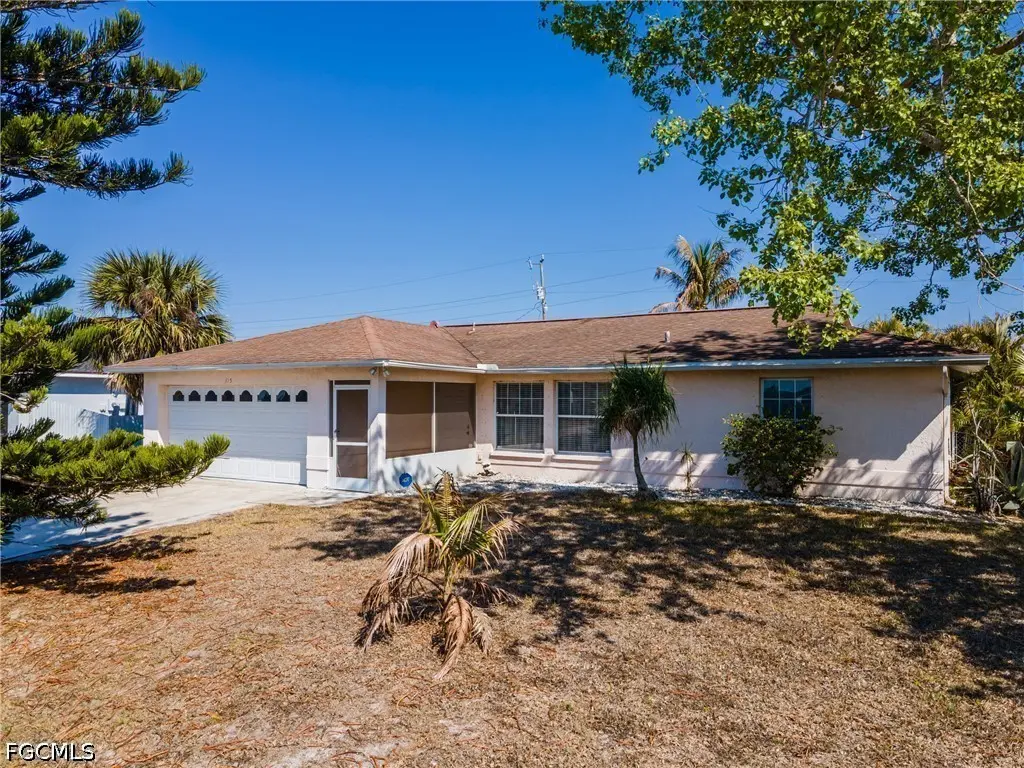
315 NW 7th Ter · Cape Coral, FL
Flood risk 3/10 · Minor
- FEMA flood zone
- X (unshaded)
- Chance of flooding over 30 yrs
- 0.12%
- Est. flood insurance / yr
- $507 – $1,088
Fire risk 1/10 · Minimal
- Est. fire insurance / yr
- $947 – $1,759
Heat risk 10/10 · Severe
- Hot days now (above 107°F)
- 7 days/yr
- Hot days in 30 yrs
- 29 days/yr
Wind risk 10/10 · Severe
- Chance of severe wind over 30 yrs
- 99.0%
Air-quality risk 2/10 · Minimal
- Unhealthy air days now
- 1 days/yr
- Unhealthy air days in 30 yrs
- 1 days/yr
Risk factors via First Street. Map © Google.
Why this score? — see what drove the D- grade
The composite is a weighted blend of 9 inputs, each scored 0–100. Each bar is that input's sub-score; the figure is the points it added to the 100-point composite (weight × sub-score).
- Cash flow +14.3/30.0
- ARV discount +6.3/15.0
- DSCR +4.4/10.0
- Schools +4.1/10.0
- Livability +3.9/5.0
- 1% rule +3.2/10.0
- Condition / age +2.5/5.0
- Rent growth +1.1/5.0
- Appreciation +0.0/10.0
$250,000
🖨 Deal sheet 📄 Offer letter ✓ Due diligence
Listing remarks
A rare find in NW Cape Coral, this 3-bedroom, 2-bath home with a 2-car garage sits on nearly half an acre, offering space and flexibility that’s becoming harder to find. Connected to city water and sewer with assessments paid in full, this property removes a major expense and adds long-term value. Recent updates include a hot water heater replaced in 2024, HVAC serviced in 2025 with new parts, and newer kitchen appliances already in place. The large lanai extends your living space outdoors, while the partially fenced yard provides both function and safety for kids and pets. What truly sets this property apart is the lot. At . 49 acres, there is potential to separate the rear portion,
Key facts
- 0.49 acre lot
- 2 garage spots
- Built 1989
Neighborhood map
What this means for you Summary
Snapshot
- This is a 3-bed/2.0-bath single-family listed at $250k.
Deal economics
- At list price, monthly cash flow is $46 ($552/yr) — positive.
- The deal already cash-flows at list — no discount required.
- To meet the 1% rule (rent ≥ 1% of price), the offer needs to be $205k (18.0% below list).
- Recommended offer: $205k (18.0% below list) — sets the bar for 1% rule.
- Cap rate 6.5% vs local median 3.1% in Cape Coral — top-decile yield for the area; either an underpriced asset or a hidden risk that comps aren't pricing in. Stress-test before assuming the spread holds.
Location & tenants
- Location reads 77/100 on livability (#208 in FL, #3,098 nationally) — a middle-class / working-renter tenant base. Strengths: housing A+, health & safety A+, amenities B+; Watch: commute F.
- Lee (suburban): math 47% / reading 50% proficiency, ranked #42 of 73 in FL (top 58%) — families likely to look elsewhere, expect single-tenant / working-renter base with shorter leases.
- Market conditions: Rents falling (-5.5%/yr); 2652 active listings in the ZIP; 26 comparable units currently listed for rent nearby; rentals at typical pace (median 16d on market — plan ~3-4 weeks tenant-placement turnaround); solid renter incomes; 15,411 units permitted in Lee County in 2024 (4,686 in 5+ unit buildings).
Forward outlook
- Local home prices are declining (-3.0%/yr); year-one equity from $2k of loan paydown is wiped out by about $8k of value loss. Plan a longer hold.
- Lee County population projected at +44% by 2050 — long-run rental-demand tailwind backs the buy-and-hold thesis.
Negotiation context
- It's been on market 16 days — a 2% lower offer ($246k) is reasonable based on typical stale-listing flexibility.
- 2 sale attempts with the ask held roughly flat each time — persistent listings suggest the price (not the market) is what's stuck; bring a comps-based counter.
- Current owner paid $72k; list at $250k implies a 250% gain — meaningful room to come down on a strong offer.
Risks & watch-outs
- Climate carrying-cost: severe wind risk, 99% chance of damaging wind over 30y; extreme-heat days projected 7→29/yr by 2055 (HVAC capex compounding) — expect insurance premiums to compound above CPI over the hold.
Questions for the listing agent
- Is there a deadline driving the sale (1031 exchange, divorce, estate, relocation)? That informs how much negotiation room exists.
- Schools are B-rated — typically a magnet for longer-tenancy family renters. What's the average tenant stay here, and is there a school-zone premium baked into asking?
- The area grade is low — what's the realistic commute time and amenity access for the typical tenant pool here? Any planned neighborhood developments (good or bad) we should know about?
- What's the average days-on-market for RENTAL listings here right now (not sales)? A rising rental-DOM trend means longer vacancies and softer asking-rent achievability than the comps imply.
- What's the recent tenant-quality profile in this submarket — average credit score on applications, eviction rate, late-payment / NSF rate, and stable-employment percentage? A property-management company in the area should have these aggregated.
- How much new for-sale + rental construction is in the pipeline within 1–3 miles? Heavy new supply typically softens prices + rents 12–24 months out; constrained supply supports both.
Investment metrics
- 1% rule
- 0.82% ✗
- Cap rate
- 6.51%
- Cash-on-cash
- 0.79%
- DSCR
- 1.04
- GRM
- 10.2
CMA / ARV
- ARV (on-the-fly)
- $243,288
- Comps found
- 12
Show comp detail 12 sales within ~0.75 mi
| Address | Dist | Beds/Ba | Sqft | Sold | Price | $/sf | Match |
|---|---|---|---|---|---|---|---|
| 400 NW 8th Ter | 0.10mi | 3/2.0 | 1,078 (-3%) | 17mo | $260,000 | $241 | 76 |
| 320 NW 10th St | 0.29mi | 3/2.0 | 1,087 (-3%) | 14mo | $229,900 | $211 | 71 |
| 504 NW 3rd Ln | 0.55mi | 3/2.0 | 1,144 (+2%) | 1mo | $295,000 | $258 | 70 |
| 1007 NW 6th Ave | 0.42mi | 3/2.0 | 1,141 (+2%) | 10mo | $229,000 | $201 | 69 |
| 123 NW 9th St | 0.35mi | 3/2.0 | 1,231 (+10%) | 2mo | $231,000 | $188 | 65 |
| 212 NW 11th St | 0.46mi | 3/2.0 | 1,123 (+1%) | 19mo | $285,000 | $254 | 62 |
| 401 NW Juanita Ct | 0.62mi | 3/2.0 | 1,096 (-2%) | 14mo | $262,000 | $239 | 57 |
| 216 NW 11th St | 0.45mi | 3/2.0 | 1,274 (+14%) | 1mo | $245,000 | $192 | 54 |
| 319 NW 4th St | 0.43mi | 3/2.0 | 1,204 (+8%) | 15mo | $350,000 | $291 | 54 |
| 114 NW 7th St | 0.33mi | 3/2.0 | 1,264 (+13%) | 12mo | $270,000 | $214 | 53 |
| 1023 NW 1st Ave | 0.57mi | 2/2.0 (-1) | 1,129 (+1%) | 20mo | $229,900 | $204 | 50 |
| 204 NW 5th St | 0.41mi | 3/2.0 | 1,241 (+11%) | 22mo | $270,000 | $218 | 44 |
Match score weights: distance 35% · size 25% · config 20% · recency 20%. Top-matched comps best support the ARV.
Projected returns pro-forma
-3.0% appreciation · 0.0% rent growth · sell at horizon
- IRR
- -18.2%
- Equity multiple
- 0.38×
- Total profit
- $-43,652
- Equity at exit
- $37,276
- IRR
- -17.1%
- Equity multiple
- 0.18×
- Total profit
- $-57,715
- Equity at exit
- $21,615
Cash invested: $70,000 (down + closing). Projections, not guarantees.
Landlord ↔ Tenant lean methodology
- Overall (STATE)
- 87 Strongly Landlord-Friendly
- State Florida
- 87 Strongly Landlord-Friendly · R+3
- County
- — inherits STATE
- City
- — inherits STATE
ZIP-level market 33993
- Home prices YoY
- -14.1%
- Rents YoY
- -5.5%
- Active inventory
- 2652
- Price-to-rent
- 10.2×
Monthly cashflow live
- Estimated rent
- $2,050 high interval (Pro) →
- Mortgage (P&I)
- −$1,311
- Tax from tax record
- −$158 /mo · $1,898/yr
- Insurance
- −$104
- HOA
- −$0
- Vacancy / Maint / Mgmt
- −$430
- Net cashflow
- $46
Break-even live
UW: 25.0% down · 7.5% · 30yr · 1.5% tax · 5.0% vac · 8.0% maint · 8.0% mgmt
Financing live
Cash to close
- Down payment
- $62,500
- Closing costs
- $7,500
- Reserves months
- —
- Total cash needed
- —
Loan-product check · same deal, 3 products live
Conventional
25% down · 7.5% · 30yr
- Down + closing
- —
- Monthly P&I
- —
- Monthly cashflow
- —
- DSCR
- —
- Eligible?
- —
Personal DTI + credit; lowest rate.
DSCR
20% down · 8.5% · 30yr
- Down + closing
- —
- Monthly P&I
- —
- Monthly cashflow
- —
- DSCR
- —
- Eligible?
- —
No personal income docs; deal must DSCR.
Hard money
10% down · 12.0% · 12mo
- Down + closing
- —
- Monthly P&I
- —
- Monthly cashflow
- —
- DSCR
- —
- Eligible?
- —
Short-term bridge; refi at stabilization.
Rent comps 26 comps
| Address | Beds | Baths | Sqft | Rent | $/sqft | DOM | Units | Dist |
|---|---|---|---|---|---|---|---|---|
| 318 NW 8th Ter Cape Coral, FL | 3.0 | 2.0 | 1500 | $1,900 | $1.27 | 2d | 1 | 0.12mi |
| 419 NW 7th Ter Cape Coral, FL | 3.0 | 2.0 | 1161 | $4,500 | $3.88 | 3d | 1 | 0.12mi |
| 639 NE Juanita Pl Cape Coral, FL | 3.0 | 2.0 | 1116 | $1,700 | $1.52 | 19d | 1 | 0.52mi |
| 1143 NW 4th Pl Cape Coral, FL | 3.0 | 2.0 | 1399 | $1,750 | $1.25 | 3d | 1 | 0.61mi |
| 1113 NW 1st Ave Cape Coral, FL | 3.0 | 2.0 | 1286 | $1,626 | $1.26 | 3d | 1 | 0.63mi |
| 1140 NW 1st Ave Cape Coral, FL | 3.0 | 2.0 | 1452 | $1,850 | $1.27 | 23d | 1 | 0.70mi |
| 1140 NW 1st Ave Cape Coral, FL | 3.0 | 2.0 | 1452 | $1,850 | $1.27 | 14d | 1 | 0.70mi |
| 186 Tierra De Paz Loop Cape Coral, FL | 1.0–3.0 | 1.0–2.0 | 935 | $2,496 | $2.67 | 1d | 153 | 0.73mi |
| 1156 NW 5th Pl Cape Coral, FL | 3.0 | 2.0 | 1458 | $1,695 | $1.16 | 19d | 1 | 0.74mi |
| 411 NW 13th St Cape Coral, FL | 3.0 | 2.0 | 1408 | $2,035 | $1.45 | 3d | 1 | 0.76mi |
| 626 NW 2nd Ln Cape Coral, FL | 3.0 | 2.0 | 1272 | $2,200 | $1.73 | 23d | 1 | 0.77mi |
| 626 NW 2nd Ln Cape Coral, FL | 3.0 | 2.0 | 1272 | $2,200 | $1.73 | 15d | 1 | 0.77mi |
| 212 NW 1st St Cape Coral, FL | 3.0 | 2.0 | 1246 | $1,775 | $1.42 | 3d | 1 | 0.80mi |
| 1109 NE 2nd Pl Cape Coral, FL | 3.0 | 2.0 | 1272 | $1,900 | $1.49 | 23d | 1 | 0.95mi |
| 315 SW Pine Island Rd Cape Coral, FL | 1.0–2.0 | 1.0–2.0 | 974 | $1,699 | $1.74 | 3d | 10 | 1.04mi |
| 1406 NW 8th Pl Cape Coral, FL | 3.0 | 2.0 | 1403 | $1,855 | $1.32 | 23d | 1 | 1.09mi |
| 306 NE 14th Ter Cape Coral, FL | 3.0 | 2.0 | 1410 | $1,595 | $1.13 | 10d | 1 | 1.27mi |
| 229 Hancock Bridge Pkwy Cape Coral, FL | 2.0 | 2.0 | 1100 | $1,400 | $1.27 | 23d | 1 | 1.27mi |
| 149 Santa Barbara Blvd S Cape Coral, FL | 3.0 | 2.0 | 1250 | $1,520 | $1.22 | 23d | 1 | 1.27mi |
| 159 SE Santa Barbara Pl Cape Coral, FL | 3.0 | 2.0 | 1412 | $2,250 | $1.59 | 23d | 1 | 1.30mi |
| 1206 NE 5th Pl Cape Coral, FL | 3.0 | 2.0 | 1176 | $1,805 | $1.53 | 23d | 1 | 1.35mi |
| 1001 NE 6th Ave Cape Coral, FL | 3.0 | 2.0 | 1416 | $4,410 | $3.11 | 23d | 1 | 1.36mi |
| 114 NW 13th Ave Cape Coral, FL | 3.0 | 2.0 | 1422 | $2,000 | $1.41 | 14d | 1 | 1.39mi |
| 701 SW Pine Island Rd Cape Coral, FL | 1.0–3.0 | 1.0–2.0 | 1138 | $1,794 | $1.58 | 1d | 11 | 1.43mi |
| 916 NW 15th Ave Cape Coral, FL | 3.0 | 2.0 | 1458 | $1,890 | $1.30 | 3d | 1 | 1.47mi |
| 741 NE 7th Pl Cape Coral, FL | 2.0 | 1.0 | 856 | $1,495 | $1.75 | 23d | 1 | 1.49mi |
Listing history 7 events
-
2026-04-25status Pending
-
2026-04-16status Active
-
2026-04-08status Pending
-
2026-04-01$250,000 Active
-
2001-07-13soldstatus $71,500
-
2001-07-05soldstatus $71,500
-
2001-06-26price $74,900
ⓘ Source: listings_history table (triggers on properties + properties_extension) + one-shot
backfill from property_details.listing_events for pre-trigger history.
Tax reassessment forecast FL · Resets to sale price
- Current annual tax
- $1,898 · $158/mo
- Projected year-2 tax
- $2,075 · $173/mo
- Expected delta
- +$177/yr (+$15/mo · 9.3%)
ⓘ Screening estimate from a state-policy table — verify with the county assessor before closing.
Climate risk First Street
- Flood 3/10 Moderate FEMA zone X (unshaded) · 12% chance over 30 yrs
- Wildfire 1/10 Low
- Heat 10/10 Extreme 7 d/yr ≥107°F today · 29 d/yr by 30 yrs out
- Wind 10/10 Extreme 99% chance of damaging wind over 30 yrs
- Air quality 2/10 Low 1 unhealthy d/yr today · 1 by 30 yrs out
Nearby sold comps map
Loading sold comps map…
Walkable amenities ~0.75 mi
Loading nearby amenities…
Taxation est. · year 1
- Rental income
- $24,598
- − Mortgage interest
- −$14,004
- − Property taxes
- −$1,898
- − Insurance
- −$1,250
- − Repairs & maintenance
- −$1,968
- − Management
- −$1,968
- − Depreciation
- −$7,273
- Taxable loss
- −$3,762
- Est. tax savings @ 24.0%
- +$903
- After-tax cash flow
- $1,455/yr
For passive investors: Depreciation is non-cash, so a rental often shows a tax loss while cash-flowing — sheltering income. Rental losses are passive: they offset passive income freely, and up to $25,000/yr can offset ordinary (W-2) income if you actively participate and your MAGI is under $100k (phasing out to $0 by $150k); unused losses carry forward. On sale, claimed depreciation is recaptured at up to 25%, and gains may owe capital-gains tax (a 1031 exchange can defer both). Figures are a year-1 estimate at your 24.0% rate — not tax advice; consult a CPA.
Schools (NCES district)
- District
- Lee
- NCES district ID
- 1201080
- Math proficiency
- 47% ▼ -11.00%
- Reading proficiency
- 50% ▼ -4.00%
- Median HH income
- $49,518
- Composite
- 41.49/100
- National rank
- #3458
- State rank
- #42 of 73 in FL
Livability — Cape Coral
- Score
- 77/100
- State rank
- #208
- US rank
- #3098
Category grades
Schools grade is shown separately in the Schools card above.
Census & demographics
- Census place
- Cape Coral, FL
- County
- Lee County · 788,662 people
- City population
- 217,388
- Metro
- Cape Coral-Fort Myers, FL
- Population (ZIP)
- 35,580
- Household income
- $90,577
- Rent vs Own
- Severe rent burden
- 286.0
Population outlook (Lee County) Hauer SSP2
- Today (2025)
- 871,946 people
- By 2030
- 955,468 · +9.6%
- By 2040
- 1,113,587 · +27.7%
- By 2050
- 1,256,891 · +44.1%
- By 2075
- 1,560,270 · +78.9%
- By 2100
- 1,726,848 · +98.0%
Race, ethnicity, and origin ACS 2023
- Neighborhood character
- Diverse neighborhood (Simpson 0.58)
- Race & ethnicity
- White 57% Hispanic / Latino 30% Two or more races 21% Black 7% Asian 2%
- Hispanic origin (detail)
- Mexican 2% Puerto Rican 6% Cuban 17% Dominican 1%
- Common ancestry
- Romanian 2% Hispanic 2% Lithuanian 2%
- Foreign-born
- 21% · Canada, Jamaica, China
- Languages at home
- 73% English-only · Spanish 24% French/Haitian/Cajun 1% Russian/Polish/Slavic 1%
Political lean MEDSL · Lee
- 2024 margin
- Strong R (+28.4) · D 35.5% · R 63.9%
- 2008→2024 swing
- -18.0pp toward R · 2008: -10.4pp · 2024: -28.4pp
- All cycles
- 2024: R+28.4 2020: R+19.2 2016: R+20.4 2012: R+16.6 2008: R+10.4
Not yet ingested
- Civics
- —
Market trends
- HPI YoY
- ▼ -55.34%
- Current HPI
- 337.0575
- Rent YoY
- ▼ -5.51%
- Metro
- Cape Coral-Fort Myers, FL
- State GDP YoY
- ▲ 3.28%
- F500 in state
- 36
Industry mix (Fortune 500 HQ in FL)
| Industry | F500 HQs | Revenue |
|---|---|---|
| Industrial Technology | 2 | $29B |
|
||
| Insurance | 2 | $17B |
|
||
| Retail | 1 | $60B |
|
||
| Technology Distribution | 1 | $58B |
|
||
| Homebuilding | 1 | $35B |
|
||
| Technology Manufacturing | 1 | $35B |
|
||
Price history
+233.8% since first listed7 events — show timeline
- 2026-04-25 Pending — FORTMLS
- 2026-04-16 Relisted — FORTMLS
- 2026-04-08 Pending — FORTMLS
- 2026-04-01 Listed $250,000 FORTMLS
- 2001-07-13 Sold (Public Records) $71,500 Public Records
- 2001-07-05 Sold (MLS) $71,500 FORTMLS
- 2001-06-26 Price Changed $74,900 FORTMLS
Property tax history
+8.2%/yrLatest (2025): $1,898 · +10.2% YoY. Source: county tax records.
Cash-flow waterfall
monthlySold comps — $/sqft
last 12 mo · ≤1 miLoading sold comps…